Rep:Mod:ChemDWMolecule2016
Analysis of the NH3 Molecule
GaussView 5.0 is a handy computational chemistry tool to obtain information and establish optimised structures of chemical species, giving an insight into its symmetry, atomic charge, molecular orbital and energies. To dive deeper into the use of this sophisticated software, an analysis into the ammonia, NH3 molecule was carried out and the following data was obtained.
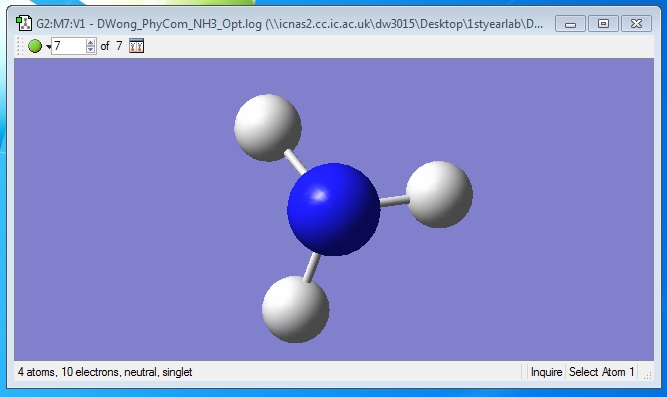
An interactive 3-D ammonia molecule optimised using GaussView 5.0. |
GaussView 5.0 allows us to create and manipulate a molecule of ammonia and thus run an optimisation job to produce the lowest energy structure having the lowest RMS gradient norm. Once the optimised structure was successfully attained, the geometric informations below can be found :-
Optimised N-H bond distance,  B = 1.01798 Angstroms (H2 N1)
Optimised H-N-H bond angle,  A = 105.741 Degrees (H2 N1 H3)
Running the Optimisation
The table below shows the specific set of commands that directs the software on running the optimisation process specific for the case of ammonia.
Ammonia Optimisation

Calculation Type  =  FREQ
Calculation Method  =  RB3LYP
Basis Set  =  6-31G(d,p)
Charge  =  0
Spin  =  Singlet
E(RB3LYP)  =  -56.55776873 a.u.
RMS Gradient Norm  =  0.00000485 a.u.
Imaginary Freq  =  0
Dipole Moment  =  1.8466 Debye
Point Group  =  C3v
More detailed information regarding the optimisation job can be assessed through the original Ammonia log file.
Information from Output
The following data sheet is an excerpt of the log file showing a successfully optimisation with all related items converging :-
Item               Value     Threshold  Converged?
 Maximum Force            0.000004     0.000450     YES
 RMS     Force            0.000004     0.000300     YES
 Maximum Displacement     0.000072     0.001800     YES
 RMS     Displacement     0.000035     0.001200     YES
 Predicted change in Energy=-5.986288D-10
 Optimization completed.
    -- Stationary point found.

 ----------------------------
                           !   Optimized Parameters   !
                           ! (Angstroms and Degrees)  !
 --------------------------                            --------------------------
 ! Name  Definition              Value          Derivative Info.                !
 --------------------------------------------------------------------------------
 ! R1    R(1,2)                  1.018          -DE/DX =    0.0                 !
 ! R2    R(1,3)                  1.018          -DE/DX =    0.0                 !
 ! R3    R(1,4)                  1.018          -DE/DX =    0.0                 !
 ! A1    A(2,1,3)              105.7412         -DE/DX =    0.0                 !
 ! A2    A(2,1,4)              105.7412         -DE/DX =    0.0                 !
 ! A3    A(3,1,4)              105.7412         -DE/DX =    0.0                 !
 ! D1    D(2,1,4,3)           -111.8571         -DE/DX =    0.0                 !
 --------------------------------------------------------------------------------
 GradGradGradGradGradGradGradGradGradGradGradGradGradGradGradGradGradGrad
Frequency Analysis and Vibrations
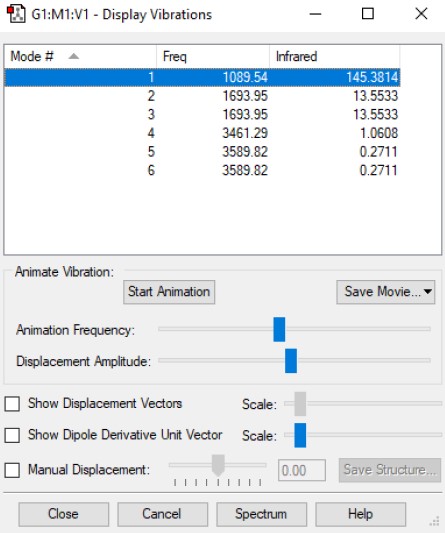
Using the 3N-6 rule obtained from quantum chemistry derivation, the number of vibrational modes expected in ammonia is six. Whereby, 3(4)-6 = 6 modes. Based on the results of the calculations shown in the image above, modes 2 & 3 and modes 5 & 6 are degenerate and have the same energy. Modes 1, 2 & 3 are "bending" vibrations while modes 4, 5 & 6 are identified to be "bond stretch" vibrations. After looking at simulations of each modes, mode 4 is found to be highly symmetric, having maintained its point group throughout the motion of vibration. Another interesting mode is mode 1; it is also known as the "umbrella" mode. Overall, we would expect to see four bands in an experimental spectrum of gaseous ammonia.
Atomic Charges on Ammonia
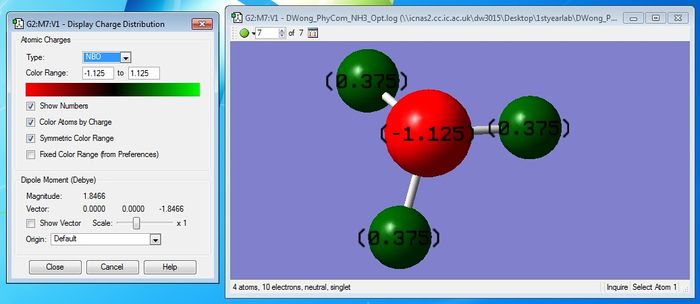
A negative charge is expected to reside on the N-atom and a positive charge on the H-atom, as N is more electronegative than H having a greater affinity to the bonding electrons in each covalent bond. The actual charge on the N-atom and H-atoms are shown above after carrying out calculations using GaussView 5.0 which are consistent with my initial predictions. It is indeed confirmed that the N-atom has a negative charge and the H-atom has a positive charge.
Reaction Energies
The Haber-Bosch process is a method used to mass-produce ammonia by reacting atmospheric nitrogen with hydrogen gas in an industrial process that requires high temperatures and pressure. Here, we can utilise GaussView 5.0 to calculate the reaction energy of this process, but firstly the optimised structures of the starting materials have to be obtained.
Nitrogen, N2
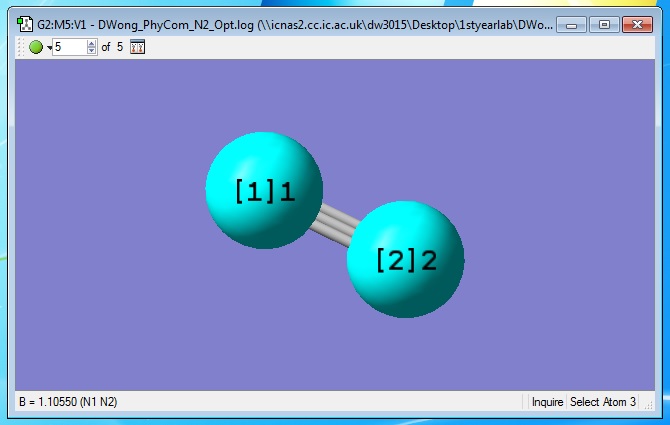
An interactive 3-D nitrogen molecule optimised using GaussView 5.0. |
Nitrogen Optimisation

Calculation Type   =   FREQ
Calculation Method   =  RB3LYP
Basis Set  =  6-31G(d,p)
Charge  =  0
Spin  =  Singlet
E(RB3LYP)  =  -109.52412868a.u.
RMS Gradient Norm  =  0.00000365 a.u.
Imaginary Freq	=  0
Dipole Moment  =  0.0000 Debye
Point Group  =  DinfH
The geometric information about the nitrogen molecule is obtained and the optimised N-N bond distance, B = 1.10550 Angstroms (N1 N2).
The following data sheet is an excerpt of the Nitrogen log file showing a successfully optimisation with all related items converging :-
Item               Value     Threshold  Converged?
 Maximum Force            0.000006     0.000450     YES
 RMS     Force            0.000006     0.000300     YES
 Maximum Displacement     0.000002     0.001800     YES
 RMS     Displacement     0.000003     0.001200     YES
 Predicted change in Energy=-1.248809D-11
 Optimization completed.
    -- Stationary point found.
                           ----------------------------
                           !   Optimized Parameters   !
                           ! (Angstroms and Degrees)  !
 --------------------------                            --------------------------
 ! Name  Definition              Value          Derivative Info.                !
 --------------------------------------------------------------------------------
 ! R1    R(1,2)                  1.1055         -DE/DX =    0.0                 !
 --------------------------------------------------------------------------------
 GradGradGradGradGradGradGradGradGradGradGradGradGradGradGradGradGradGrad
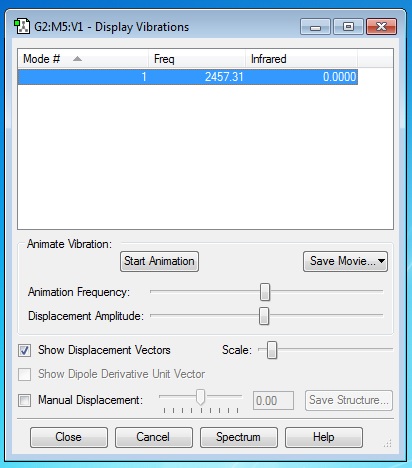
Hydrogen, H2
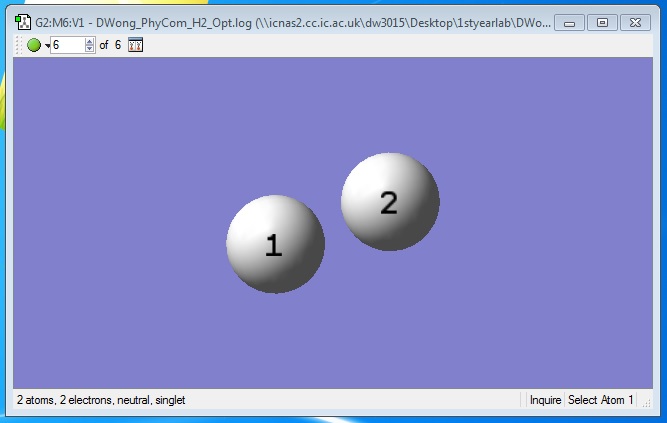
An interactive 3-D hydrogen molecule optimised using GaussView 5.0. |
H2 Optimisation

Calculation Type  =  FREQ
Calculation Method  =  RB3LYP
Basis Set  =  6-31G(d,p)
Charge  =  0
Spin  =  Singlet
E(RB3LYP)  =  -1.17853930 a.u.
RMS Gradient Norm  =  0.00012170 a.u.
Imaginary Freq  =  0
Dipole Moment  =  0.0000 Debye
Point Group  =  DinfH
The geometric information about the nitrogen molecule is obtained and the optimised H-H bond distance, B = 0.74309 Ang (H1 H2)
The following data sheet is an excerpt of the Hydrogen log file showing a successfully optimisation with all related items converging :-
Item               Value     Threshold  Converged?
 Maximum Force            0.000211     0.000450     YES
 RMS     Force            0.000211     0.000300     YES
 Maximum Displacement     0.000278     0.001800     YES
 RMS     Displacement     0.000393     0.001200     YES
 Predicted change in Energy=-5.852867D-08
 Optimization completed.
    -- Stationary point found.
                           ----------------------------
                           !   Optimized Parameters   !
                           ! (Angstroms and Degrees)  !
 --------------------------                            --------------------------
 ! Name  Definition              Value          Derivative Info.                !
 --------------------------------------------------------------------------------
 ! R1    R(1,2)                  0.7431         -DE/DX =   -0.0002              !
 --------------------------------------------------------------------------------
 GradGradGradGradGradGradGradGradGradGradGradGradGradGradGradGradGradGrad

Determining Energy of Reaction of N2 + 3H2 --> 2NH3
The Haber-Bosch process proceeds as the following:- N2 + 3H2 --> 2NH3. Calculations to deduce the reaction enthalpy is shown below and the answer is corrected to 2 decimal places in the units of kJ/mol.
E(NH3)  =  -56.55776873 a.u.
2*E(NH3)  =  -113.11553746 a.u.
E(N2)  =  -109.52412868 a.u.
E(H2)  =  -1.17853930 a.u.
3*E(H2)  =  -3.5356179 a.u.
ΔE = 2*E(NH3)-[E(N2)+3*E(H2)]  =  -0.05579088 a.u.

ΔE = -0.05579088*2625.5  =  -146.48 kJ/mol
Since ΔE of the forward reaction is negative/exothermic, the ammonia product is more energetically stable compared to the gaseous reactants.
Molecular Orbitals of N2
The knowledge and understanding obtained from looking and analysing the molecular orbitals of the nitrogen molecule will be used to further describe and explain the nature of the molecular orbitals of methane in the next part of this investigation article.
A Molecule of My Choice - CH4
The small simple molecule I have chosen for my further investigation is methane, which is the simplest alkane with the molecular formula of CH4. The same method of analysis was conducted on methane using GaussView 5.0 with that done earlier with the ammonia molecule to obtain an optimised methane structure and carrying out a frequency analysis while looking its charges and molecular orbitals.
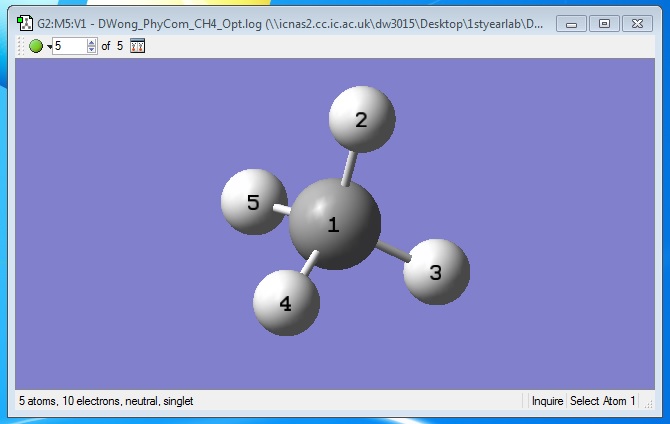
An interactive 3-D methane molecule optimised using GaussView 5.0. |
After attaining the optimised structure, the correct geometric informations of methane can be identified :-
Optimised C-H bond distance,  B  =  1.09194 Angstroms (C1 H2)
Optimised H-C-H bond angle,  A  =  109.471 Degrees (H2 C1 H3)
Running the Optimisation
The specific set of commands that is carried out during the optimisation process of methane is displayed in the table below.
Methane Optimisation

Calculation Type  =  FREQ
Calculation Method  =  RB3LYP
Basis Set  =  6-31G(d,p)
Charge  =  0
Spin  =  Singlet
E(RB3LYP)  =  -40.52401405 a.u.
RMS Gradient Norm  =  0.00002267 a.u.
Imaginary Freq  =  0
Dipole Moment  =  0.0000 Debye
Point Group  =  Td
Further information associated to the optimisation job can be assessed through the Methane log file.
Information from Output
The data sheet below is the log file excerpt illustrating a successful optimisation with all related items converging :-
Item               Value     Threshold  Converged?
 Maximum Force            0.000044     0.000450     YES
 RMS     Force            0.000023     0.000300     YES
 Maximum Displacement     0.000124     0.001800     YES
 RMS     Displacement     0.000066     0.001200     YES
 Predicted change in Energy=-1.089028D-08
 Optimization completed.
    -- Stationary point found.
                           ----------------------------
                           !   Optimized Parameters   !
                           ! (Angstroms and Degrees)  !
 --------------------------                            --------------------------
 ! Name  Definition              Value          Derivative Info.                !
 --------------------------------------------------------------------------------
 ! R1    R(1,2)                  1.0919         -DE/DX =    0.0                 !
 ! R2    R(1,3)                  1.0919         -DE/DX =    0.0                 !
 ! R3    R(1,4)                  1.0919         -DE/DX =    0.0                 !
 ! R4    R(1,5)                  1.0919         -DE/DX =    0.0                 !
 ! A1    A(2,1,3)              109.4712         -DE/DX =    0.0                 !
 ! A2    A(2,1,4)              109.4712         -DE/DX =    0.0                 !
 ! A3    A(2,1,5)              109.4712         -DE/DX =    0.0                 !
 ! A4    A(3,1,4)              109.4712         -DE/DX =    0.0                 !
 ! A5    A(3,1,5)              109.4712         -DE/DX =    0.0                 !
 ! A6    A(4,1,5)              109.4712         -DE/DX =    0.0                 !
 ! D1    D(2,1,4,3)           -120.0            -DE/DX =    0.0                 !
 ! D2    D(2,1,5,3)            120.0            -DE/DX =    0.0                 !
 ! D3    D(2,1,5,4)           -120.0            -DE/DX =    0.0                 !
 ! D4    D(3,1,5,4)            120.0            -DE/DX =    0.0                 !
 --------------------------------------------------------------------------------
 GradGradGradGradGradGradGradGradGradGradGradGradGradGradGradGradGradGrad
Frequency Analysis and Vibrations
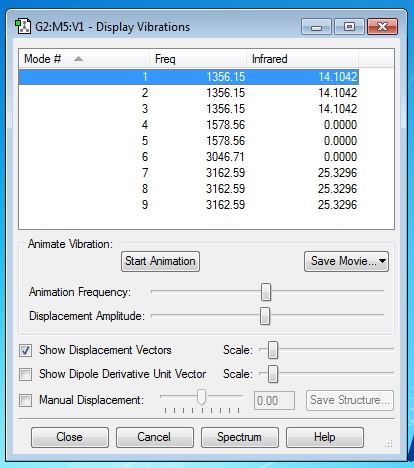
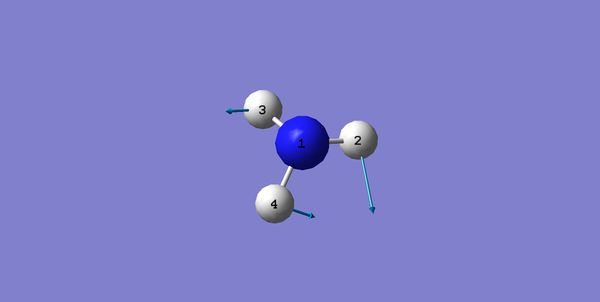
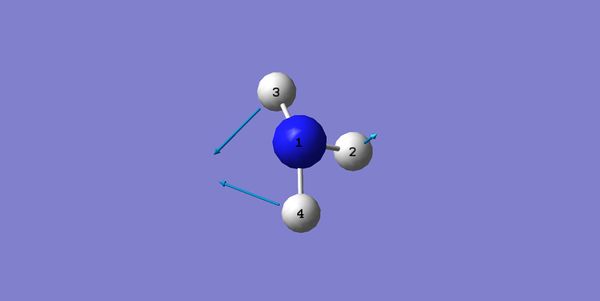
Applying the 3N-6 rule obtained like we did before, we obtain the expected of number of vibrational modes of methane, that is nine, whereby 3(5)-6 = 9 modes. Referring to the table above generated by GaussView 5.0, modes 1,2 & 3, modes 4,5 & 6 and modes 7,8 & 9 are found to have the same energy (or said to be degenerate). When analysing the simulation for each mode, I can deduce that modes 1 to 5 are "bending" vibrations while modes 6 to 9 are "bond stretch" vibrations. Mode 6 in particular, is found to be highly symmetric. The methane molecule is able to maintain its point group throughout the stretching vibration. Hence, we would expect to see three distinct bands in an experimental spectrum of gaseous methane.
Atomic Charges
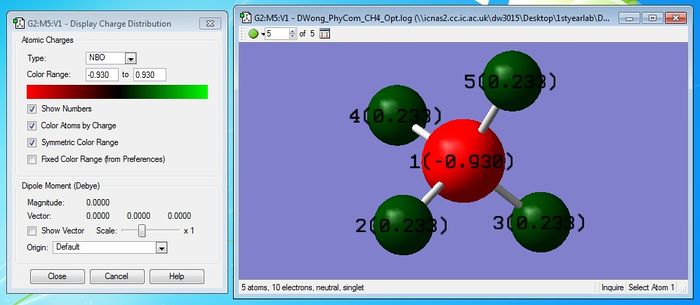
Although carbon is more electronegative than hydrogen, the small difference in electronegativity of both atoms actually mean that we can assume the methane molecule to be neutral and consists of non-polar sigma bonds. Thus, the molecule will not have an overall dipole moment.
Molecular Orbitals of CH4

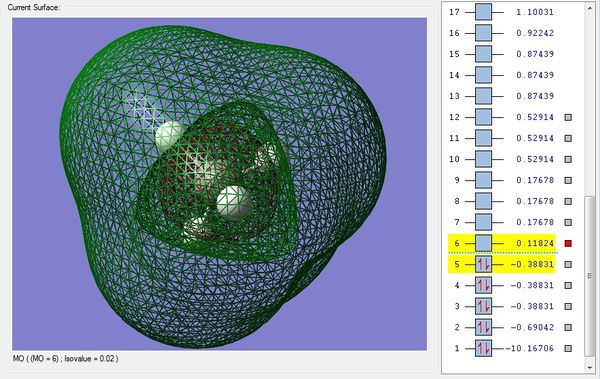

Picture 1 - This is the MO consisting only of the 1s AO of carbon that does not take part in bonding. The MO is the deepest in energy with -10.16706 a.u.
Picture 2 - The sigma bonding MO formed from the overlap between 2s carbon AO and one 1s hydrogen AO. This MO is higher in energy with -0.69042 a.u.
Picture 3 - The MO formed from the overlap of only the 2px carbon AO with one 1s hydrogen AO. This MO is degenerate with the two other MOs that includes the 2py and 2pz bonding with the remaining two 1s hydrogen AOs. All three MOs have -0.38831 a.u. of energy. These MOs are the HOMO of the methane molecule.
Picture 4 - This is the sigma anti-bonding MO that is also the LUMO of the methane molecule, having an energy of 0.11824 a.u.
Picture 5 - This is the final sigma anti-bonding MO having the highest energy of 0.17678 a.u.
.
