Rep:Mod:CaterinaBrighi
Experiment 1C: Advanced molecular modelling and assigning the absolute configuration of an epoxide
The use of computer modelling simulations is a powerful technique which allows to rationalise and-or predict the outcome of chemical reactions and to understand the mechanisms which regulate their behaiviour.
The aim of this module is to use a computational method to calculate the thermal free energy of different conformers, the optical rotation of different enantiomers and simulate their NMR and VCD spectra.
The experiment is divided into two sections. The first section involves learning basic operational techniques, such as optimizing the geometry of ciclopentadiene dimer and of an intermediate related to the synthesis of Taxol, and simulating the 13C and 1H NMR spectra for the last one. The second part is concerned with the application of the techniques learned in the first section to assign the stereochemistry of epoxides synthesized in the lab.
Part 1: Conformational analysis using Molecular Mechanics
Dimerisatiojn of Cyclopentadiene and Hydrogenation of the Dimer
Endo vs Exo Stereoselectivity of Cyclopentadiene Dimer
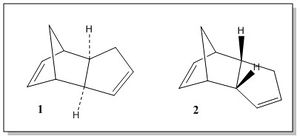
The dimerisation of cyclopentadiene is an example of Diels-Alder reaction, which involves the [π4s + π2s] cycloaddition of two cyclopentane molecules to give a dimer. The resulting dimer exists in two possible conformations, the Exo (1) and the Endo (2), each of which is generated by a different approach of the diene to the dienophile in the transition state. If the cyclopentadiene acting as dienophile approaces the diene with the substituents groups directed towards the diene, the endo product is formed; on the other hand, if the substituents are directed away from the diene the exo product forms.[1] The two different mechanisms for the formation of the endo and exo products are shown in Figure 1.
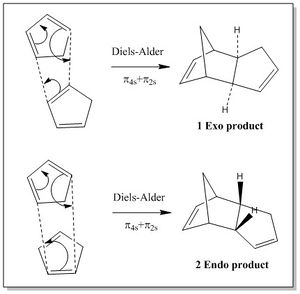
Many examples of Diels-Alder reactions report that the endo conformer is usually preferred over the exo conformer, and this stereopreference is due to the fact that the reaction is under kinetics rather than thermodynamic control. This means that the predominant product is the one which forms via the lowest energetic transition state (TS), rather than the most thermodynamically stable. Thus, in order to understand the endo stereoselection of this reaction one has to consider the factors favouring the endo or disfavouring the exo TS.
Woodward and Hoffmann suggested secondary orbital overlap (SOO) as factors favouring the endo TS, while unfavourable steric interactions are believed to disfavour the exo TS.
The SOO interaction favouring the endo TS arises from the overlap of the diene's frontier orbital with the π bond of the dienophile not taking part in the bond formation. In fact, such interaction is not present in the exo TS. The steric interactions disfavouring the exo TS are due to the presence of the methylene group clashing with the hydrogens of the bridging sp3 carbon atom.[2]
The objective of this section is to determine, by means of the results obtained from the molecular mechanics technique, whether the cyclodimerisation of cyclopentadiene and the hydrogenation of the dimer is kinetically or thermodynamically controlled. In order to do that, the structures of the "Exo" and "Endo" dimers have been optimized using the Avogadro software and setting the following parameters:
- Force Field: MMFF94s
- Steps per update: 4
- Algorithm: Conjugate Gradients
| 1 Exo Dimer | 2 Endo Dimer | |||||||
|---|---|---|---|---|---|---|---|---|
| Structure |
|
| ||||||
| Total Energy (kcal/mol) | 55.37344 | 58.19070 | ||||||
| Bond Stretching (kcal/mol) | 3.54305 | 3.46742 | ||||||
| Angle Bending (kcal/mol) | 30.77272 | 33.19140 | ||||||
| Stretch Bending (kcal/mol) | -2.04139 | -2.08211 | ||||||
| Torsional (kcal/mol) | -2.73108 | -2.94939 | ||||||
| Out-of-plane Bending (kcal/mol) | 0.01486 | 0.02196 | ||||||
| Van der Waals (kcal/mol) | 12.80156 | 12.35718 | ||||||
| Electrostatic (kcal/mol) | 13.01372 | 14.18424 |
The different thermodynamic stability of the two conformers has been investigate by computing and comparing the total energy and the different energy contributions of their optimized structures.
The results collected in Table 1 show that the exo conformer is more thermodynamically stable than the endo one of 2.82 kcalmol-1. This result support the prediction that the reaction must proceed under kinetic control.
By looking at the different components contribution to the total energy between the two dimers, one can observe that the major contribution to the total energy difference between the two conformers is given by the angle bending energy term. This term, contributing to the 85.8% of the total energy difference between the two dimers, is the main factor determining the thermodynamic instability of the endo conformer.
In order to understand the origin of this angle bending energy term instability one has to consider that the the C-C-C bond angle at the junction between the 2 rings is larger than the ideal bond angle for thetrahedral sp3 hybridised centres, which is 109.5o. In particular, in the exo product the C-C-C angle is 114.9o, while in the endo product it is 117.8o. Thus, since the deviation from 109.5o is larger for the endo than for the exo product, the destabilisation of the former is greater than the destabilisation of the latter.
The Hydrogenation of the Endo Cyclopentadiene Dimer
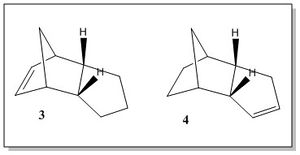
The hydrogenation of the endo cyclopentadiene dimer proceeds via a two steps mechanism, which involves the hydrogenation of the double bond in one ring, followed by the hydrogenation of the double bond in the other ring, as shown by the scheme in Figure 2. The first step produces one of the dihydro derivative 3 and 4. The 3 derivative is obtained from the hydrogenation of the double bond in the cyclopentene ring, while the 4 derivative in the norborene ring.[3]
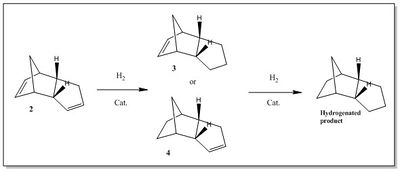
In this section a molecular mechanic approach has been used to predict which one between 3 and 4 is the most thermodynamically favourable derivative, and hence to predict whether the hydrogenation of the dimer is kinetically or thermodynamically controlled.
The geometries of 3 and 4 have been optimized with the Avogadro software by using a MMFF94s force field method and the same set o parameters used for the optimization of 1 and 2.
The computations of the total energy and the different energetic contributions of 3 and 4 stable structures are reported in Table 2. The results show that 4 is more thermodynamically stable than 3 of 9.46 kcalmol-1, hence it is expected to be the first hydro derivative in the hydrogenation step. This result is in fact in agreement with the experimental observations, which report the double bond in the norborene ring being hydrogenated before the double bond in the cyclopentene ring.[3] Therefore, in light of these observations, the hydrogenation of the endo cyclopentadiene dimer appears to proceed under thermodynamic control.
| 3 Hydro derivative | 4 Hydro derivative | |||||||
|---|---|---|---|---|---|---|---|---|
| Structure |
|
| ||||||
| Total Energy (kcal/mol) | 50.72290 | 41.25749 | ||||||
| Bond Stretching (kcal/mol) | 3.30877 | 2.82297 | ||||||
| Angle Bending (kcal/mol) | 30.86437 | 24.68571 | ||||||
| Stretch Bending (kcal/mol) | -1.92685 | -1.65713 | ||||||
| Torsional (kcal/mol) | 0.05620 | -0.37800 | ||||||
| Out-of-plane Bending (kcal/mol) | 0.01533 | 0.00028 | ||||||
| Van der Waals (kcal/mol) | 13.28407 | 10.63664 | ||||||
| Electrostatic (kcal/mol) | 5.12100 | 5.14702 |
The analysis of the different energy components of the two derivatives structures shows that the main contributions to the stability of 4 over 3 are the angle bending, the torsioanl and the Van der Waals energy terms. In fact, the first contributes to 65% of the total energy difference of the two derivatives, the second 4.6% and the third 30%. All the other energy contributions are similar for the two derivatives. The origins of the angle bending and the Van der Waals unfavourable interactions have been analysed as follows.
The unfavourable angle bend interactions are due to the bond angles at the sp2 hybridised centre, which, for both species, deviates from the ideal sp2 bond angle of 120o. The 3 hydro derivative, having the double bond in the norborene ring, has a bond angle of 107.2o at the sp2 centre, as can be observed from the molecular model in Table 2. On the other hand, the 4 hydro derivative, which has the double bond in the cyclopentene ring, has an sp2 bond angle of 112.0o. Hence, 4 has a lower degree of angle bending instability than 3, since its sp2 bond angle deviates less from 120o than the sp2 bond angle in 3.
The high contribution to the instability of the structures given by theVan der Waals energy term arises from Van der Waals repulsive interactions between pairs of H atoms. In order to facilitate the visualization of these interactions, the H atoms involved have been highlighted in yellow and the H-H distance have been indicated in the molecular models in Table 2. It can be observed that 3 presents three of such repulsive interactions (H11-H12: 0.232 nm, H21-H23: 0.236 nm,H21-H19: 0.236 nm), while 4 has only one (H21-H16: 0.221 nm). Therefore, the destabilising Van der Waals energy contribution is grater for 3 than for 4.
Overall, the results of the analysis of the angle bending and Van der Waals energy contributions to the total destabilization energy show how 3 is more thermodynamically instable than 4.
Comparison of Atropisomers 9 and 10
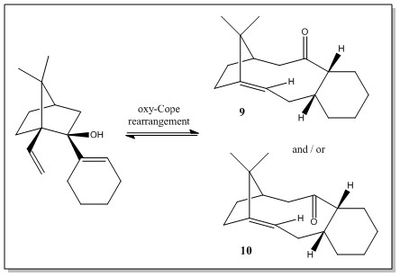
This section contains the analysis of the key intermediate 9 or 10 in the synthesis of Taxol, an important molecule known for its anti-cancer properties.
Paquette et al.[4] first proposed a synthesis of the intermediate 9 or 10 via a reversible oxy-Cope rearrangement, which is illustrated in Figure 3.[4] The intermediates 9 and 10 are atropisomers, i.e. stereoisomers that can not interconvert into each other due to the restricted rotation around a single covalent bond.[5] In the case of 9 and 10 the restricted rotation of the C-C bond at the rings junction results in the two isomers having the carbonyl group pointing in the same or in the opposite direction of the isopropyl bridge.
Since the oxy-Cope rearrangement reported by Paquette et al.[4] occurs at equilibrium, the most thermodynamically stable isomer should form prevalently. Thus, the first objective of this section is to predict, by means of mechanical modelling computations, which between 9 and 10 is the thermodynamic product.
Furthermore, an important remark is that each isomer can adopt different conformations, which differ from each other in the conformation of the cyclohexane ring. Cyclohexane has four energy minima corresponding to two chair and two twisted-boat conformations. Thus, four stable conformers for each atropisomer are expected. Thus, the second task of this section is to predict which is the most stable conformation of each atropisomer.
In order to perform the computations described above, the geometry of 9 and 10 has been optimised by using the Avogadro software, adopting a MMFF94s force field and conjugate gradients as algorithm. Table 3 reports the results obtained from the calculations of all the energy components of four different conformers of 9, i.e. twisted-boat, chair(1), boat, chair(2). The results of 10, for which two twisted-boat (t-b(1) and t-b(2)) and two chair (chair(1) and chair(2)) conformations have been analysed, are instead collected in Table 4
| 9 Twisted-Boat Conformation | 9 Chair(1) Conformation | 9 Boat Conformation | 9 Chair(2) Conformation | |||||||||||||
|---|---|---|---|---|---|---|---|---|---|---|---|---|---|---|---|---|
| Structure |
|
|
|
| ||||||||||||
| Total Energy (kcal/mol) | 80.38200 | 74.78786 | 85.13076 | 77.33368 | ||||||||||||
| Bond Stretching (kcal/mol) | 8.42837 | 8.27672 | 8.36593 | 8.07453 | ||||||||||||
| Angle Bending (kcal/mol) | 28.44254 | 26.15715 | 36.65375 | 31.49571 | ||||||||||||
| Stretch Bending (kcal/mol) | -0.48737 | -0.52714 | -0.22514 | -0.10329 | ||||||||||||
| Torsional (kcal/mol) | 4.26181 | 2.75903 | 1.91067 | 1.40307 | ||||||||||||
| Out-of-plane Bending (kcal/mol) | 1.11929 | 1.06359 | 1.14995 | 0.50097 | ||||||||||||
| Van der Waals (kcal/mol) | 38.20989 | 36.60150 | 37.01023 | 35.91092 | ||||||||||||
| Electrostatic (kcal/mol) | 0.40747 | 0.45701 | 0.26537 | 0.05178 |
| 10 Twisted-Boat(1) Conformation | 10 Twisted-Boat(2) Conformation | 10 Chair(1) Conformation | 10 Chair(2) Conformation | |||||||||||||
|---|---|---|---|---|---|---|---|---|---|---|---|---|---|---|---|---|
| Structure |
|
|
|
| ||||||||||||
| Total Energy (kcal/mol) | 69.03250 | 66.29445 | 74.74098 | 60.55409 | ||||||||||||
| Bond Stretching (kcal/mol) | 7.92655 | 7.76080 | 8.78293 | 7.60382 | ||||||||||||
| Angle Bending (kcal/mol) | 20.95786 | 19.00764 | 22.15604 | 18.84061 | ||||||||||||
| Stretch Bending (kcal/mol) | -0.05285 | -0.13472 | -0.18571 | -0.14023 | ||||||||||||
| Torsional (kcal/mol) | 4.46788 | 3.76359 | 5.49687 | 0.20046 | ||||||||||||
| Out-of-plane Bending (kcal/mol) | 0.96276 | 0.95659 | 1.64884 | 0.84832 | ||||||||||||
| Van der Waals (kcal/mol) | 34.80907 | 35.00223 | 36.43171 | 33.25601 | ||||||||||||
| Electrostatic (kcal/mol) | -0.03877 | -0.06167 | 0.41029 | -0.05490 |
By comparison of the total energy of the conformers of 9 and those of 10, it is clear that 10 is the most stable atropisomer, since all its conformers are lower in energy than the conformers of 9. In particular, the greatest contribution to 9 instability over 10 is given by the angle bending term, which is 8 kcalmol-1 greater for the most stable conformer of 9 (chair(1)) than for the most stable conformer of 10 (chair (2)). Hence, 10 is the thermodynamic product. The stability of each conformers of 9 and 10 have been analysed and compared.
The atropisomer 9 has four different conformers: twisted-boat, chair(1), boat, chair(2). From inspection of Table 3 it emerges that the two chair conformations are thermodynamically more stable of about 10 kcalmol-1 than the twisted-boat and boat conformations. This result conforms with the expectations, since the energy profile of cyclohexane shows that the two chair conformations energy minima are in fact slightly lower in energy than the two twisted boat energy minima. However, an energy difference between the two chair conformers of 9 is also observed; as it appears from Table 3 the chair(1) conformer is more stable than the chair(2) conformer of about 2.5 kcalmol-1. The instability of chair(2) seems to arise mainly from the angle bending energy term, which is 5.34 kcalmol-1 greater than in chair(1) one, and from the torsional strain, 1.36 kcalmol-1 greater than in chair(1). The angle bending energy term is greater for chair(2) because the C2-C3-C12 angle at the sp2 carbon centre in chair(2), which is 128.0o, deviates more from the ideal sp2 bond angle than the C6-C10-C15 angle at the sp2 carbon centre in chair(1), which is 124.7o.
The atropisomer 10 has two chair and two twisted boat conformers. Table 4 shows that the chair(1) conformation is the most unstable, since all the energy contributions are higher than for the other conformers. In particular angle beding, torsional strain and Van der Waals terms give the greater contribution to chair(1) instability. The molecular model in Table 4 show 3 of the VdW unfavourable H-H interactions and the strain in bond angle at the sp2 hybridised C4 being 124.7o, which deviates from the ideal 120.0o. Then, the lowest energy conformations are in order twisted-boat(1), twisted-boat(2) and chair(2). T-b(1) is 2.7 kcalmol-1 higher in energy than t-b(2) mainly beacuse of the higher angle bending energy term. In fact, the molecular models in Table 4 highlight that the bond angle at the sp2 hybridised C4 is 124.0o and 124.7o for t-b(2) and t-b(1), respectively. The remaining contributions to the greater t-b(1) instability compared to t-b(2) are given by the higher torsional strain and the Van der Waals repulsive interaction of H19-H32, highlighted in yellow in the model of Table 4. Therefore, the most stable conformer of 10 is chair(2), which has a much lower value of torsional starin compared to all the other conformers. Furthermore, also the angle bending term is lower in energy, since the sp2 C4 bond angle of 123.7o is slightly closer to the sp2 ideal bond angle. Finally, chair(2) is more stable over t-b(2) due to the absence of the unfavourable VdW interaction of H19-H32, as H32 points outwards rather than toward H19.
In conclusion, atropisomer 10 is the thermodynamic product and its most stable conformation is chair(2).
9 and 10 as examples of Hyperstable Alkenes
According to Lesko and Turner[6] , energy strain term of bridgehead olefins is the result of two contributions: the strain associated with the carbon skeleton and the strain induced by the C=C double bond. This last contribution is defined as olefinic starin (OS), and can be considered as a measure of the olefin instability. [7] OS is defined as the difference between the total strain energy of the olefin in its most stable conformation and that of the most stable conformer of its parent hydrocarbon. Usually bridjehead olefins have positive OS values, however, a new class of hyperstable olefins happens to have negative OS values, which means that they contain less strain than the parent hydrocarbons. The characteristic unreactivity of hyperstable olefins is a consequence of their special stability, which is due to the cage structure of the olefin and its location at a bridgehead, rather than to steric hindrance or enhanced π bond strength.[8] Compounds 9 and 10 have been observed to react abnormally slowly upon subsequent alkene functionalisation, which leads to the hypothesis that they are examples of hyperstable olefins.[9]
Therefore, this section is concerned with the verification of the above hypothesis by means of molecular mechanics computations. The structures of 9 and 10 (in their most stable conformation, i.e. chair(1) and chair(2), respectively) parent hydrocarbons (PHC) have been optimised in the Avogadro software by using a MMFF9s force field, conjugate alogorithm, in order to obtain their total energy and hence calculate the OS, as described above.
| 9 PHC | 10 PHC | |||||||
|---|---|---|---|---|---|---|---|---|
| Structure |
|
| ||||||
| Total Energy (kcal/mol) | 82.05683 | 73.94037 | ||||||
| Bond Stretching (kcal/mol) | 8.27774 | 6.94625 | ||||||
| Angle Bending (kcal/mol) | 27.39316 | 24.39150 | ||||||
| Stretch Bending (kcal/mol) | -0.02607 | 0.32844 | ||||||
| Torsional (kcal/mol) | 9.22404 | 8.95787 | ||||||
| Out-of-plane Bending (kcal/mol) | 0.12299 | 0.26756 | ||||||
| Van der Waals (kcal/mol) | 37.06497 | 33.04876 | ||||||
| Electrostatic (kcal/mol) | 0.00000 | 0.00000 |
The results of the optimization calculations, reported in Table 5, show that the 9 PHC and 10 PHC have a total energy of 82.06 kcalmol-1 and 73.94 kcalmol-1, respectively. By subtraction of these values from the total energies of 9 and 10, the OS are found to be equal to -7.27 kcalmol-1 for 9 and -13.39 kcalmol-1 for 10. Thus, the negative OS values confirm that 9 and 10 are more stable than their PHCs, hence they are examples of hyperstable olefins. The greatest contribution to higher instability of the PHCs compared to the olefins is given by the angle bending energy term. This is explained by considering that the C2-C3-C12 bond angles in the 9 PHCs is 122.5o and the C3-C4-C5 bond angles in the 10 PHCs is 122.1o, values which strongly deviates from the ideal sp3 hybridised bond angle of 109.5o, hence resulting in a large amount of strain in these molecules. On the other hand, the same C in the alkene is sp2 hybridised, thus the C6-C10-C15 bond angle of 124.7o in 9 and the C3-C4-C5 bond angle of 123.7o in 10 better match the ideal sp2 bond angle, conferring to 9 and 10 higher stability than their PHCs.
Spectroscopic Simulations using Quantum Mechanics
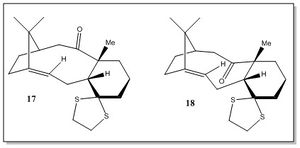
This section is concerned with the spectroscopic analysis of compounds 17 and 18, which are derivatives of compounds 9 and 10, respectively. The most stable atropisomer between 17 and 18 corresponds to the the intermediate involved in the synthesis of Taxol. From the results previously obtained from the analysis of 9 and 10, one would expect the 18 derviative of the chair(2) 10 being the most stable conformer. In order to check rigorously which one is corresponds to the lowest energy intermediate, the geometry of 17 and of three conformers of 18 (chair, twisted boat and boat) has been optimised. Then, a spectroscopic analysis of 1H and 13C NMR of the most stable intermediate has been performed and compared with the literature.
The goemety optimization calculations have been carried out with the Avogadro software, by using the MMFF94s mechanics force field, conjugate gradient algorithm, and the results are collected in Table 6.
By inspection of the results in Table 6, it emerges that all the 18 conformers are lower in energy than 17, and, as expected, the most stable between the three conformers of 18 is the chair one.
| 17 Chair Conformation | 18 Twisted-Boat Conformation | 18 Chair Conformation | 18 Boat Conformation | |||||||||||||
|---|---|---|---|---|---|---|---|---|---|---|---|---|---|---|---|---|
| Structure |
|
|
|
| ||||||||||||
| Total Energy (kcal/mol) | 114.01143 | 109.38277 | 100.50706 | 102.24686 | ||||||||||||
| Bond Stretching (kcal/mol) | 15.88996 | 14.86388 | 15.05855 | 14.40357 | ||||||||||||
| Angle Bending (kcal/mol) | 35.43269 | 28.99550 | 30.74534 | 28.38813 | ||||||||||||
| Stretch Bending (kcal/mol) | 0.80797 | -1.66184 | 0.66447 | 0.48941 | ||||||||||||
| Torsional (kcal/mol) | 14.3702 | 13.60756 | 9.71850 | 13.81418 | ||||||||||||
| Out-of-plane Bending (kcal/mol) | 0.98765 | 4.29163 | 0.89092 | 1.01787 | ||||||||||||
| van der Waals (kcal/mol) | 53.66109 | 47.11525 | 49.47404 | 50.51655 | ||||||||||||
| Electrostatic (kcal/mol) | -7.13820 | 2.17078 | 6.04476 | -6.38286 |
Free energy considerations of the two Atropisomers
For argument's sake, in order to confirm the higher stability of 18, the geometry of 17 and 18 atropisomers in their chair conformation has been further optimized in GaussView software, by using the following parameters:
- Method: DFT
- Theory: B3LYP
- Basis: 6-31G(d,p)
| Gibbs Free Energy G (Hartrees) | Gibbs Free Energy G (kJmol-1) | ΔG (kJmol-1) | Equilibrium constant K | |
|---|---|---|---|---|
| Atropisomer 17 | -1651.446632 | -4335873.463 | -43.659443 | 1.017769024 |
| Atropisomer 18 | -1651.463261 | -4335917.122 |
The values of Gibbs Free Energy G of 17 and 18 obtained with such method, which are collected in Table 7, show that the G18 is indeed lower than the G17 of kcalmol-1. Moreover, the equilibrium constant K, obtained from the rearranging the equation
into
is greater than 1, meaning that the equilibrium is solution is shifted towards intermediate 18.
This result justifies the choice of performing a NMR spectra simulation only for two of the 18 conformers (chair and boat), in order to have a better overlap with the NMR data experimenally observed.
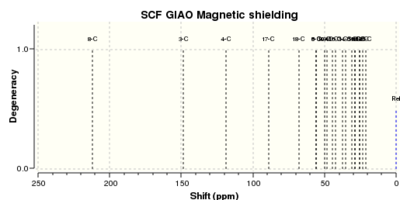
1H and 13C NMR Results obtained from GaussView
After having determined that 18 is the most stable atropisomer, 1H and 13C NMR spectra simulations have been performed for the two most stable conformations (chair and boat) and have been compared with the literature.
It is important to mention that, while a statistical analysis of the computed results has been performed for 13C NMR to show the degree of agreement with the experimental values, this has not been possible for 1H NMR data. The reason for this is that in the literature some protons are grouped in a range of chemical shift and their multiplicity is not esplicit, thus it is not possible to calculate the deviation of the computed 𝛿 of all the individual protons from the experimental values.
Moreover, in order to have a more complete analysis of the proton NMR spectra, the calculation of the spin-coupling values could be included in the computational simulation. However, due to time constraints this has not been done, since the assignment of the coupling constant to the large number of protons present in the molecules under investigation would have required an enormous amount of computational time.
For the simulations, the 18 conformers structure (previously optimized with Avogadro) has been optimized with GaussView using a DFT method, B3LYP theroy, 6-31G(d,p) basis set, GD3 empirical dispersion model and d-chloroform as solvent. The full code used is as follows:
# B3LYP/6-31G(d,p) Opt SCRF=(CPCM,Solvent=chloroform) Freq NMR EmpiricalDispersion=GD3
| Chair Conformation | Boat Conformation | |
|---|---|---|
| Structure | 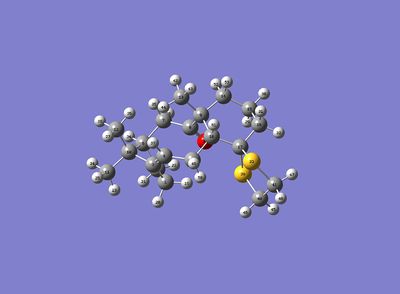 DOI:10042/27422 DOI:10042/27422 |
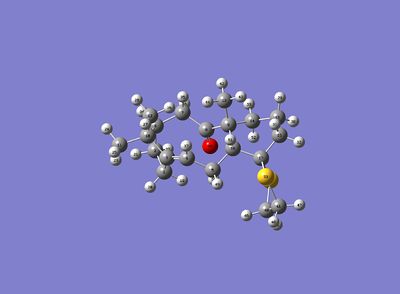 DOI:10042/27423 DOI:10042/27423
|
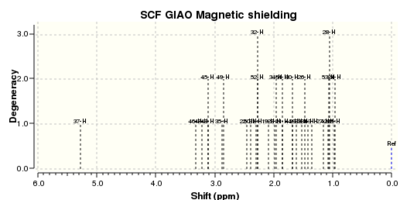
| 1H NMR Spectrum | 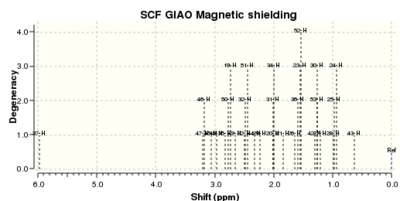 |
 |
| 13C NMR Spectrum | 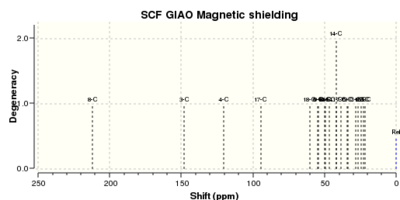 |
 |
Computed 1H NMR Data and comparison with the literature values
The 1H NMR raw data are collected in Table 9. A full assignment of the labelled protons chemical shift has been attempted and compared with the literature assignment, as shown in Table 10.
| Atom # | Chair Conformation | Atom # | Boat Conformation | ||
|---|---|---|---|---|---|
| Computed 𝛿 (ppm) | Intensity | Computed 𝛿 (ppm) | Intensity | ||
| 37 | 5.97 | 1 | 37 | 5.28 | 1 |
| 47 | 3.20 | 1 | 46 | 3.32 | 1 |
| 46 | 3.18 | 2 | 47 | 3.22 | 1 |
| 45 | 3.06 | 1 | 48 | 3.12 | 1 |
| 48 | 2.96 | 1 | 45 | 3.12 | 2 |
| 35 | 2.82 | 1 | 35 | 2.87 | 1 |
| 50 | 2.77 | 2 | 49 | 2.85 | 2 |
| 19 | 2.73 | 3 | 22 | 2.45 | 1 |
| 49 | 2.65 | 1 | 50 | 2.40 | 1 |
| 22 | 2.50 | 1 | 31 | 2.30 | 1 |
| 32 | 2.49 | 2 | 52 | 2.27 | 2 |
| 51 | 2.44 | 3 | 32 | 2.27 | 3 |
| 44 | 2.33 | 1 | 19 | 2.09 | 1 |
| 29 | 2.23 | 1 | 20 | 1.98 | 1 |
| 20 | 2.01 | 1 | 34 | 1.95 | 2 |
| 31 | 2.00 | 2 | 21 | 1.85 | 1 |
| 34 | 2.00 | 3 | 51 | 1.85 | 2 |
| 21 | 1.84 | 1 | 44 | 1.68 | 1 |
| 26 | 1.64 | 1 | 30 | 1.68 | 2 |
| 36 | 1.59 | 2 | 29 | 1.62 | 1 |
| 23 | 1.55 | 3 | 23 | 1.52 | 1 |
| 52 | 1.54 | 4 | 26 | 1.48 | 2 |
| 42 | 1.30 | 1 | 36 | 1.42 | 1 |
| 53 | 1.26 | 2 | 43 | 1.35 | 1 |
| 30 | 1.26 | 3 | 27 | 1.16 | 1 |
| 27 | 1.20 | 1 | 42 | 1.08 | 1 |
| 28 | 0.98 | 1 | 53 | 1.06 | 2 |
| 25 | 0.97 | 2 | 28 | 1.05 | 3 |
| 24 | 0.93 | 3 | 25 | 0.97 | 1 |
| Literature [10] | Computed Results | ||
|---|---|---|---|
| Assignemd Atom # | δ (ppm) | ||
| 18 Chair Conformation | 18 Boat Conformation | ||
| 5.21 (m, 1H) | 37 | 5.97 | 5.28 |
| 3.00-2.70 (m, 6H) | 35/ 49/ 50/ 22/ 31/ 32 | 2.82-2.49 | 2.87-2.27 |
| 2.70-2.20 (m, 4H) | 45-48 | 3.20-2.96 | 3.32-3.12 |
| 2.70-2.20 (m, 6H) | 19/ 34/ 20/ 21/ 29/ 30 | 2.73-1.84 | 2.09-1.62 |
| 1.58 (t, 1H) | 51 | 2.44 | 1.85 |
| 1.50-1.20 (m, 3H) | 36/ 52/ 53 | 1.59-1.26 | 1.42-1.06 |
| 1.10 (m, 3H) | 42-44 | 1.44 ((2.33+1.30+0.69)/3) |
1.37 ((1.68+1.35+1.08)/3) |
| 1.07 (m, 3H) | chair : 26-28 boat: 23-25 |
1.27 ((1.64+1.20+0.97)/3) |
1.25 ((1.52+0.97)/2) |
| 1.03 (m, 3H) | chair : 23-25 boat: 26-28 |
1.15 ((1.55+0.93+0.97)/3) |
1.23 ((1.48+1.16+1.05)/3) |
By inspection of Table 10, the computed results show a good agreement with the literature[10], since the chemical shifts of the different proton environments appear to be sufficiently close to the literature values. However, a small mismatch in the predicted and computed chemical shifts for some protons environments is observed and also the assignment of protons multiplicity is not always correct. These two factors lead to the observation that the computed simulations are subject to limitations that must be taken into account when trying to apply this method to predict the spectra of unknown compounds.
For example, one main limitation is that the calculations are based on the approximation that the molecule is static and, thus, the spectrum of the time-average geometry of the molecule is predicted. One of the consequence of this approximation is that the protons of the terminal methyl groups appear in slightly different chemical environments, while at room temperature in the real molecule the terminal C-C bonds are free to rotate, thus, the methyl protons are observed as a single peak of multiplicity equal to 3 at the average chemical shift. Therefore, in order to compare with the literature the three singlet signal corresponding to the methyl protons #23-25, #26-28 and #42-44, an average of the chemical shift of the individual protons have been computed. This correction has lead to an estimate of averaged chemical shifts which differ only of about 0.1-0.2 ppm from the literature values, thus, confirming a satisfactory agreement with the literature assignment.
Another interesting observation is that the predicted 𝛿 of the protons in the dithiane ring #45-48 are higher than the literature one. This could probably due to the fact that the simulations takes into account the proximity of these protons to the electronegative sulphur atoms, thus, resulting in a deshielding of the protons' 𝛿, but does not consider the shielding effect arising from possible Van der Waals interactions with other protons of the molecule.
An important point is that the assignment of the most deshielded peak to the olefin proton #37 is in very good agreement with the literature value, which is 5.21 ppm. However, when comparing the olefinic proton 𝛿 of the two conformers, it appears that the boat conformer one differs from the literature value of only 0.07 ppm, while the difference for the chair conformer is of 0.76 ppm. In order to justify this observation, the effect of Van der Waals interactions must be considered.[11] In fact, the presence of Van der Waals interactions with other protons has the effect of shielding the olefinic proton, thus resulting in a lower 𝛿. This explains why the olefinic proton in the boat conformer, which forms four Van der Waals interactions, has a lower 𝛿 than the olefinic proton of the chair conformer, which experiences only of such interactions.
A final remark is that the values computed for the boat conformer seem to better fit the experimental ones than the chair conformer values. This result is in contrast with the expectations, since from the analysis of the most stable configuration carried out above it emerges that the chair is the thermodynamically most stable conformer, thus we would expect this result to be reflected also in the NMR spectra analysis. This observation is an example of the limitations of using a computational method in predicting NMR spectra.
Computed 13C NMR Data and comparison with the literature values
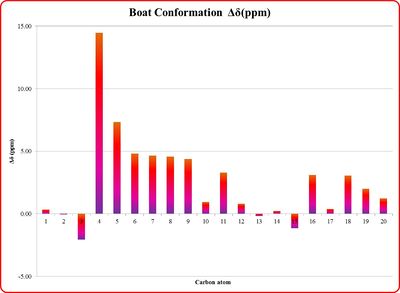
The 13 C NMR data obtained from the computed spectra simulations have been assigned and compared with the literature values[10], as shown in Table 11. By inspection of the results in Table 11 it can be seen that there is a good match between the calculated and the experimental chemical shifts. However, in order to have a more rigorous comparison a statistical analysis of the computed 𝛿 has been performed. This has been done by calculating the deviation, Δ𝛿, of the computed chemical shifts from the literature values, and then plotting the Δ𝛿 values on a histogram. This type of analysis has been carried out for the 13 C NMR data of both the chair and boat conformers of 18, thus, two different histograms have been reported below.
By looking at the histograms, a consistent positive error ≤5 ppm is observed. This could be due to two main sources of errors. The first is that the simulated spectrum has been computed assuming d-chloroform has solvent, while the spectrum experimentally obtained was run in C6D6. Thus, the computed results do not account for the shift of the TMS reference peak due to TMS-d-benzene interactions. If the TMS-d-benzene interactions have the effect of shifting the TMS peak to larger 𝛿, this could explain the consistent positive error when the simulated spectra are compared with the literature ones. The second source of error is due to the fact that the computed simulations have been performed assuming a static state of the molecule (i.e. the spectrum has been simulated at low temperature), while the experimental values have been recorded at room temperature. This means that the 𝛿 of the TMS reference is computed without taking into account intramolecular forces and solvent-TMS interactions, which have the effect of shifting the reference peak when the spectrum is recorded at room temperature.
Another important observation is that the carbon adjacent to the two sulphur atoms, C17, show a positive error of 19 ppm and 14 ppm for the chair and the boat conformations, respectively. This error, that is much larger than the 5 ppm observed for all the other carbon atoms, is a proof of the limitations of applying a computational method to predict the spectra. In fact, this method does not account for the contribution of the spin-orbit coupling to the local magnetic field. This contribution appears to be particularly important for carbons attached to 'heavy' atoms, such as sulphur, which have chemical shifts that require correction for this spin-orbit coupling error.[9]
| Atom # | Chair Conformation | Boat Conformation | Literature[10] |
|---|---|---|---|
| Computed 𝛿 (ppm) | Computed 𝛿 (ppm) | 𝛿 (ppm) | |
| 8 | 212.23 | 211.83 | 211.49 |
| 3 | 148.08 | 148.67 | 148.72 |
| 4 | 120.13 | 118.84 | 120.90 |
| 17 | 94.11 | 89.09 | 74.61 |
| 18 | 60.43 | 67.89 | 60.53 |
| 6 | 54.88 | 56.11 | 51.30 |
| 9 | 54.20 | 55.60 | 50.94 |
| 10 | 49.69 | 50.11 | 45.53 |
| 16 | 49.14 | 48.20 | 43.28 |
| 40 | 46.77 | 44.22 | 40.82 |
| 41 | 41.81 | 42.03 | 38.73 |
| 14 | 41.77 | 37.59 | 36.78 |
| 7 | 38.74 | 35.31 | 35.47 |
| 5 | 34.13 | 31.05 | 30.84 |
| 13 | 33.64 | 28.84 | 30.00 |
| 1 | 28.15 | 28.66 | 25.56 |
| 11 | 26.46 | 25.74 | 25.35 |
| 2 | 24.54 | 25.26 | 22.21 |
| 12 | 22.62 | 23.40 | 21.39 |
| 15 | 21.72 | 21.05 | 19.83 |
Part 2: Analysis of the properties of the synthesised alkene epoxides
In the lab experiment 1S, the Shi and Jacobsen catalysts have been synthesized and used to perform six asymmetric epoxidation reactions (three per catalyst) using three different alkenes, Styrene, trans-β-Methyl styrene and 1,2-Dihydronaphtalene, and obtain six samples of different chiral alkene epoxides of unknown absolute configurations in an enantiomeric excess.
The aim of this section is to apply the modelling experience gained from the Part 1 of this project to investigate some key aspects of the asymmetric epoxidation. The main goal of the analysis is trying to predict the absolute configuration of two of the epoxides synthesised in the lab, trans-β-Methyl styrene and 1,2-Dihydronaphtalene, and to rationalize their formation by studying the crystal structure of the catalysts, by simulating the epoxides NMR spectra and optical rotations, and finally by analyzing the interactions in the active site.
The synthetic mechanism of the Shi catalyst and its activation is shown in Figure 4, as described by Hanks et al[12] following an original procedure by Shi et al[13].
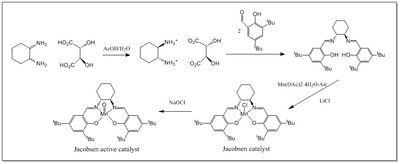
The synthetic mechanism of the Jacobsen catalyst and its activation is shown in Figure 5, as described by Hanson[14] following an original procedure by Jacobsen et al[15],[16].

Crystal Structures of Shi and Jacobsen Catalysts
The crystal structures of the Shi and Jacobsen catalysts have been searched in the Cambridge crystal database (CCDC) by using the Conquest software, then they have been analysed by using the Mercury software.
Shi Catalyst
The search of the crystallographic structure of the Shi catalyst in the CCD has reported the NELQEA unit cell.
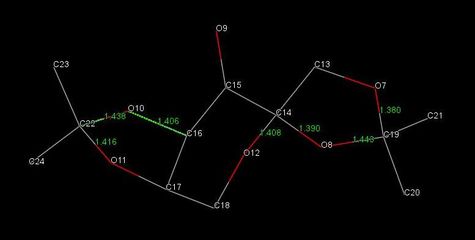
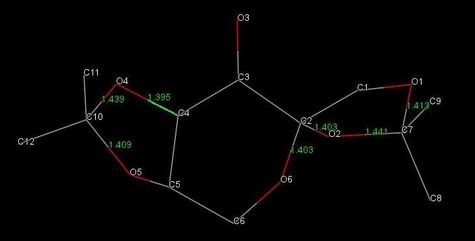
[17] As shown in Figure 6, the NELQEA unit cell is asymmetric and contains two molecules A and B. A detailed study of the unit cell performed by Durik et al.[17] has reported that in both molecules the pyranose ring assumes a 3S0 conformation and the cis-fused 1,3-dioxolane ring assumes a E4 conformation. However, the two molecules differ in the conformation of the second five-membered 1,3-dioxolane ring, which is E2 in molecule A and E4 in molecule B.
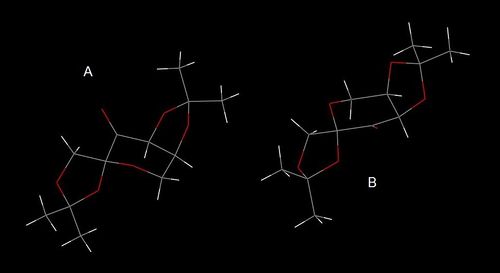
The structure of the Shi catalyst is strongly influenced by the presence of stereoelectronic interactions. In particular, an important role is played by the anomeric interactions, which arise from the electron density donation from the high energy oxygen lone pair, nO, into the low lying σ* antibonding MO on the adjacent C-O bond. These interactions are maximised when the donor orbital nO is aligned antiperiplanar (app) to the acceptor orbital σ*C-O, since this provides them with an optimal overlap. In six-membered ring systems the substituent groups usually prefer to adopt an equatorial position, in order to avoid 1,3-diaxial repulsive interactions. However, when an anomeric centre is present in the ring, the stabilisation arising form anomeric interactions overcomes the destabilisation due to 1,3-diaxial repulsion, thus, favouring the alignment of the acceptor group in an axial position.[1]
The presence of anomeric interactions in the structure of a molecule is determined by looking at the C-O bond length. In fact, the nO →σ*C-O interaction consists in a donation of electron density into the C-O antibonding MO, which results in a weakening (i.e. lengthening) of the C-O acceptor bond. Considering that the typical C-O bond length is 1.43 Å, any deviation from this value would suggest the presencce of an anomeric interaction.
By inspection of molecules A and B and from analysis of the length of the C-O bonds present in the structure, as reported in Table 12, three anomeric centres are present in the Shi catalyst crystal structure, which correspond to C22, C14 and C19 in molecule A, and C10, C2 and C7 in molecule B.
In particular by considering the anomeric interactions for molecule A:
- the C22-O10 bond is 0.022 Å longer than C22-O11, due to the O11 LP donation into the C22-O10 σ* orbital;
- the C14-O12 bond is 0.018 Å longer than C14-O8, due to the O8 LP donation into the C14-O12 σ* orbital;
- the C19-O8 bond is 0.063 Å longer than C19-O7, due to the O7 LP donation into the C19-O8 σ* orbital.
By considering the anomeric interactions for molecule B:
- the C10-O4 bond is 0.030 Å longer than C10-O5, due to the O5 LP donation into the C10-O4 σ* orbital;
- the C2-O6 bond is identical to C2-O2 bond length, due to two anomeric interactions cancelling each other;
- the C7-O2 bond is 0.028 Å longer than C7-O1, due to the O1 LP donation into the C7-O2 σ* orbital.
A final remark concerns the bond length of C16-O10 in molecule A and C4-O4 in molecule B being shorter than typical C-O bond length, despite them not being subject to anomeric interactions. This observation could be explained by considering that the presence of the carbonyl group adjacent to C16 and C4 makes them slightly δ+ and the O10 and O14 slightly δ-. Thus, the partial charges attractive interactions result in stronger (i.e. shorter) C16-O10 and C4-O4 bonds.
Jacobsen Catalyst
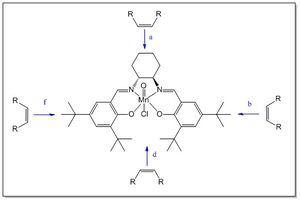
The mechanism at the basis of Jacobsen catalyst high enantioselectivity towards cis-olefins has been object of study for many years. It is believed that the olefin adopts a 'side-on' trajectory towards the active site (4 possibilities as shown in Figure 7), approaching in a plane parallel to the plane of the ligand resulting in favourable π-π orbital interactions.[18]
Jacobsen et al. initially suggested an olefin approach perpendicular to the plane of the ligand, i.e. trajectory a, as preferred over trajectories b and f. The argument in favour of this hypothesis was that the presence of the bulky tert-butyl groups which would sterically hinder the olefin approach from the b and f trajectories.[18]
However, Katsuki, convinced that Jacobsen's argument could not explain the high enantioselectivity of the ligand towards cis-olefins, proposed b and f trajectories as the most likely, due to the favourable π-π interactions between the olefin and the imine group on the ligand.[18]
Fianlly, H. Jacobsen and Cavallo demonstrated another possible trajectory would be d. This statement was made on the basis of results obtained from a computational analysis showing a di-equitorial conformation of the 1,2-diaminocyclohexyl group, which results in the non-planarity of the salen ligand. The fact that the two phenyl rings of the ligand form an angle would allow the olefin to have enough space to travel through the t-Bu groups, following the d trajectory.[18]
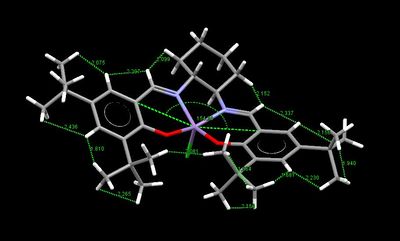
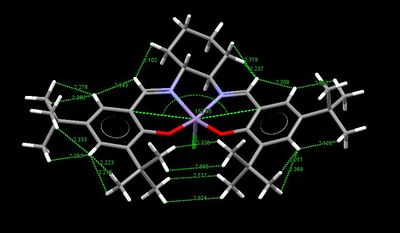
The object of this study is to try to rationalise which one is the most favourable olefin trajectory by considering the non-covalent intramolecular interactions present in the catalyst. In particular, the analysis of Van der Waals interactions between H atoms is fundamental in order to understand the catalyst structure. It's worth notice considering that the H-H distance of 2.40 Å (twice the VdW radii) represents the distance of maximum attraction between two H atoms. Therefore, any H-H interaction at distances shorter than 2.40 Å is repulsive, while any interaction at distances longer than 2.40 Å is attractive. The attractive interactions progressively decreases by increasing the H atoms distance (usually the weakest VdW attractive interactions are considered to be below 3Å). Since repulsive VdW interactions would result in a tendency of the group carrying the H to 'push away' from each other, it is expected that the olefin would be more likely to approach the catalyst from the side where these repulsive interactions are most abundant.
From the crystallographic search of the Jacobsen catalyst obtained on the CCD, two structures were found, TOVNB01[19] and TOVNB02[20]. In Table 13 below the repulsive VdW ineractions (i.e. shorter than 2.40 Å) in both structures have been highlighted in order to predict the best side of approach of the incoming olefin. As shown from the pictures, the two structure differ mainly in the orientation of the methyls on the tert-butyl groups, which are staggered in TOVNB01 and eclipsed in TOVNB02. However, in TOVNB01 the H atoms on the methyls form only one repulsive VdW interaction, while in TOVNB02 they form one repulsive and three attractive interactions. The fact that there are more attractive interactions disfavour this side of approach of the olefins, since the t-Bu tend to 'stick' close to each other and block the d trajectory. Hence, the area where highest number of repulsive H-H VdW interactions is present is on the sides of the imine groups, thus, confirming Katsuki's prediction that the b and f trajectories being the most favourable.
Finally, the VdW interactions also contribute to the salen ligand angle distortion from planarity. In fact, the attractive VdW interactions between the H atoms on the t-Bu groups induce the ligand to fold, hence, reducing the salen ligand-Mn angle even further.
| TOVNIB01 | TOVNIB02 |
|---|---|
 |
 |
Assignment of the Absolute Configuration of two Epoxides
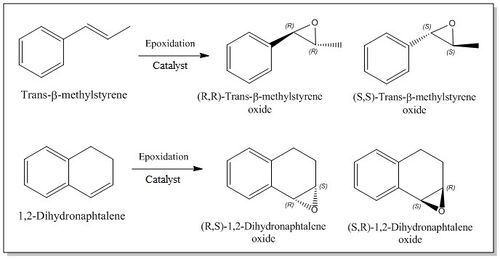
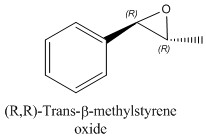
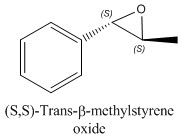
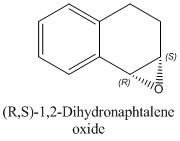
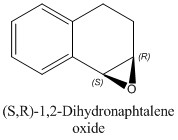
This section is concerned with the study of two of the epoxides synthesized in the lab, Trans-β-methyl styrene and 1,2-Dihydronaphtalene, in order to try to predict their absolute configuration. Figure 8 shows, for both the epoxides, the two enantiomers formed from the epoxidation of the parent alkene.
First, the geometry of the two enantiomers of both epoxides has been optimized by using the Avogadro software, adopting a MMFF94s force field and conjugate gradients as algorithm. The results obtained from the optimization calculations are reported in Tables 14a and 14b.
Secondly, the simulation of the 1 H and 13 C NMR spectra for the most stable enantiomers (which are (S,S)-Trans-β-methylstyrene oxide and (S,R)-1,2-Dihydronaphtalene oxide as it emerges from Tables 14a and 14b) have been performed in order to check the level of agreement between the computed results and the experimental values reported in the literature.
Then, the optical rotation of both enantiomers of each epoxide has been computed and compared with the literature assignment.
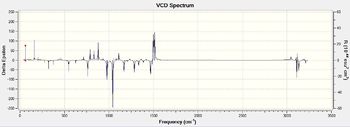
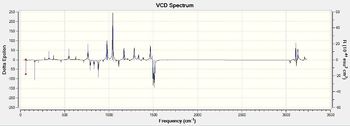
Finally, a Vibrational Circular Dichroism (VCD) analysis has been carried out, in order to further confirm the absolute configuration assignment.
It's worth notice mentioning that an Electronic Circular Dichroism (ECD) analysis could have also been used as method to determine the epoxides absolute configuration. However, this method was dismissed since for the epoxides under investigation no compatible chromophore exists.
| (R,R)-Trans-β-methylstyrene oxide | (S,S)-Trans-β-methylstyrene oxide | |||||||
|---|---|---|---|---|---|---|---|---|
| Structure |
|
| ||||||
| Total Energy (kcal/mol) | 26.88515 | 23.12038 | ||||||
| Bond Stretching (kcal/mol) | 1.86300 | 1.88677 | ||||||
| Angle Bending (kcal/mol) | 2.93732 | 1.73722 | ||||||
| Stretch Bending (kcal/mol) | -0.43488 | -0.76446 | ||||||
| Torsional (kcal/mol) | 2.88032 | 2.89531 | ||||||
| Out-of-plane Bending (kcal/mol) | 0.00280 | 0.00159 | ||||||
| Van der Waals (kcal/mol) | 16.64223 | 14.32823 | ||||||
| Electrostatic (kcal/mol) | 2.99436 | 3.03573 |
| (S,R)-1,2-Dihydronaphtalene oxide | (R,S)-1,2-Dihydronaphtalene oxide | |||||||
|---|---|---|---|---|---|---|---|---|
| Structure |
|
| ||||||
| Total Energy (kcal/mol) | 30.68406 | 32.56311 | ||||||
| Bond Stretching (kcal/mol) | 2.77522 | 3.11774 | ||||||
| Angle Bending (kcal/mol) | 2.63893 | 3.36027 | ||||||
| Stretch Bending (kcal/mol) | -0.79961 | -0.46651 | ||||||
| Torsional (kcal/mol) | 1.02325 | 1.92875 | ||||||
| Out-of-plane Bending (kcal/mol) | 0.03150 | 0.01248 | ||||||
| Van der Waals (kcal/mol) | 19.93644 | 19.35379 | ||||||
| Electrostatic (kcal/mol) | 5.07833 | 5.25659 |
1 H and 13 C NMR Analysis
The NMR simulations have been carried out in GaussView using a DFT method, B3LYP theroy, 6-31G(d,p) basis set, GD3 empirical dispersion model and d-chloroform as solvent. The computation results, the corresponding literature values and the histogram showing the Δδ (ppm) deviations for (S,S)-Trans-β-methylstyrene Oxide and (S,R)-1,2-Dihydronaphthalene Oxide are collected in Tables 15a, 15b, 16a, 16b.
(S,S)-Trans-β-methylstyrene Oxide
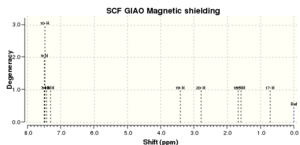
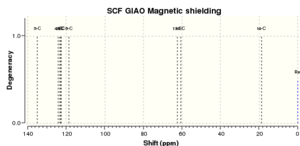
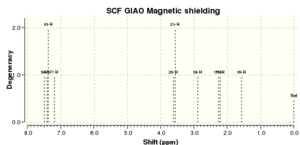
By inspection of the statistical analysis results plotted on the histograms in Tables 15a and 15b it can be seen that the computed NMR values show a good agreement with the literature assignments. This observation is made by considering that the average the deviation Δδ from the literature is smaller than ±0.20 ppm for the 1H NMR, and ±3.3 ppm 13C NMR, confirming a satisfactory good match of the data.
The greater Δδ observed on the histogram refer to the methyl protons, since their δ has been computed individually in the simulation (assuming a static geometry of the molecule), while the real NMR spectrum recorded at room temperature shows a single peak of intensity 3 as the average result of the signals of the three protons, which rotate faster than the spectrometer time-scale.
 |
Computed δ(ppm) DOI:10042/27443 |
Literature[21] δ(ppm) |
 |
|---|---|---|---|
| 7.50 (2H) | 7.32-7.22 (5H) | ||
| 7.48 (1H) | |||
| 7.42 (1H) | |||
| 7.31 (1H) | |||
| 3.41 (1H) | 3.55 (1H) | ||
| 2.79 (1H) | 3.10 (1H) | ||
| 1.68 (1H) | 1.42 (3H) | ||
| 1.59 (1H) | |||
| 0.72 (1H) |
 |
Computed δ(ppm) DOI:10042/27443 |
Literature[21] δ(ppm) |
 |
|---|---|---|---|
| 134.98 | 137.9 | ||
| 124.07 | 128.4 | ||
| 123.33 | 128.4 | ||
| 122.80 | 128 | ||
| 122.73 | 125.5 | ||
| 118.49 | 125.5 | ||
| 62.32 | 59.5 | ||
| 60.58 | 59.0 | ||
| 18.84 | 18.0 |
(S,R)-1,2-Dihydronaphtalene Oxide
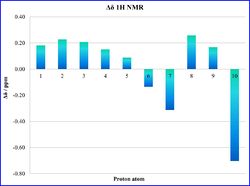
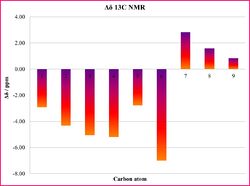
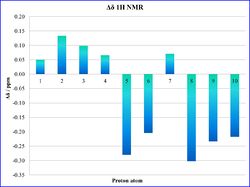
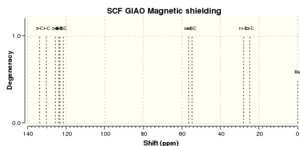
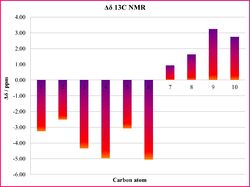
The statistical analysis of the NMR data shows a good match between the computed data and the literature values, as illustrated from the histograms in Tables 16a and 16b. This can be confirmed by the low values of average deviation Δδ, which for the proton NMR is ±0.16 ppm, and ±3.1 ppm for 13C NMR.
 |
Computed δ(ppm) DOI:10042/27453 |
Literature[22] δ(ppm) |
 |
|---|---|---|---|
| 7.49 (1H) | 7.44 (1H) | ||
| 7.40 (1H) | 7.33-7.21 (2H, m) | ||
| 7.37 (1H) | |||
| 7.20 (1H) | 7.13 (1H, d) | ||
| 3.61 (1H) | 3.89 (1H, d) | ||
| 3.57 (1H) | 3.77 (1H,t) | ||
| 2.88 (1H) | 2.83-2.79 (1H, m) | ||
| 2.27 (1H) | 2.59-2.55 (1H, m) | ||
| 2.22 (1H) | 2.49-2.41 (1H, m) | ||
| 1.56 (1H) | 1.80-1.76 (1H, m) |
 |
Computed δ(ppm) DOI:10042/27453 |
Literature[22] δ(ppm) |
 |
|---|---|---|---|
| 133.84 | 137.1 | ||
| 130.38 | 132.9 | ||
| 125.55 | 129.9 | ||
| 123.84 | 128.8 | ||
| 123.43 | 126.5 | ||
| 121.44 | 126.5 | ||
| 56.44 | 55.5 | ||
| 54.83 | 53.2 | ||
| 28.04 | 24.8 | ||
| 24.95 | 22.2 |
Optical Rotation Computations
The chiro-optical properties of the epoxides have been computed on GaussView using a Cambridge variation on the B3LYP density functional method, 6-311++g(2df,p) basis set, wavelength of the incident light at 589 nm and 365 nm and d-chloroform as solvent. The full code used is as follows:
# CAM-B3LYP/6-311++g(2df,p) polar(optrot) scrf(cpcm,solvent=chloroform) CPHF=RdFreq
This is a blank line; put no text in it
Title line, ie Optical rotation for literature compound
This is a blank line; put no text in it
0 1
firstatom-symbol 0 x-cooordinate of atom1 2-cooordinate of atom1 -cooordinate of atom1
...
lastatom-symbol 0 x-cooordinate of lastatom 2-cooordinate of lastatom -cooordinate of lastatom
This is a blank line; put no text in it
589nm 365nm
This is a blank line; put no text in it
The [α]D optical rotation components of the asymmetric epoxides at the two selected wavelength have been reported in Tables 17a and 17b. Only the values in Tables 17a,recorded at 589 nm, have been compared with the literature, since no literature value was provided at 365 nm.
| Epoxide | Optical rotation (o) | |
|---|---|---|
| Computed Value | Literature Value | |
| (R,R)-Trans-β-methyl styrene oxide | DOI:10042/27450 |
|
| (S,S)-Trans-β-methyl styrene oxide | DOI:10042/27458 |
-47.2[23] |
| (R,S)-1,2-dihydronaphthalene oxide | DOI:10042/27451 |
+129[24] |
| (S,R)-1,2-dihydronaphthalene oxide | DOI:10042/27462 |
-39[25] |
| Epoxide | Computed Value (o) |
|---|---|
| (R,R)-Trans-β-methyl styrene oxide | DOI:10042/27450 |
| (S,S)-Trans-β-methyl styrene oxide | DOI:10042/27458 |
| (R,S)-1,2-dihydronaphthalene oxide | DOI:10042/27451 |
| (S,R)-1,2-dihydronaphthalene oxide | DOI:10042/27462 |
The results at 589 nm show that, for each epoxide, the two enantiomers show values of optical rotation (OR) of opposite sign and very close in modulus. This is consistent with the expectation, since each enantiomer is expected to reflect the same amount of polarized light (this is the meaning of the modulus) in the opposite direction with respect to the other enantiomer (this is the meaning of the sign).
<>br
In particular, for (R,R)-Trans-β-methyl styrene oxide and (S,S)-Trans-β-methyl styrene oxide the values of [α]D OR are almost identical, showing a difference of only 0.02°. Similarly, the modulus of the OR values of (R,S)-1,2-dihydronaphthalene oxide and (S,R)-1,2-dihydronaphthalene oxide differ of 16.85°. This greater difference is explained considering that the OR is extremely sensitive to the molecule's conformation. Hence, if, for example, in one enantiomer one group is slightly rotated compared to the other enantiomer, the values of OR will be different.
When comparing the computed OR with the literature ones, a surprisingly good agreement is observed for the Trans-β-methyl styrene enantiomers is observed. However, the literature are not always reliable, since the OR experimental measurements depends on many factors, including solvent, temperature, concentration and purity of the sample. This is actually confirmed by the comparison of the computed and the experimental OR for the 1,2-Dihydronaphtalene enantiomers. In fact, not only the values are very different in modulus, but they are also opposite in sign with respect to the literature ones. This example underlines the unreliability of experimental OR measurements and show how, actually, computational calculation could give more reliable OR values.
Vibration Circular Dichroism (VCD) Computations
VCD is an excellent technique for the assignment of the absolute configuration of epoxides. The technique consists in irradiating the sample with circularly polarized infrared light and measuring the differences in attenuation of left and right light passin through the sample. The VCD spectra of two enantiomers are expected to be mirror images of each other, since the chiral centres of the two enantiomers should absorb the same amount of light but in opposite direction with respect to the circularly polarized light's center.[26]
The VCD spectra have been simulated on GaussView using a B3LYP method, 6-31G(d,p) basis set, GD3 empirical dispersion model and d-chloroform as solvent. The full code used is as follows:
# B3LYP/6-31G(d,p) opt freq(vcd) scrf(cpcm,solvent=chloroform) EmpiricalDispersion=GD3 integral=grid=ultrafine

Electronic Circular dichroism calculation

 0 1
atom1-symbol 0 x-cooordinate of atom1 2-cooordinate of atom2 -cooordinate of atom3
atom2-symbol 0 x-cooordinate of atom1 2-cooordinate of atom2 -cooordinate of atom3
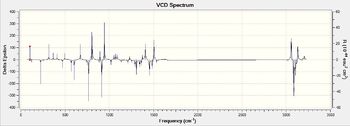
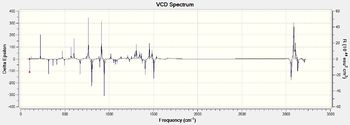
As expected, the computed VCD spectra of both enantiomers of each epoxide, which are reported in Tables 18a and 18b, are mirror images of each other. This confirm the assignment of the absoolute configuration of the two epoxides as predicted by the optical rotation calculations.
| Epoxide | VCD Spectrum | Epoxide | VCD Spectrum |
|---|---|---|---|
 |
 |
 |
 |
| Epoxide | VCD Spectrum | Epoxide | VCD Spectrum |
|---|---|---|---|
 |
 |
 |
 |
Using Transition States properties for calculating ee values
In order to calculate the enatiomeric eccess of Trans-β-methyl styrene and 1,2-Dihydronaphtalene epoxides the interactions between the catalyst and the parent alkene in the transition state (TS) have been investigated.
By recalling that the Shi catalyst has been found to be enantioselective towards trans- and trisubstituted alkenes[27], while Jacobsen catalyst has been shown to have enantioselectivity towards cis-olefins[18], an analysis of the TS of the epoxidation of Trans-β-methyl styrene with the Shi catalyst and of 1,2-Dihydronaphtalene with the Jacobsen catalyst has been carried out, in order to predict the expected highest values of enantiomeric excess of both the epoxides and compare them with the literature values.
Thus, the total energy for the TS of each enantiomer has been computed, taking into account a correction term for entropy and zero-point thermal energies, and a solvation correction term for water as solvent. The sum of thermal and electronic free energies of the Shi TS with Trans-β-methyl styrene have been reported in Table 19a, while those of Jacobsen TS with 1,2-Dihydronaphtalene are collected in Table 19b.
The computed relative free energy of the TS have been used to compute the enantiomeric excess (ee) of the epoxide, thus checking the absolute configuration assignment obtained from the optical rotation analysis above. Hence, the ee, which is a measure of the level of enantioselectivity of a reaction, has been calculated by converting the free energies of the TSs into equilibrium constants, according to the following calculations:
for Trans-β-methyl styrene oxide
for 1,2-Dihydronaphtalene oxide
which are rearranged as:
The ee is then defined as:
The results of the above calculations have been reported in Tables 19a and 19b. It's worth noting that the most accurate ee value for each epoxide is the one derived from the lowest energy transition states for formation of the two enantiomers, i.e. TS number 4 for Trans-β-methyl styrene and TS number 1 for 1,2-Dihydronaphtalene.
| G (Hartrees) | ΔG (Hartrees) | ΔG (kJmol-1) | K | ee (%) | Literature ee (%)[27] | ||
|---|---|---|---|---|---|---|---|
| Transition State # | (R,R)-Trans-β-methyl styrene | (S,S)-Trans-β-methyl styrene | |||||
| 1 | -1343.022970 | -1343.017942 | -0.00503 | -13.201014 | 205.516304 | 99.03155346 | 96 [CH3CN/DMM] |
| 2 | -1343.019233 | -1343.015603 | -0.00363 | -9.530565 | 46.7493585 | 95.81146206 | |
| 3 | -1343.029272 | -1343.023766 | -0.00551 | -14.456003 | 340.975422 | 99.41516265 | |
| 4 | -1343.032443 | -1343.024742 | -0.0077 | -20.2189755 | 3486.65001 | 99.9426548 | |
The results of the Shi TS with Trans-β-methyl styrene show that the ee of the (R,R) enantiomer is 99.94%, which is in good agreement with the literature[27] value of 96%. It is worth noting that the value of ee depends on reaction conditions, such as temperature and solvent. Thus, the small difference between the computed value and the experimental one can be explained by considering that the calculations have been run using water as a solvent, while the literature reports CH3CN/DMM as solvent.
The high value of ee obtained from the TS of the Shi catalyst - Trans-β-methyl styrene confirms the statement made by Shi that the Shi catalyst is highly enantioselective towards trans- and trisubstituted alkenes.[27]
| G (Hartrees) | ΔG (Hartrees) | ΔG (kJmol-1) | K | ee (%) | Literature ee (%)[28] | ||
|---|---|---|---|---|---|---|---|
| Transition State # | (S,R)-1,2-Dihydronaphtalene | (R,S)-1,2-Dihydronaphtalene | |||||
| 1 | -3421.369033 | -3421.359354 | -0.00968 | -25.4122 | 28331.86 | 99.99294 | 91 |
| 2 | -3421.36158 | -3421.359499 | -0.00208 | -5.46367 | 9.062459 | 80.12414 | |
The results of the Jacobsen TS with 1,2-Dihydronaphtalene show that the ee of the (S,R) enantiomer is 99%, value which is 8% higher than the experimental one[28]. The small difference between the two values is partly due to the different solvent systems used (same argument hold for the Shi TS above), and partly to the fact that the TSs computed for the Jacobsen catalyst involve one derivative of the Jacobsen catalyst, which differ from Jacobsen catalyst due to the absence of one t-Bu group in both phenyl rings. In fact, the less steric hindrance of the active site seems to farther favour the formation of the TS with the (S,R)- enantiomer rather than with the (R,S)- one.
Fianlly, the high value of ee of the TS of Jacobsen catalysed epoxidation of 1,2-Dihydronaphtalene fulfills the expectations of the catalyst being enantioselective towards cis-olefins.
A better insight of the Transition States
Shi Transition State
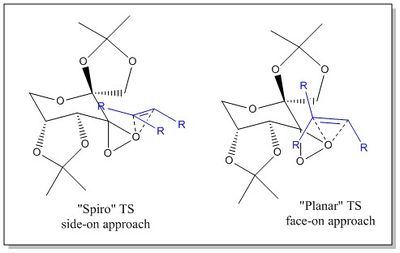
For epoxidations performed with the Shi catalyst there are 8 possible transition states associated with the following parameters[27]:
- weather the (R,R)- or the (S,S)- epoxide is formed;
- which of the two dioxirane oxygens is transferred to the alkene;
- which trajectory the olefin adopts in approaching the active site ((spiro or planar transition state).
Shi[27] has determined that only 2 of the 8 possible TSs are viable, since the other 6 are disfavoured due to steric interactions. The first, is a 'spiro TS', which involves the alkene's 'side-on' approach to the least hindered dioxirane oxygen. The second, is a 'planar TS' which involves the alkene's 'face-on' approach to the least hindered dioxirane oxygen. The two TS states, depicted in Figure 9, result in the formation of the two different epoxide's enantiomers. Therefore, by tuning the reaction conditions towards the one or the other TS, an enantioselectivity control could potentially be achieved.[27]
However, it's worth noting that the 'spiro' is believed to be preferred TS due to favourable stereoelectronic interactions between the oxygen LP and the alkene π* orbital, not possible in the 'planar' TS.[27]
Thus in order to better understand the origin of the interactions favouring the 'spiro' TS, an analysis of all the non-covalent interactions (NCI) in the active-site as well as the electronic covalent interactions (QTAIM) of the TS has been performed.
NCI and QTAIM analysis in the active-site of the TS
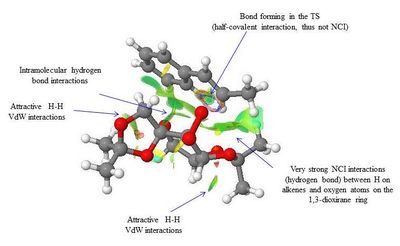
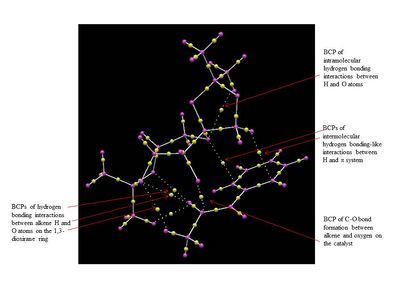
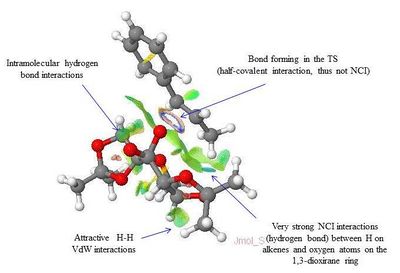
The NCI and QTAIM analysis of the TS of both enantiomers of Trans-β-methyl styrene have been performed in order to investigate the origin of the enantioselectivity of the Shi catalyst depending on the type of TS. It is worth noting that in the NCI 3D model the colours indicate whether the interaction is attractive (blue = very attractive, green = mildly attractive) or repulsive (yellow = mildly repulsive, red = strongly repulsive). In the the diagram showing the results of the QTAIM analysis, the purple sphere represents the atoms of the molecules while the yellow spheres represent the Bond Critical Point (BCP), i.e. regions where there is a covalent bond (solid line connecting the purple and yellow spheres) or a weak covalent interaction (dotted line).
| 3D Model showing NCI | Annotated NCI | QTAIM | |||
|---|---|---|---|---|---|
|
 |
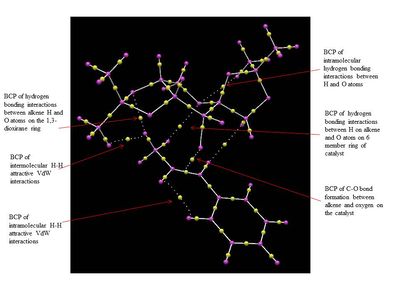 |
By lookin at the annotated diagrams of the NCI and QTAIM in both the TS it is possible to observe that the key interactions between the catalyst and the approachiung alkene are represented by the hydrogen bonding interactions between the alkene H atoms and the oxygen atoms on the 1,3-dioxirane ring of the catalyst. These in fact, are the interactions which contribute the most to the way the olefin approaches the catalyst. For the (R,R)- enantiomer it is possible to see that these interactions are very strong (greater colour intensity of the surface representing the attractive interaction), while they are slightly weaker in the case of the (S,S)- TS (less intense colour). As one can see from the 3D model in the (R,R)- TS the alkene approach in a 'side-on' manner ('spiro' TS), while in the (S,S)- TS the approach is 'face-on' ('planar' TS), as predicted from Shi studies.[27] Thus, combining the last two observations, one could attempt a qualitative explanation of the higher enantioselectivity of the catalyst towards the (R,R)- enantiomer, since the greater degree of attractive NCI would stabilize more the 'spiro' TS.
Jacobsen Transition State
The analysis of the possible trajectories the alkene can approach the active site of the Jacobsen catalyst has already been discussed above. It has been concluded, according to Katsuki's prediction, that the alkene most likely approaches the active site from the side of the catalyst where either imine groups lye, i.e. following either b or f trajectories.[18]
In order to check Katsuki's prediction, an analysis of the NCI in the active-site of the TS has been carried out. The NCI analysis has also been used to explain the higher enantioselectivity of the Jacobsen catalyst towards the (S,R)-1,2-Dihydronaphtalene.
NCI and QTAIM analysis in the active-site of the TS
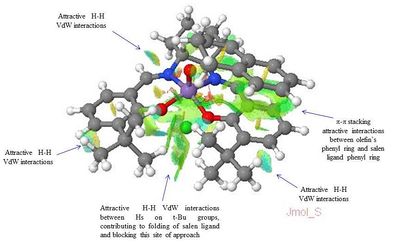
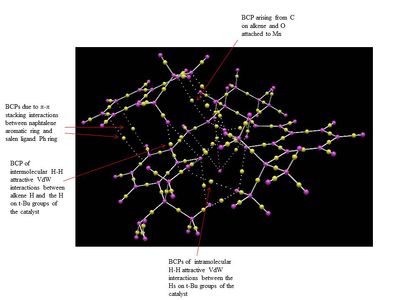
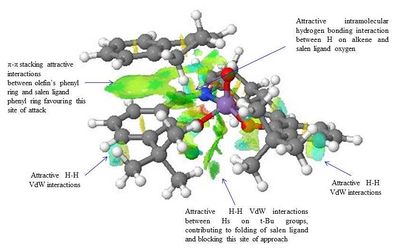
The NCI and the QTAIM analysis of the TS of both enantiomers of 1,2-Dihydronaphtalene has been carried in order to investigate the origin of the enantioselectivity of the Jacobsen catalyst depending on the type of TS. The meaning of the colours in the NCI 3D model and of the different type of spheres and line in the QTAIM annotated diagram are the same as defined above for the analysis of the Shi catalyst TS.
| 3D Model showing NCI | Annotated NCI | QTAIM | |||
|---|---|---|---|---|---|
|
 |
 |
| 3D Model showing NCI | Annotated NCI | QTAIM | |||
|---|---|---|---|---|---|
|
 |
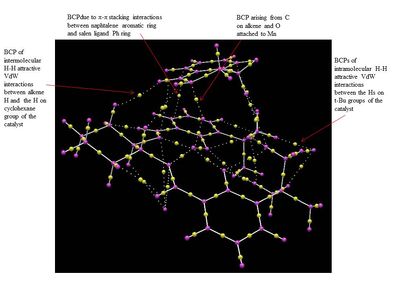 |
The analysis of the NCI and of the QTAIM in the TS of both enantiomers reported on the annotated diagrams show that the main stabilising interaction between the alkene and the catalyst is represented by the π-π overlap between the aromatic ring of the naphtalene ring and one of the the phenyl ring of the salen ligand. This strong attractive interaction justify Katsuki's assignment of the most favourable trajectories being b or f. This is further confirmed by the observation of great H-H VdW attractive interactions between the Hs on the t-Bu groups which prevents the alkene approach from the d trajectory.
Moreover, by comparing the NCI in the (S,R)- and the (R,S)- TS a main difference can be observed: the presence of a strong intermolecular hydrogen bonding interaction between one of the H of the alkene and the oxygen salen ligand, which is only present in the (S,R)- TS. This could be one of the reason for the enantioselectivity of the Jacobsen catalyst towards the (S,R)- epoxide, since this strong H-bond interaction has the effect of giving greater stability to the (S,R)-TS.
Suggesting new candidates for investigations

In this section a new candidate for the the investigation of the epoxidation reaction using the Shi and the Jacobsen catalysts has been suggested. After having searched on Reaxys for an epoxide with optical rotation value greater than 300° and molecular weight smaller than 200 g mol-1, the Pulegone epoxide has been found. The literature reports that this epoxide exists in two enantiomeric forms, the (R,R)-Pulgeone with an OR value of [α]324= + 853.9° and the (R,S)-Pulgeone with an OR value of[α]324= -1177.9°.[29]Figure 10 shows the two enantiomeric forms of the Pulgeone epoxide.
The advantage of using this epoxide is the commercial availability of its parent alkene, (R)-Pulgeone, which would allow a comparison between the computational investigation of such epoxidation reaction with the actual reaction carried out in the lab.
The synthesis of (R,R)-Pulgeone epoxide has been achieved in ee of 64.2%, as reported in the literature.[30] The synthetic procedure reported in the literature involves the use of 30% hydrogen peroxide in a 30% sodium hydroxide solution. Thus, it would be interesting to investigate how the performance of the epoxidation reaction with both the Jacobsen and Shi catalysts would influence the ee value.
References
- ↑ 1.0 1.1 J. Clayden, N. Greeves, S. Warren and P. Wothers, Organic Chemistry, Oxford University Press, Oxford, 8th edn., 2009
- ↑ M. Fox, R. Cardona, N. Kiwiet, J. Org. Chem., 1987, 52 1469–1474. DOI:10.1021/jo00384a016
- ↑ 3.0 3.1 D. Skála, Petroleum and Coal, 2003, 45, 105-108.
- ↑ 4.0 4.1 4.2 4.3 L. Paquette, S. Elmore, Tetrahedron Letters, 1991, 32, 319-322. DOI:10.1016/S0040-4039(00)92617-0
- ↑ Lloyd-Williams, P.; Giralt, E. Chem. Soc. Rev., 2001, 30, 145
- ↑ Patricia M. Lesko, Richard B. Turner J. Am. Chem. Soc., 1968, 90, 6888. DOI:10.1021/ja01026a084
- ↑ David J. Martella, Maitland Jones Jr., Paul v. R. Schleyer, Wilhelm F. MaierJ. Am. Chem. Soc., 1979, 101, 7634. DOI:10.1021/ja00519a038
- ↑ W. F. Maier, P. Von Rague Schleyer, J. Am. Chem. Soc., 1981, 103, 1891. DOI:10.1021/ja00398a003
- ↑ 9.0 9.1 H. Rzepa, 'Structure Modelling, NMR simulation and Chiroptical properties', 3rd Year Synthesis Lab, Imperial College, 2013
- ↑ 10.0 10.1 10.2 10.3 10.4 L. A. Paquette , N. A. Pegg , D. Toops, G. D. Maynard and R. D. Rogers, J. Am. Chem. Soc., 1990, 112, 277–283DOI:10.1021/ja00157a043
- ↑ R. Abraham, M. Canton, L. Griffiths, Magn. Reson. Chem., 2001, 39, 421-431. {{DOI|10.1002/mrc.862}
- ↑ A. Burke , P. Dillon , Kyle Martin and T. W. Hanks,"Catalytic Asymmetric Epoxidation Using a Fructose-Derived Catalyst", J. Chem. Educ., 2000, 77, 271; DOI:10.1021/ed077p271
- ↑ O. A. Wong , B. Wang , M-X Zhao and Y. Shi J. Org. Chem., 2009, 74, 335–6338; DOI:10.1021/jo900739q
- ↑ J. Hanson,J. Chem. Educ., 2001, 78, 1266; DOI:10.1021/ed078p1266
- ↑ E. N. Jacobsen , W. Zhang , A. R. Muci ,J. R. Ecker , L. Deng J. Am. Chem. Soc., 1991, 113, 7063–7064; DOI:10.1021/ja00018a068
- ↑ M. Palucki , N. S. Finney , P. J. Pospisil , M. L. Güler , T. Ishida , and E. N. Jacobsen, J. Am. Chem. Soc., 1998, 120, 948–954; DOI:10.1021/ja973468j
- ↑ 17.0 17.1 M.Durik, V.Langer, D.Gyepesova, J.Micova, B.Steiner, M.Koos, Acta Crystallogr., 2001, 57, o672. DOI:10.1107/S160053680101073X
- ↑ 18.0 18.1 18.2 18.3 18.4 18.5 E. McGarrigle, D. Gilheany, Chem. Rev., 2005, 105, 1563-1602. DOI:10.1021/cr0306945
- ↑ 19.0 19.1 J. Yoon, T. Soon, S. Lee, W. Shin, Acta Cryst., 1999, 55, 1766. DOI:10.1107/S0108270199009397
- ↑ 20.0 20.1 F. Fronczek, X. Bu, Private Communication, 2002.
- ↑ 21.0 21.1 Li Ji a , Ya-Na Wang a , Chao Qian a & Xin-Zhi Chen, Synthetic Communications, 2013, 43 2256–2264. DOI:10.1080/00397911.2012.699578
- ↑ 22.0 22.1 M. Robinson, A. Davies, R. Buckle, I. Mabbett, S. Taylor and A. Graham,Org. Biomole. Chem., 2007, 7, 2559-2564. DOI:10.1039/B900719A
- ↑ 23.0 23.1 Witkop, B., Folt, C. M., J. Am. Chem. Soc., 1957, 79(1), 197-201. DOI:10.1021/ja01558a052
- ↑ S. Pedragosa-Moreau, A. Archelas, R. Furstoss,Tetrahedron, 1996, 52, 4593-4606. DOI:10.1016/0040-4020(96)00135-4
- ↑ H. Lin, J Qiao, Y Liu, Z. Wu, J. Mol. Cat. B., 2010, 67, 236-241. DOI:10.1016/j.molcatb.2010.08.012
- ↑ M. J. Fuchter, Ya-Pei Lo and H. S. Rzepa, J. Org. Chem., 2013, DOI:10.1021/jo401316a
- ↑ 27.0 27.1 27.2 27.3 27.4 27.5 27.6 27.7 27.8 O. A. Wong and Y. Shi, Chem. Rev., 2008, 108, 3958-3987
- ↑ 28.0 28.1 Sasaki1 H., Irie R., Hamada T., Suzukia K., Katsuki T., Tetrahedron, 1994, 50, 11827–11838
- ↑ US Department of Health and Human Services, 'Toxicology and Carcinogenesis Studies of Pulegone',NTP Technical Report, 2011, 1-202
- ↑ J. Katsuhara,J. Org. Chem., 11967, 32, 797–799DOI:10.1021/jo01278a062 10.1021/jo01278a062


