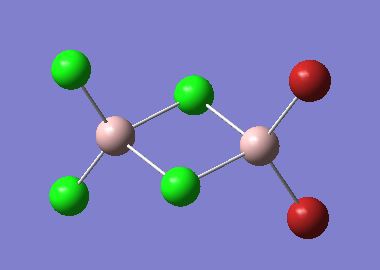
Rep:Mod:Carolyn2MP
Mini Project: The Schlenk Equilibrium
The Schlenk Equilibrium [1] is a chemical equilibrium named after William Sclenk and refers to the equilibrium taking place in solutions of grignards. The simplified equilibrium is shown below. This describes the equilibrium between two equivalents of an alkyl/aryl magnesium halide compound (on the left) with one equivalent of a dialkyl/diaryl magnesium and a magnesium halide salt (on the right).
 |
It has been reported that when a grignard reagent is solvated by ether based solvents the result is four coordinate magnesium centres. Additionally, when the grignard reagent is more heavily solvated, oligomers (mainly dimers) featuring these four coordinate magnesium atoms along with halide bridging is seen. This situation of a grignard reagent in solution is described in detail by the Sclenk Equilibrium which is shown below. The position of the equilibrium is influenced by a number of factors including solvent, temperature and the nature of the various substituents. For this project the position of the Schlenk will be predicted (or attempted to be) using computational analysis of the energies of the different components within the full equilibrium. This can be done for both the simplified and the full Schlenk Equilibrium. The halide atom X will be Cl for the purpose of this investigation, this is a common choice for most empirical investigations also and another common choice would be Br. The ligand, L, is the solvent in which the grignard has been solvated. This is usually either THF or Et2O however for simplicity (i.e. with the assumption that smaller molecules optimise more quickly and easily and are less costly in computational terms) the solvent ligand L will be represented by Me2O. The R group is predominantly an alkyl or an aryl group and so for this investigation, using the reasoning stated above, the R group is represented by a Me group.

Prediction of the Position of the Equilibrium for the Simplified Schlenk Equilibrium
The structures of the grignard reagent; MgMeCl, the dialkyl magnesium compound; MgMe2 and of the magnesium halide salt; MgCl2 were modelled in gausview and then their structures were optimised using DFT/3BLYP method and a basis set of 6-31G(d,p). The code for the optimisation of MgMeCl is:
# opt b3lyp/6-31g(d,p) geom=connectivity
Grignard
D-Space reference:DOI:10042/to-3928
The code for the optimisation of MgCl2 is:
# opt b3lyp/6-31g(d,p) geom=connectivity
MGCl2 Optimistaion
D-Space reference:DOI:10042/to-3927
The code for the optimisation of MgR2 is:
# opt b3lyp/6-31g(d,p) geom=connectivity
MgR2
D-Space reference:DOI:10042/to-3926
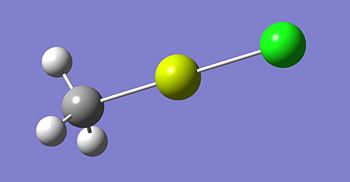
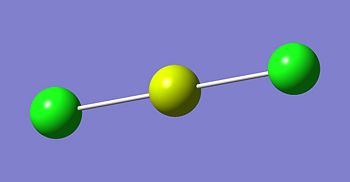
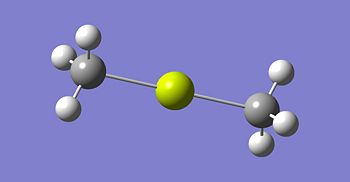
The optimised structures for molecules 1,2 and 3 are shown below. The optimised bond length of the three molecules are shown in the table. Note that the C-Mg and Cl-Mg bond lengths for the grignard reagent are shorter than those computed for the MgMe2 and MgCl2 molecules.
| Bond | Grignard | Dialkyl Magnesium | Magnesium Dichloride |
|---|---|---|---|
| C-Mg | 2.08 | 2.13 | - |
| Mg-Cl | 2.22 | - | 2.35 |
 |
 |
 |
Frequency Analysis of Molecules 1,2 and 3
In order to confirm the minimal energy has been obtained for the 3 molecules it is necessary to carry out a frequency analysis. If the resulting vibrations are all positive in value it can be concluded that the structures have indeed been optimised and further analysis can be carried out. The calculation was a DFT/B3LYp (additional keywords: pop=(full,nbo), the codes for the frequeny analysis are given below;
The code for the frequency calculation of Mol 1 is;
# freq b3lyp/6-31g(d,p) geom=connectivity pop=(full,nbo)
Grignard_Freq
D-Space reference: DOI:10042/to-3929
The code for the frequency calculation of Mol 2 is;
# freq b3lyp/6-31g(d,p) geom=connectivity pop=(full,nbo)
FREQ_MGCl2
D-Space reference: DOI:10042/to-3930
The code for the frequency calculation of Mol 3 is;
# freq b3lyp/6-31g(d,p) geom=connectivity pop=(full,nbo)
MgR2_FREQ
D-Space reference: DOI:10042/to-3931
As all the frequency calculations did indeed yield positive frequency values for the vibrations of molecules 1-3 it can therefore be concluded that the optimised structures have been found. Therefore further analysis of the simplified Sclenk Equilibrium can be made.
Predicting the Position of the Simplified Schlenk Equilibrium
In order to predict the position of the simplified Schlenk Equilibrium the total energy of the components on the left hand side were compared with the total energy of the components on the right hand side. This is summarised in the tables below;
|
|
As can be seen from the tables above, the sum of the dialkyl magnesium compound and magnesium dichloride is lower in energy that the total energy of the two equivalents of grignard reagent. Therefore, as the right hand side of the equilibrium equation is the more stable by 36 kJ/mol it can be concluded that the position of the equilibrium lies over to the right. It should be noted however, that this is only a prediction and needs to be supported by empirical evidence. In a real life/synthetic situation the equilibrium reactions happen in the solvent phase. Solvents can, and more often than not do, have dramatic stabilising/destabilising effects on the reactants present in solution. Therefore, it is difficult to assume the validity of these computational predictions.

In the literature it stated that; 'there is established eveidence that this reaction is not necessarily a facile equilibrium, that is to say, it is not necessarily reversible and may require a catalyst,'[2]. This statement supports the results of the computational analysis. Therefore, it can be concluded that the position of the simplified shclenk equilibrium can in fact be predicted using computational methods.
Analysis of the Full Schlenk Equilibrium

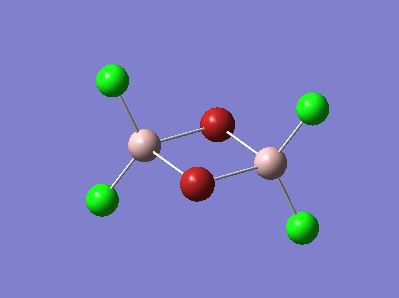
Molecules 1-3 have already been optimised and their structures have been confirmed to be the minimal energy structures by undertaking a frequency analysis (see above). The structure of Molecule 4 was modelled using Gausview and on first attempt to run the optimisation calculation using a the high basis set of 6-31G(d,p), the calculation was unsuccessful. Therefore, the molecule was once again drawn in Gausview, but this time the structure was manually altered so the Mg-Cl bond lengths were similar to those successfully computed for the grignard reagent (calculated above), approx 2.19 Angstroms. Additionally, OMe2 groups were angled away from each other in order to decrease the steric interactions between them. The idea of manually altering the starting structure of more complicated molecules will (hopefully) give the calculation a better starting point and so it is much more likely to successfully calculate the minimal energy structure of the molecule. A better starting point means a structure that 'chemical intuition' tells you will be lower in energy or closer to the minimal energy structure. Following this, the optimisation calculation was run, but this time using a low basis set; b3LYP/3-21G and 'opt=loose' was written in the "additional keywords" section. This lower basis set does not have very high accuracy but the calculations should be quick and (for the same reasons stated above) the resulting structure will be closer to the minimum and so will aid the calculation when a higher basis set is used. 'Opt=loose' means that a loose convergence criteria has been set. If a high convergence criteria was set then the limits set are more accurate than the method employed and your calculation may not converge because this limit will never be reached.
A second optimisation calculation was then carried out using the originally chosen, higher accuracy, basis set. The log file containing the optimised structure of Mol 4, using a low basis set, was opened and the following calculation carried out; B3LYP/6-31G(d,p).
The code for the optimisation of Mol 4 using a low basis set is;
# opt=loose b3lyp/3-21g geom=connectivity
Dimer1_New
D-Space reference:DOI:10042/to-3985
The code for the optimisation of Mol 4 using a high basis set is;
# opt b3lyp/6-31g(d,p) geom=connectivity
Dimer1_New_HighBS
D-Space reference:DOI:10042/to-3999
The optimised structures of molecule 4, using both a low accuracy basis set and a high basis set, are shown below;
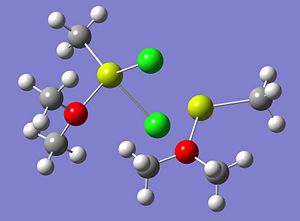 |
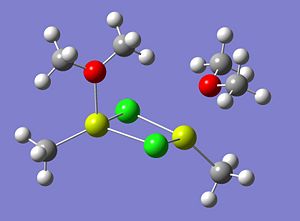 |
The energy of the optimised structure of Molecule 4 (using the higher basis set) was computed to be -1710.72460094 a.u. In order to ensure the minimal energy structure has indeed been obtained, a frequency analysis calculation was carried out on the optimised structure, from the high basis set.
The code for the frequency calculation of Mol 4 is given;
# freq b3lyp/6-31g(d,p) geom=connectivity pop=(full,nbo)
Dimer1_Freq
D-Space reference:DOI:10042/to-4005
When the calculation was complete, the vibrations were checked to ensure they all had positive frequency values. This was indeed the case and so it can be concluded that the optimised structure, shown above, is indeed the minimal energy structure.
A detailed frequency analysis for molecule 4 can be found further on in the project.
Learning from the mistakes made when optimising molecule 4, molecule 5 was modelled in Gausview and prior to optimisation the structure was manually modified so the Mg-Cl bond lengths were approx 2.19 Angstroms and the OMe2 groups were angles so to reduce the steric interactions between them. The starting structure (manually modified) for molecule 5 is shown below;
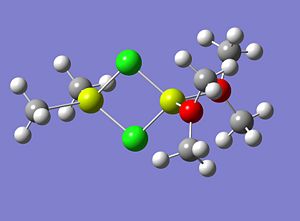 |
As was the case with molecule 4, molecule 5 was then optimised on two separate occations. Firstly using a low basis set and then secondly using the high basis set.
The codes for the low basis set optimisation of Mol 5 is;
# opt=loose b3lyp/3-21g geom=connectivity
Molecule5_optimisation
D-Space reference: DOI:10042/to-4113
The optimised structure of Molecule 5 is shown below and as can be seen this was not the desired result;
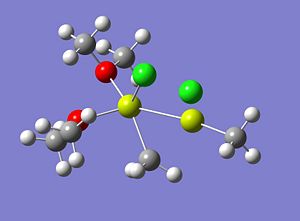 |
As can be seen from the image (and 3D representation) of the structure, the molecule has completely rearranged itself to a structure that hardly resembles the starting structure.
Please note: There was only time to run the optimisation of this structure on the lower basis set as the calculation only finished late Tuesday night. Additionally, a similar structure (OMe groups instead of OMe2) was optimised on the higher basis set and the same result was seen. This was also witnessed by Dr Hunt and the demonstrator on duty who both thought the rearrangement was strange.
As the optimised structure does not resemble the starting structure at all it can be concluded that this molecule is highly unstable and therefore that the equilibrium will lie strongly in the direction away from this conformation. It is to be expected that this conformation is much less stable than the others in the equilibrium (molecules 1-4) due to the bulky OMe2 groups being positioned close to each other on the same Mg atom. This will result in a large ammout of steric clash experienced by these two groups which will elevate the total energy of the molecule. Additionally, situating the two OMe2 groups on one end of the molecule will increase it's dipole moment. It is known that molecules prefer orient themselves so to decrease their overall dipole moment and so the OMe2 groups being at the same end of the molecule will again increase its energy and destabilise it.
| Molecule | Formular | Energy / a.u. |
|---|---|---|
| 1 | 2MeMgCl | -1400.532 |
| 2 | MgMe2 + MgCl2 | -1400.518 |
| 3 | Me2Mg2OMe2Cl2 | -1710.725 |
| 4 | Me2Mg2OMe2Cl2 | unstable |
From the table above, it is clear that molecules 1-3 are far more stable than molecule four. In fact molecules 1-3 have been computed to be 81400 kJ/mol more stable. This is extremely large value and not what would be expected as in an equilibrium reaction you would expect the energy difference between the components to be very small. The major reason for this unexpected result is that the solvent molecules OMe2 that are present in molecules 4 and 5 are not present in molecules 1, 2 and 3. This will affect the stability of these molecules dramatically, which is what has happened in this investigation. If I were given longer to investigate the Schlenk equilibrium or if this project was repeated, I would find a way to incorporate the solvent molecules into molecules 1, 2 and 3 in order to obtain a better and more realistic result. Unfortunately, due to the time constraints allocated to the completion in this report no further analysis of molecules 1, 2, 3 and 5 will be made.
Further Analysis of Molecule 4
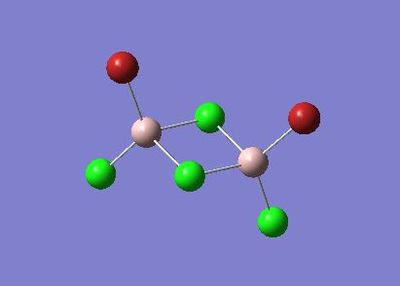
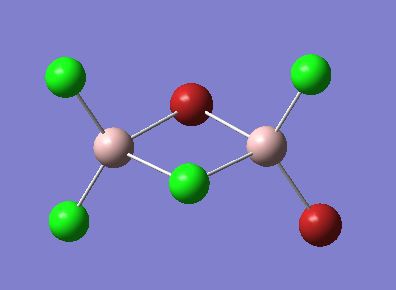
Molecule 4 exists as two isomers, isomer A and isomer B, shown below. This section of the project is dedicated to firstly; determining which of the two isomers is the most stable. Secondly, the stability of the isomers will be compared, which are in fact dimers, to the stability of the corresponding monomer (molecule 6).
 |
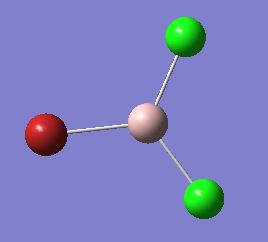 |
The optimisation and frequency analysis of isomer B has already been described above. Isomer A was optimised using the same method, using a low basis set first and then re-subbiting the calculation using a higher basis set.
The codes for the optimisation of isomer A are given below;
# opt=loose b3lyp/3-21g geom=connectivity
Dimer1_Isomer_Opt
D-Space reference:DOI:10042/to-4066
# opt b3lyp/6-31g(d,p) geom=connectivity
Dimer1_Isomer_Opt_HighBS
D-Space reference:DOI:10042/to-4067
The optimised structures of isomer A are shown below:
 |
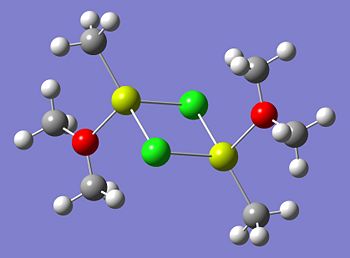 |
Now, as before, the optimised structure was confirmed to be the minimal energy structure using frequency analysis.
the codes for the frequency analysis of Isomer A;
# freq b3lyp/6-31g(d,p) geom=connectivity pop=(full,nbo)
Dimer1_Isomer_HighBS_Freq
D-Space reference:DOI:10042/to-4068
As all the vibrations have positive frequencies the minimal energy structure is confirmed. An in detail frequency analysis of isomer A can be found later in the report.
The table below summarises the stability of the two isomers along with the difference in energy between them.
| Isomer | Energy / a.u. | Energy Difference / kJ/mol |
|---|---|---|
| A | -1710.72460094 | |
| B | -1710.72123915 | 8.83 |
As can be seen from the table, it has been computed that Isomer A is less stable than Isomer B by 9kJ/mol. This is an unexpected result. It would be expected that the bulky OMe2 groups would prefer to be as far apart from each other as possible thereby minimising the steric clash experienced between them. Therefore, it would be expected that isomer A, with the OMe2 groups being on opposite sides of the molecule, to be the most stable.
The stability of these isomers will now be compared with that of the monomer (molecule 6). Molecule 6 was optimised using the same method used for molecule 4.
The codes for the optimisation of molecule 6 are given;
# opt=loose b3lyp/3-21g geom=connectivity
Monomer_solv_opt
D-Space reference:DOI:10042/to-4070
# opt b3lyp/6-31g(d,p) geom=connectivity
Monomer_solv_opt_HighBS
D-Space:DOI:10042/to-4071
The optimised structure of molecule 6 is shown below. The optimised structures using the lower and the higher basis set were exactly the same and so only one is shown.
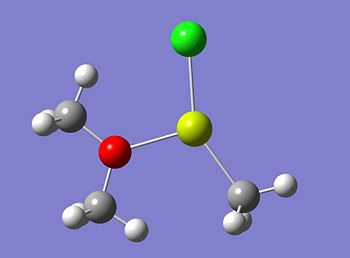
A frequency calculation was then carried out on the above structure to confirm it is in fact a minimum.
The codes for the frequency calculation of molecule 6 are;
# freq b3lyp/6-31g(d,p) geom=connectivity pop=(full,nbo)
Monomer_solv_opt_HighBS_freq
D-Space reference:DOI:10042/to-4072
The total energy of the molecule 6 was found to be -885.33884742 a.u. Therefore it is calculated that 2 molecules of monomer is more stable than isomer A by 120 kJ/mol and more stable than isomer B by 110 kJ/mol. That is to say that the computational method predicts that MeMgOMe2 would prefer to be a monomer than to dimerise as the monomer is more stable. These findings however, need to be supported empirically as they are only predictions. Scientific experiments are carried out in solution and the solvent present can, and does, stabilise/destabilise the reagents within it. As computational chemistry predicts the energy of molecules in the gas phase only weak comparisons can be made to a real life situation. Therefore, although the monomer is predicted to be the more stable configuration, this may not actually be the case.
Frequency Analysis
In this section, a detailed frequency analysis will be carried out which will compare the vibrations within the two isomers of molecule 4 and the vibrations within molecule 6 (the monomer). For simplicity, only the Mg-Cl stretches and the Mg-O stretches were analysed. The table below summarises the Mg-Cl stretches within isomers A and B along with their frequencies and intensities. As some of the vibrations are quite difficult to visualise from the pictorial representations alone, a brief description of each vibration has been included.
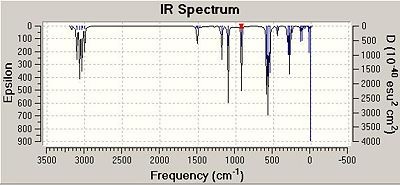
As can be seen from the table, the frequencies of the Mg-Cl stretches within the two isomers correlate very well indeed. In 3 out of four cases, in fact for all of the asymmetric stretches, the frequency of the vibrations in isomer B are higher than those for isomer A. It is only in the case of the symmetric stretch is the frequency higher for isomer A. Additionally, for the case of three out of the four vibrations within Isomer A, the intensity of the vibration is 0. This is because isomer A has a centre of inversion/is completely symmetric and so stretching and compression certain bonds results in no overall change in dipole moment of the molecule. Therefore, isomer A will have far less visible vibrations when compared to isomer B. This can be observed when comparing the IR spectra of the two isomers, shown below.
The table below summarises the Mg-O stretches within isomers A and B along with their frequencies and intensities. As some of the vibrations are quite difficult to visualise from the pictorial representaitons alone, a brief description of each vibration has been included.
From the table above, the frequencies of the vibrations in isomer B are higher than those in isomer A, this general observation was also made for the Mg-Cl stretches (above). Again, the symmetric stretch for isomer A has an intensity of 0, for the same reasons as stated above. It should also be noted that analysis of isomer A shows a symmetric stretch, where both Cs move in the same direction, and an asymmetric stretch, where the two Cs move in the opposite direction. This was not found to be the case for isomer B; the two vibrations showed the Cs moving independently of each other i.e. the lower frequency vibration only showed the C on the right moving and the higher frequency vibration only showed the C on the left moving.
The table below summarises the Mg-O and Mg-Cl stretches present in the monomer (of the two isomers analysed above) MeMgOMe2Cl.
On analysing the vibrations within the MeMgOMECl monomer two strong conclusions can be drawn which agree nicely with 'chemical intuition. Firstly, the frequency of the Mg-O bond does not vary to a great extent among the three molecules (Isomer A, B and the monomer). This implies that the strength of the Mg-O bond is similar within all three molecules. This is to be expected because, as the OMe2 group is isolated from the two bridging Cl atoms it is not losing any electron density in stabilising them. Therefore, the strength of the Mg-O bonds in the two dimers should be similar to that in the monomer and represent a Mg-O sigma bond. Secondly, the frequency of the Mg-Cl bond is much higher in the monomer compared to those in the two dimers. Again, this is to be expected as the Cl atoms within the two dimers are bridging atoms and so their electron density is shared between three atoms instead of 2. The Cl atoms in the two isomers are forming three centre two electron bonds and so the bonds have less localised electron density than the Mg-Cl bond in the monomer. As a higher frequency vibration indicates a stronger bond it can be concluded that the Mg-Cl bond in the monomer is stronger than those in isomers A and B.
 |
 |
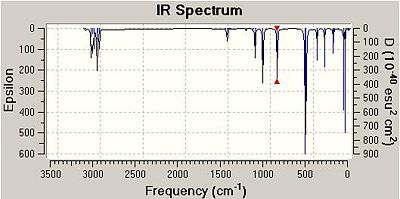 |
From comparing the three IR spectra, the peaks in all three appear at very similar frequencies; in fact the spectra themselves look very similar. as the same atoms are present in each molecule, this is a good result. The effect of the centre of inversion in Isomer a can be seen visually from looking at its spectrum and that of isomer B. There are notably less peaks in the spectrum of isomer A, this is because many of the vibrations within the molecule are IR inactive.
Molecular Orbital Analysis
This section of the project is dedicated to investigation how the electron density is distributed within the two isomers. In particular I will be looking at how the electron density around the bridging Cl atoms are distributed and then make a conclusion as to where the stabilising interactions are for the bridging Cl atoms. An MO analysis is to be carried out on both isomers A and B, and a comparison made as to the differences and similarities between their molecular orbitals. Additionally, an Mo analysis is to be carried out on the monomer, molecule 6. The MOs of the bridging Mg-Cl and non-bridging Mg-Cl can then be compared.
Note that: The MO analysis for the 3 molecules was attempted using the SCAN option. However an error message occurred and the MOs could not be retrieved. Dr Hunt and the demonstrator was informed of this and so the MO calculations were advised to be run on the laptop via Gausview. The checkpoint files for the MO analysis of the two isomers were not uploaded as they were too large in data size. However, Dr Hunt and the demonstrator were present when I was analysing the MOs so are aware that I carried out the work.
The reference for the checkpoint file for the MO analysis of the monomer is; https://www.ch.ic.ac.uk/wiki/index.php/Image:Monomer_Gausview_MO.chk
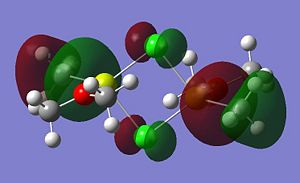
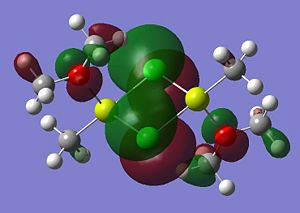
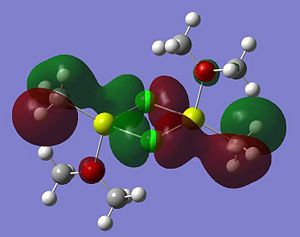
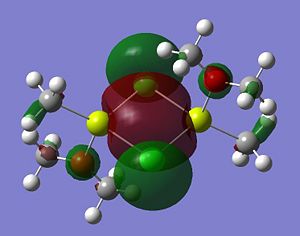
Listed below are the LUMO, the HOMO and the other relevant MOs for isomer A. By relevant I mean the MOs that show interactions between the bridging Cl atoms and the rest of the molecule.
 |
 |
 |
 |
 |
 |
 |
A summary of what each MO shows is given below;
- HOMO: The HOMO shows a bonding interaction along the two Mg-C bonds. Also shown is a large amount of electron density on the two Me groups which is all bonding and a set of lone pairs on the Cl atom can be seen.
- HOMO-4:This MO shows a set of lone pairs on the Cl interacting with each other in a bondong transannular fashion.
- HOMO-7: In this case there are two stabilising/bonding interactions between one of the Cl lone pairs and the O atoms.
- HOMO-8: Here a set of lone pairs on the two Cl atoms display a transannular, bonding/stabilising interaction
- HOMO-11: In this case the all bonding electron density located on the two Me groups are interacting, in a bonding/stabilising fashion, with another lone pair on the two bridging Cl atoms.
- HOMO-13: In this case there is a very strong bonding/stabilising interaction between the lone pairs on the Cl atoms that are orientated towards each other. The bonding MO stretches the whole width of the four membered ring to the Mg atoms. The interaction almost resembles that of a sigma bond in a Cl2 diatomic.
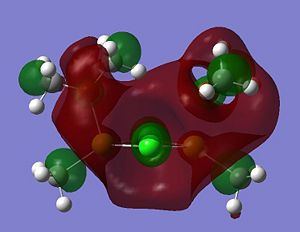
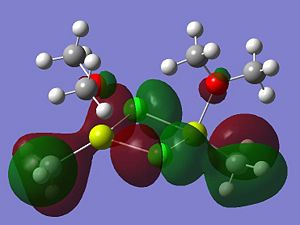
Listed below are the LUMO, the HOMO and the other relevant MOs for isomer A. By relevant I mean the MOs that show interactions between the bridging Cl atoms and the rest of the molecule.
 |
 |
 |
 |
 |
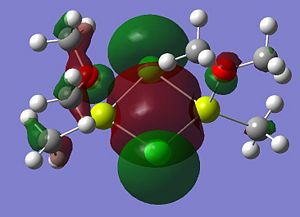 |
A summary of what each MO shows is given below;
- LUMO
- HOMO The HOMO shows a bonding interaction along the two Mg-C bonds. Also shown is a large amount of electron density on the two Me groups which is all bonding and a set of lone pairs on the Cl atom can be seen.
- HOMO-4This MO shows a set of lone pairs on the Cl interacting with each other in a bonding transannular fashion.
- HOMO-7In this case there are two stabilising/bonding interaction between one of the Cl lone pairs and the O atoms.
- HOMO-10In this case the all bonding electron density located on the two Me groups are interacting, in a bonding/stabilising fashion, with another lone pair on the two bridging Cl atoms.
- HOMO-13In this case there is a very strong bonding/stabilising interaction between the lone pairs on the Cl atoms that are orientated towards each other. The bonding MO stretches the whole width of the four membered ring to the Mg atoms. The interaction almost resembles that of a sigma bond in a Cl2 diatomic.
Discussion
From looking at the molecular orbitals for the two isomers it is clear that they are very similar. This is to be expected as they have similar structures and contain the same atoms. It was also noticed that most of the relevant MOs were found at quite low energies. Again this is to be expected as bonding orbitals that are at lower energies are representative of the stabilising interactions within a molecule. In addition, the stabilisation of the bridging Cl atoms comes from a range of location within the molecule. The HOMO-7 shows the OMe2 oxygen atom donating electron density towards the lone pairs on the Cl atoms. This bonding interaction goes towards stabilising these 3 centre two electron bonds. A similar interaction in seen in HOMO-10 and 11 where the all bonding CH3 MO is again donating electron density towards the Cl atom and forming a bonding interaction with the lone pairs. It is also noted that the two Cl atoms are acting to stabilise each other, in particular in the HOMO-13 MO, with transannular interactions. These results are interesting as non of the stabilisation of the bridging, three centre two electron, Mg-C bonds are stabilised by the two magnesium atoms. In fact no MO orbital could be found that showed such bonding interactions. At first I found this observation surprising, however, when considering that the magnesium atoms are highly polarised these observations make sense. As the two Mg atoms are bonded to Cl atoms and an O atom, which are all highly electronegative, the Mg atoms are therefore highly polarised and so are essentially slightly positive. The fact that the Mg atoms are hypervalent will also contribute to this factor. Therefore, there will be very little, or as the MO analysis shows, no electron density located on the Mg atoms. This rationalization accounts for the lack of bonding/stabilising interactions along the Mg-Cl bonds and also why the bridging Cl atoms are stabilised from elsewhere within the molecules.
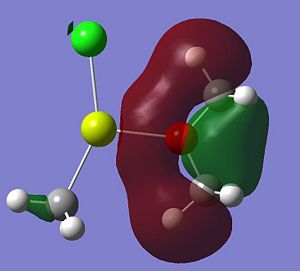
MO Analysis of Molecule 6, Monomer
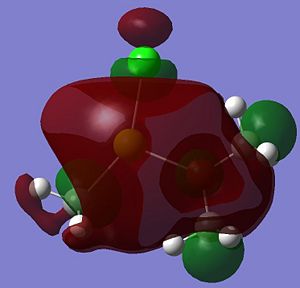
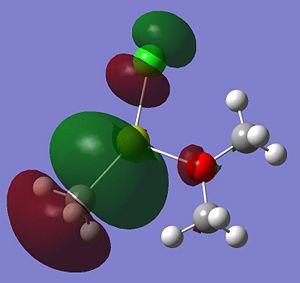
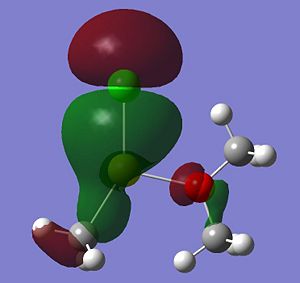
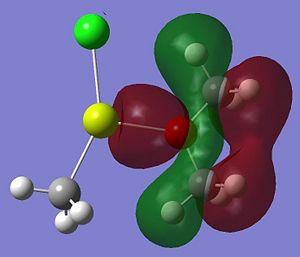
Listed below are the LUMO, the HOMO and the other interesting MOs for molecule 6.
 |
 |
 |
 |
 |
A summary of what each MO shows is given below;
- HOMO: This MO shows a bonding interaction along the C-Mg bond. A set of Cl lone pairs are also shown.
* HOMO-3: This Mo shows a large amount of electron density on the Mg atom which stretches from the Me group up to the Cl atom. There is a strong bonding interaction shown along the Mg-Cl bond.
- HOMO-7: This MO shows some electron density residing between the Mg and the O atom.
- HOMO-12: This MO shows a large amount of electron density stretching from the top hydrogen, to the O atom and down to the bottom hydrogen. This is a strong and bonding interaction and could be rationalized by a possible intramolecular hydrogen bond.
Discussion
In contrast to the molecular orbital for isomers A and B, described above, the MOs for the molecule 6 show much more electron density located on the Mg atom. In particular this is represented by the HOMO and the HOMO-3. This implies that the Mg atom in the monomer is far less highly polarised that in the case of the dimer. This result is what would be expected as the Mg atom is bonded to one less highly electronegative atom. As a result there is no evidence of interactions of the Cl lone pairs with the rest of the molecule. This again makes sense as the Cl atoms are no longer bridging and so there is no need for any extra stabilisation from e.g. the O atom.


