Rep:Mod:Carolyn2
Inorganic Module 2: Bonding
BH3
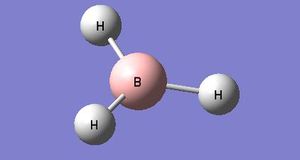
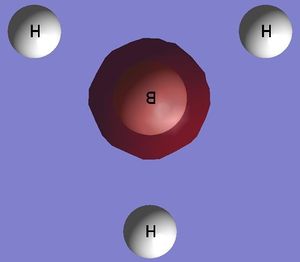
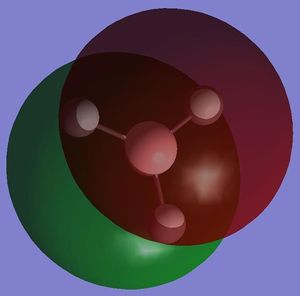
The adjacent representation of BH3 was created and modelled using Gausview, each B-H bond was then altered to measure 1.5 Angstroms each. The molecule was then optimised using the B3LYP method with a basis set of 3-21G. it should be noted that this choice of basis set is of quite low accuracy however it was chosen as the calculation will be very quick to complete. Once the calculation was complete, the output of the optimised BH3 molecule was analysed, this was done by opening the corresponding log file in order to view the results.
The code for the optimisation is;
# opt b3lyp/lanl2mb geom=connectivity
BCl3 optimisation
Log File: https://www.ch.ic.ac.uk/wiki/images/8/8e/CAROLYN_BH3_OPT.LOG
The optimised B-H bond distances were calculated to be 1.19 Angstroms. The optimised H-B-H bond angles were calculated to be 120.0o. This result compares exactly with those found in the literature (bond length, B-H; 1.19 A and angle, H-B-H; 120o) [1] and therefore it can be concluded that a minimal basis set is accurate when computing geometrical components of small molecules. Other important pieces of information about the calculation are listed below;
- File type: .log
- Calculation type: FOPT
- Calculation method: RB3LYP
- Basis set: 3-21G
- Energy: -26.46 au
- Gradient: 0.000206 au
- Dipole Moment: 0 D
- Point Group: D3h
- Time taken for calculation: 23 seconds
The gradient is a particularly important piece of information, if it is less that 0.001 in value as the one stated above is, shows that the molecule has actually been optimised.
 |
 |
When an optimisation is run, the program is attempting to find the best representation (i.e. the most stable) for the structure in the input file for the given basis set. The better the basis set, the better the representation but the longer the calculations will take. The starting structure is modified in a series of stages as the program searches for the optimised structure, as this happens the gradient approaches zero as the difference in energy between the starting structure and the optimised structure is reduced. The first of the two graphs (above), total energy vs optimisation step number, gives the energy of the BH3 molecule at each individual step of the optimisation. The second of the two graphs (above), root mean square gradient vs optimisation step number, gives the gradient of the energy of the BH3 molecule at each individual step of the optimisation. Therefore, from observing the two graphs above, it can be concluded that it took three individual stages to find the optimised structure of the BH3 molecule (as the graphs depict three different changes in the gradient).
Molecular Orbitals of BH3
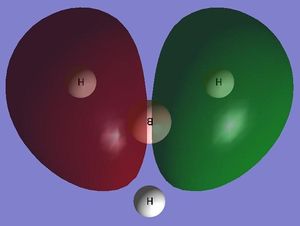
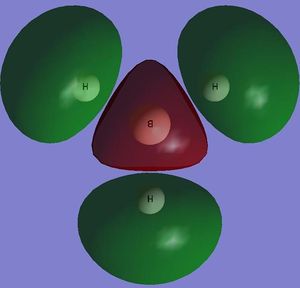
One of the most useful aspects of computational chemistry is that the electronic structure of the starting molecule is solved when carrying out calculations and so we are able to obtain representations of the molecular orbitals of the starting molecule. This shall be demonstrated in the section below using the optimised structure of the BH3 molecule shown above as a starting point. Using the checkpoint file from the previously optimised BH3 molecule a MO analysis was carried out by setting the method to 'energy', writing 'pop=full' in the additional keywords box and selecting 'Full NBO'. The calculated molecular orbitals were then visualised using Gausview.
The code for the MO calculation of BH3 is;
# b3lyp/3-21g pop=(nbo,full) geom=connectivity
BH3 optimisation
Log file: Carolyn_BH3_POP
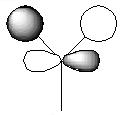
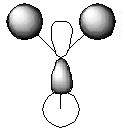
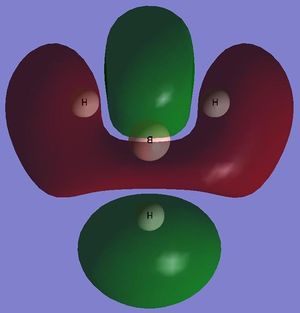
Below is an MO diagram of trigonal planar BH3. The LCAO MOs for each energy level are shown on the diagram along with their corresponding calculated ('real') MOs. (for simplicity the 1s atomic orbital of the boron fragment is not shown as it is far lower in energy than that of the 2s atomic orbitals and so no interaction is seen with it and the atomic orbitals of the three hydrogen based fragments. Therefore, the 1s AO of the boron fragment remains non-bonding)
The LCAO MOs and the computed/real MOs will now be compared in more detail;
From studying the comparisons made in the table above, it can be concluded that the computational methodology for calculating the MOs of a molecule is far superior than the LCAO method. The computed MOs are more realistic than the LCAO MOs as they can be visualised in 3D. This allows for a thorough analysis of where the electron density is located within the molecule. Additionally, the ability of the computed MOs to 'blend' the in-phase AOs contributes to the superiority of this method. Although in some cases the LCAO MOs can be easily imagined as the real MOs e.g. one can easily imagine the s and p orbitals of the 1e' LCAO MO being blended together to form the HOMO-1 computed MO, in other cases this is much more difficult e.g. the 2e' LCAO MO forming the LUMO+2 computed MO. Also the LCAO method can only be used to predict all the MOs up to and including the LUMO+3 where as in the case of the computational method all the MOs are computed up to and including the LUMO+10 therefore, only computational chemistry can be used to analyse these molecular orbitals.
NBO Analysis of BH3
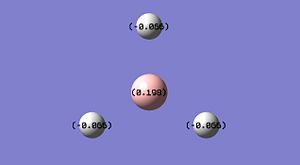
NBO analysis can be used to determine the charge distribution throughout a molecule, this can be done visually through colouring the individual atoms accordingly, or numerically through labelling the individual atoms with their appropriate charges. A natural bond orbital (NBO) analysis was carried out on the .log file from the population analysis of BH3 made in the section above. When selecting the option 'colour atoms by charge' the representation, shown adjacent, was created where the bright red colour indicates a highly negatively charged atom and the bright green colour indicates a highly positively charged atom. This result is to be expected as boron an electron deficient atom and so will be positively charged. When the 'show numbers' option is selected, the atomic charges are shown on the representation of the molecule (see adjacent picture). The atomic charges of the H atoms in BH3 are -0.066 and the NBO charges for the B atom is 0.198.
 |
 |
Frequency/Vibrational Analysis of BH3
In order to calculate the vibrations of BH3 the previously optimised structure was used and the following calculation was carried out; method = frequency calculation (DFT-B3LYP) the basis set used was 3-21G and the additional keywords used were 'pop=(full,nbo).
The code for the frequency calculation of BH3 is shown below;
# freq b3lyp/3-21g geom=connectivity pop=(full,nbo)
BH3 frequency
Log File:https://www.ch.ic.ac.uk/wiki/images/5/5d/CAROLYN_BH3_FREQ.LOG
The table below shows the 6 computed vibrations for BH3 along with their frequencies, intensities and symmetry point group;

Although a total of 6 vibrations were computed, the IR spectrum of BH3 (shown above) only displays three peaks. This observation can be rationalised firstly, by considering vibration 4. This vibration has been assigned to the symmetry point group A1', this means than all the inherent vibrational movements are symmetric and therefore effectively cancel each other out. Therefore this vibration, although it exists, is IR inactive and this is why it has an intensity of 0 and so does not appear on the IR spectrum. The second rationalization is that of the 5 remaining vibrations there are two pairs of degenerate vibrations; vibrations 2 and 3 and vibrations 5 and 6. These degenerate vibrations have exactly the same vibrational frequencies and so only one peak is seen on the resulting spectrum per pair of degenerate vibrations. Therefore, these two peaks along with that corresponding to vibration 1 gives a total of 3 peaks which is what is shown on the IR spectrum above.
The literature frequencies for the BH3 molecule are 1125, 1640 and 2808 cm-1 [2]. These don't correlate all that well with the computed values. Normal 0 false false false EN-GB X-NONE X-NONE MicrosoftInternetExplorer4 Discrepancies between computed and empirical IR values are discussed further on in the report.
BCl3

The adjacent representation of BCl3 was created and modelled using Gausview. Unlike the case for BH3 (above) the molecule was optimised using the LanL2MB basis set. This basis set is of a medium accuracy and so the calculation will take longer than for BH3. Before the molecule was optimised, the symmetry of BCl3 was restricted to the D3h point group using a 'very tight (0.0001)' tolerance.
The code for the optimisation of BCl3 is;
# opt b3lyp/lanl2mb geom=connectivity
BCl3 optimisation
Log file: https://www.ch.ic.ac.uk/wiki/images/1/10/CAROLYN_BCL3_OPT.LOG
The optimised B-Cl bond distances were calculated to be 1.87 Angstroms. The optimised Cl-B-Cl bond angles were calculated to be 120.0o. These values compare well with those stated in the literature (bond length, B-Cl; 1.74 A and angle, Cl-B-Cl; 120o)[1]. Other important pieces of information about the calculation are listed below;
- File type: .log
- Calculation type: FOPT
- Calculation method: RB3LYP
- Basis set: LANL2MB
- Energy: -69.44 au
- Gradient: 0.000821 au
- Dipole Moment: 0 D
- Point Group: D3h
- Time taken for calculation: 8 seconds
As the gradient is less than 0.001, it can be concluded that the molecule has in fact been optimised.
 |
 |
The first of the two graphs (above), total energy vs optimisation step number, gives the energy of the BH3 molecule at each individual step of the optimisation. The second of the two graphs (above), root mean square gradient vs optimisation step number, gives the gradient of the energy of the BH3 molecule at each individual step of the optimisation. Therefore, from the graphs depicted above, there is no change in the gradient of either graph and so it can be concluded that the optimisation of BCl3 was completed in one step/process.
Frequency Analysis
In order to ensure that the structure has indeed been optimised (i.e. the structure with the lowest possible energy has been obtained) the original optimised structure was subjected to a frequency analysis. This was carried out as follows; using the output file from the optimised BCl3 the method used was a frequency calculation (DFT-B3LYP) and the basis set was LANL2MB. No additional keywords were needed.
The code for the frequency calculation is given below;
# freq b3lyp/lanl2mb geom=connectivity
BCl3 frequency
Log File: https://www.ch.ic.ac.uk/wiki/images/8/81/CAROLYN_BCL3_FREQ.LOG
Six vibrations were calculated for the BCl3 molecule. All the frequencies were positive and so it can be concluded that the optimised structure has indeed been obtained and its energy is the minima. A summary of the 6 vibrations of BCl3 is shown below;
| Vibration | Frequency / cm-1 | Intensity | Symmetry D3h Point Group |
|---|---|---|---|
| 1 | 214.13 | 3.93 | E' |
| 2 | 214.13 | 3.93 | E' |
| 3 | 276.94 | 43.78 | A2 |
| 4 | 417.38 | 0.00 | A1' |
| 5 | 939.47 | 258.68 | E' |
| 6 | 939.47 | 258.68 | E' |
As BCl3 is has the same point group as BH3, all the vibrations have the same symmetry and would be represented in the same way. Therefore, I did not feel the need to include pictorial representations of the BCl3 vibrations. The IR spectrum of BCl3 is shown below, for the same reasons as explained for BH3 there are only three peaks displayed on the spectrum.

The method for the frequency calculation is stated above as is the basis set which was chosen to be LANL2MB. This is a medium level basis set and a so a compromise has been chosen between the time it would take the calculation to run and how good the result will be. It is crucial that the same methodology and basis set is used for a set of corresponding calculations if the results obtained are to be sensible. Different methods and basis sets approach calculations in different ways and use different assumptions i.e. they will simplify/complicate calculations in their own ways. Therefore, two different methods or basis sets are neither compatible nor comparable with each other. The ground state structure of BCl3 is trigonal planar in structure with D3h symmetry/point group. The optimised structure of BCl3, using Gausview, is calculated to also have D3h symmetry as stated in the log file (reference given above). Therefore, Gausview is capable of predicting the correct symmetry for small molecules and so gives an accurate representation of their structures.
A chemical bond describes an attractive interaction between two atoms, ions or molecules. Bonds can fluctuate in strength a great deal from strong bonds such as covalent bonds to much weaker bonds such as dipole-dipole interactions e.g. hydrogen bonding. It such be stated however that although the bonds do fluctuate in strength, they are always a stabilising force. In some cases Gausview does not draw a bond between a pair of atoms when we would expect one to be there. This does not mean that the bond does not exist it is simply due to that fact that Gausview only recognises bonds that are within a certain distance range. Longer bonds, for example inorganic bonds tend to be longer than organic bonds, that lie out of this range are not recognised by Gausview and so the program will not draw one between those specific atoms.
Isomers of Mo(CO)4L2
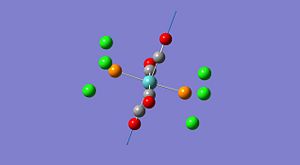
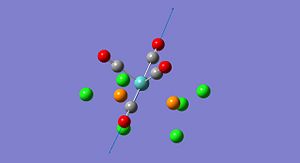
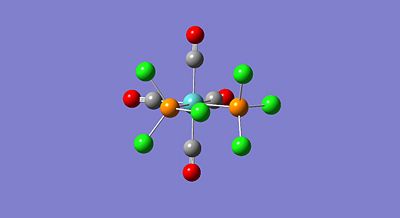
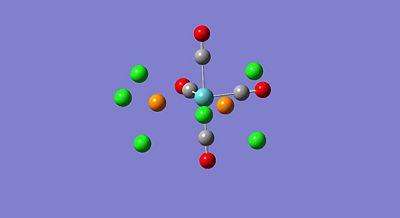
In this section the spectral characteristics, using vibrational analysis, and the thermal stabilities will be investigated for the two isomers of Mo(CO)4L2. The two isomers, i.e. the cis and trans isomers, are formed from the L ligands adopting either the two axial positions (trans) or positioned next to each other (cis). The isomers of Mo(CO)4L2 have many a time been investigated where L = PPh3, this ligand is however highly computationally demanding. Therefore, for this investigation, Cl ligands will be used in place of the phenyl rings as Cl atoms have very similar electronic effects on bonding and are still quite large sterically. All calculations made in this investigation have been submitted using the scan service. The ground state cis and trans isomers of Mo(CO)4(PCl3)2 are shown below;
 |
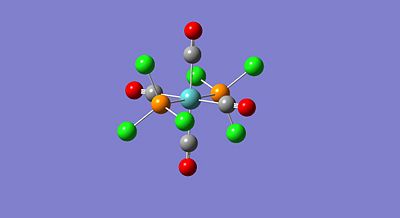 |
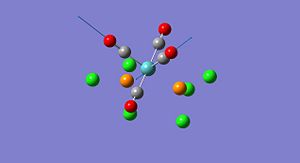
These ground state structures of cis and trans Mo(CO)4(PCl3)2 were then optimised using the B3LYP method and a low basis set and pseudo potential which was LANL2MB. As only a rough representation of the correct geometries a low basis set and pseudo potential was chosen as the calculations are finished quickly. The resulting optimised cis and trans structures are shown below;
The codes for the optimisations are given;
# opt=loose b3lyp/lanl2mb geom=connectivity
cis optimisation
D-Space reference:DOI:10042/to-3935
# opt=loose b3lyp/lanl2mb geom=connectivity
trans optimisation
D-Space reference:DOI:10042/to-3936
 |
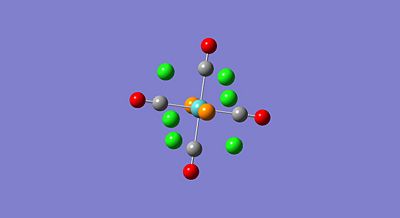 |
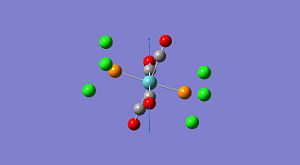
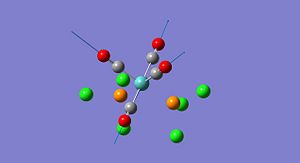
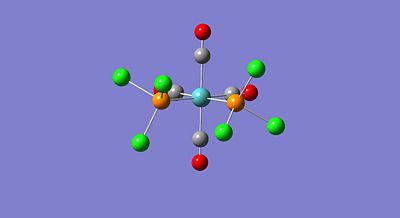
As can be seen from the optimised structures (above) there are no bonds depicted between the Mo and the P atoms and the P and the Cl atoms. This is simply because the computed bond distances are larger than those on the internal list of bond distances that Gausview has been programmed to recognise. However, Gausview has been mainly set up for organic compounds which, in general, have shorter bond distances than inorganic compounds, it is not to say that the bond do not exist just that they are not recognised by Gausview. This low level of optimisation, as described above, only provides a rough approximation of the optimal structures of the two isomers. In fact, the optimised structures above have been calculated with good bond lengths and bond angles however, the dihedral angles are not described very well. To fix this problem the optimised structures for the two isomers will be manually altered using the 'modify dihedral' button on Gausview to give a better representation of the dihedral angles. For the cis conformer the PCl3 groups were rotated so that one of the Cl atoms on one group points up parallel to the axial bond and that one of the Cl atoms on the other PCl3 group points down. For the trans isomer, the PCl3 groups were rotated so that both groups are eclipsed and that each of the groups lies parallel to one of the Mo-C bonds. The manually altered structures of the cis and trans conformers are shown below.
 |
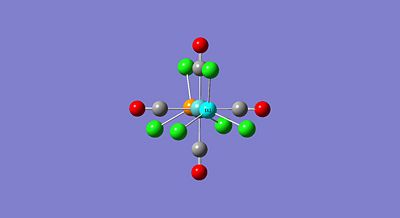 |
Using the altered geometries, shown above, the structures were optimised a second time. For the optimisation, the same B3LYP method was used however the basis set and pseudo potential was changed to LANL2DZ. Additionally the "Additional Keywords" were changed from "opt=loose" to "intultrafine scf=conver=9", this increases the electronic convergence. The LANL2DZ pseudo potential and basis set is much better that the LANL2MB option (used earlier) and as the geometries of the two conformers have been already optimised and altered to the best representation possible the calculation should now take a lot less time than if this basis set were used originally.
The codes for the second optimisationo f the two isomers are given below;
# opt b3lyp/lanl2dz geom=connectivity int=ultrafine scf=conver=9
cis optimisation 2
D-Space reference:DOI:10042/to-3937
# opt b3lyp/lanl2dz geom=connectivity int=ultrafine scf=conver=9
trans Optimisation 2
D-Space reference:DOI:10042/to-3938
Once the calculations were complete, it is necessary to ensure that the optimised geometry, i.e. the one with the lowest energy, has in fact been obtained. To do this, the IR frequencies of the optimised structure were computed.
Thecodes for the frequency calculations for both isomers is shown below;
# freq b3lyp/lanl2dz geom=connectivity int=ultrafine scf=conver=9
cis fequency analysis 2
D-Space reference;DOI:10042/to-3939
# freq b3lyp/lanl2dz geom=connectivity int=ultrafine scf=conver=9
trans frequency analysis 2
D-Space reference:DOI:10042/to-3940
As all the frequncies obtained were positive in value it can be concluded that the optimised structure is in fact the one with the lowest possible energy.
Comparing the Relative Energies of Cis and Trans Mo(CO)4(PCl3)2

Information about the optimisation calculation of cis-Mo(CO)4(PCl3)2 is shown below;
- Fie type: .log
- Calculation type: FREQ
- Calculation method: RB3LYP
- Basis set: LANL2DZ
- Energy: -623.577 au
- Dipole moment: 1.3101 D
- Point Group: C1
- Time taken for calculation: 31 mins 28 secs

Information about the optimisation calculation of trans-Mo(CO)4(PCl3)2 is showm below;
- File type: .log
- Calculation type FOPT
- Calculation method RB3LYP
- Basis set LANL2DZ
- Energy -623.57603113 au
- Gradient
- Dipole moment 0.3043 Debye
- Point group C1
- Time taken for calculation 1hr 16 min 15 sec
| Isomer | Energy / a.u. | Energy / kJ/mol |
|---|---|---|
| cis | -623.57707195 | -1637201.7271201 |
| trans | -623.57603112 | -1637198.9944208 |
| Energy Difference | 0.00104083 | 2.7326993 |
The table above shows that the most stable isomer has been calculated to be the cis isomer. The cis isomer was calculated to be more stable by a very small margin of 2.7 kJ/mol. This result however, is not what is to be expected; as the PCl3 ligands are most larger than the CO ligands sterically chemical intuition would assume that the most stable conformation of the complex would be when these two ligands are a far apart from each other as possible i.e. in the axial positions. Therefore, it would be expected that the trans isomer would be the more stable of the two and by quite a large amount. The reason for the calculation giving an inaccurate result is due to the basis set used. Although a medium (or higher) basis set was used; LAN2LDZ, it is still not high enough to provide an accurate result for the energies of the two isomers. In order to obtain a better result, a higher basis set should be used such as 6-31G (d,p). Additionally, a PPh3 ligand is usually used instead of PCl3 which is larger sterically and so is more likely to favour the trans conformation over the cis. Such an observation has been found regularly empirically[citation]. Therefore, to energetically favour the trans conformation the steric demand of the PCl3 ligands (or equivalent) should be increased.
Vibrational/IR Analysis of Cis and Trans Mo(CO)4(PCl3)2
Once the frequency calculations were complete they were checked to ensure that all the vibrations had positive frequencies. As all vibrations did indeed have positive frequencies, it can therefore be concluded that the correct optimised geometries have been obtained for the cis and trans conformers. For the cis isomer only one of the vibrations calculated had a low frequency. For the trans isomer two of the vibrations had low frequencies. These vibrations are depicted below;
| Isomer | Vibration | Frequency / cm-1 |
|---|---|---|
| cis |  |
10.73 |
| trans |  |
5.04 |
| trans | 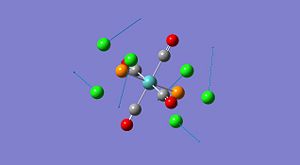 |
6.05 |
These low frequency vibrations are caused by vibrations along the Mo-P bond. At room temperature it can be assumed that these vibrations are caused by thermal energy and as the temperature is increased the vibrations will become stronger and so the frequency value will increase.
The preferred method for detecting which isomer of a Mo(L)4(L')2 complex is formed is through IR spectroscopy. Therefore, in most cases the chosen L ligand is CO. CO ligands are a good choice due to their distinctive absorption in the range 1700-2000 cm-1. The number of CO stretches visible in the IR spectrum corresponds to the number of individual CO bonds present within the complex. For the cis isomer one would predict the IR spectrum to have 4 individual CO stretches in the IR spectrum. However, as the trans isomer has a centre of inversion, one would expect less CO stretches to be present in the IR spectrum as some of the vibrations are lost/cancelled out due to symmetry i.e. they are IR inactive. Below are the computed CO stretched and the corresponding representations of the vibrations.
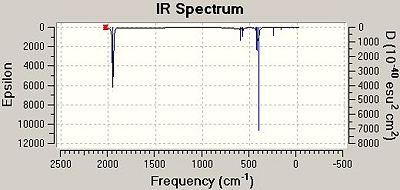
As can be seen from the table above there are 4 CO stretches computed for both isomers and these correspond to the four individual CO ligands present on the complex. As discussed above, it would be expected that less CO stretches are recorded for the trans complex as these are cancelled out due to the symmetry of the complex. Although, there were four individual stretches computed for the trans complex, two of these are very low intensity; the stretches at 1977 cm-1 and 2030 cm-1 have intensities of 0.65 and 3.77 respectively. Therefore, only two of the four computed stretches are relevant and are visible in the corresponding IR spectrum. Below are the two IR spectra for the cis and trans isomers. The spectrum of the cis isomer depicts distinct stretches in total that correspond to each of the CO ligands on the complex as they are in individual chemical environments. The spectrum of the trans isomer only shows 2 peaks that correspond to the CO ligands as the others are cancelled out due to symmetry reasons.
 |
 |
The computed values for the CO stretches can be compared to those stated in the literature [3].
| Computed Value | Literature Value | ||
|---|---|---|---|
| cis | trans | cis | trans |
| 2023 | 1950 | 2072 | - |
| 1958 | 1950 | 2004 | - |
| 1949 | 1977 | 1994 | - |
| 1944 | 2030 | 1986 | 1896 |
The literature values for the CO frequencies compare quite well with the computed values. The values do not compare very well because the empirical results are recorded when the product in the solution phase. Whereas, the computed values are from the molecules assumed to be in the gas phase. As solvents are known to have a large effect on the stability of reagent within them, this accounts for the differences between the literature and computed frequencies. Additionally, the literature values are stated for the Mo(CO)4(PPh3)2 complex and the computed values for the Mo(CO)4(PCl3)2 complex and although the Cl atoms are designed to simulate the phenyl rings, they cannot possibly give a highly accurate result.
Analysis of the Structures of cis- and trans-Mo(CO)4(PCl3)2 The table below compares the geometrical parameters of teh computed complexes to those stated in the literature [4].
| Mo-P Bond Length | Mo-C Bond Length | C-O Bond Length | P-Mo-P Bond Angle | P-Mo-C Bond Angle | C-Mo-C Bond Angle | |
|---|---|---|---|---|---|---|
| Literature Value | 2.50 | 2.01 | 1.65 | 180 | 87.2 | 180 |
| Computed Value | 2.44 | 2.06 | 1.17 | 177 | 91 | 179 |
The computed and the literature values for the geometrical parameters within trans-Mo(CO)4(PCl3)2 correlate well with each other. Therefore, the structure formed empirically is very similar to that calculated computationally.
References
- http://www.hbcpnetbase.com/
- www.hbcpnetbase.com//articles/09_07_90.pdf
- http://pubs.acs.org/doi/pdf/10.1021/ic50015a024
- www.phy.vab.edv/~mmckerns/oxidativeenhancement.pdf

