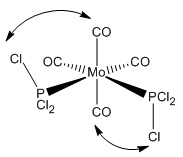
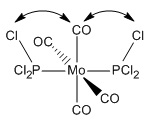
Rep:Mod:CaeserSalad78
Computational Labs - Module 2 (Inorganic Chemistry)
Author: Thomas McDevitt
This module focuses on the applications of computational mechanics to inorganic chemistry. We introduce basic quantum physics in order to more accurately optimize the geometry and calculate various other parameters such as infrared absorption spectra (based on vibration frequency calculations), and to even calculate molecular orbitals of the molecule. Different basis sets with varying accuracy are used for different situations. We will begin by applying these techniques to basic projects and comparing results to literature to get an idea of how accurate the various calculations are, after which we will soon begin to apply the same computational techniques to a small research project.
Computational Analysis of Borane
Geometry Optimisation/Analysis
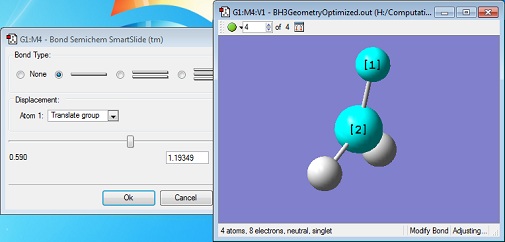
A molecule of borane was drawn into Gaussview. Its initial B-H bond lengths were 1.18Å, though these were manipulated to 1.50Å. The molecule was then optimized using Gaussian with a DFT/B3LYP method and a 3-21G basis set approximation. The log file was then opened, showing an optimized B-H bond length of 1.19Å[1].
 |
The bond angles were also found to be 120o (BH3 has a trigonal planar structure), as would be expected from Lewis theory and VSEPR theory. The bond length of borane cannot be compared to literature as it is a theoretical entity - it is such a strong Lewis acid that in practice it would only exist as a dimer (diborane, B2H6) or as an adduct coordinated to a Lewis base, such as ammonia (NH3).
| |||
| The optimized geometry of borane. |
The Gaussian results file was then analysed to check that the energy had converged to a minimum.
----------------------------
!   Optimized Parameters   !
! (Angstroms and Degrees)  !
----------------------                            ----------------------
! Name  Definition              Value          Derivative Info.        !
------------------------------------------------------------------------
! R1    R(1,2)                  1.1944         -DE/DX =    0.0         !
! R2    R(1,3)                  1.1944         -DE/DX =    0.0         !
! R3    R(1,4)                  1.1944         -DE/DX =    0.0         !
! A1    A(2,1,3)              120.0            -DE/DX =    0.0         !
! A2    A(2,1,4)              120.0            -DE/DX =    0.0         !
! A3    A(3,1,4)              120.0            -DE/DX =    0.0         !
! A4    L(2,1,3,4,-2)         180.0            -DE/DX =    0.0         !
------------------------------------------------------------------------
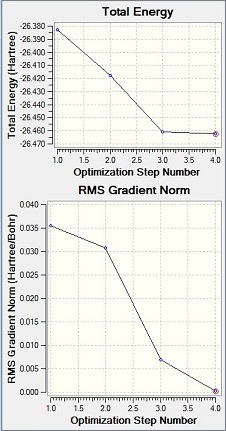
As shown, the derivatives (the gradient in the graph formed of energy against distance, or DE/DX) are 0.0 meaning that the energy of the molecule has converged to a minimum. This was also visible from the optimization plot (left) where the unit for energy, is the Hartree (one Hartree is equal to 4.360x10⁻¹⁸J[2]).

The animation to the right shows how the geometry of the molecule changes through the optimization. The bond lengths begin at their manually entered starting value of 1.5Å and shorten to their calculated optimum value of 1.19Å. An interesting thing to note is that the bonds aren't drawn into the molecule until the third iteration.
The quantum mechanical definition of a covalent bond (as identified by G. N. Lewis in 1916) is an electron pair shared between two neighbouring atoms.[3] In an ionic bond, cohesion between arises from the Coulombic attraction between oppositely charged ions, though this can also be seen as a limiting case of a covalent bond between dissimilar atoms.[3]. Gaussian has a rigid internal definition of a bond which stretches only to certain distances, but should the bond exceed these distances then they won't be drawn in at all. Bonds as lines are simply to make visualizing molecules more convenient, meaning that just because they haven't been drawn in it doesn't mean that they aren't there at all.
Molecular Orbital Analysis
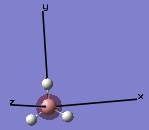
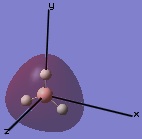
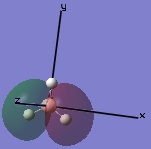
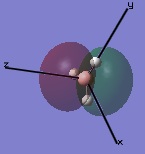
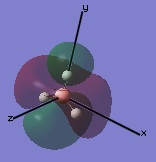
The molecular orbitals were then examined by setting the method to the energy (as opposed to optimization, the parameter used before) and additional keywords 'pop=full' used to enable MO analysis. The scan was run and the resulting molecular orbitals of borane analysed.[4]
 |
 |
 |
 |
 |
 |
 |
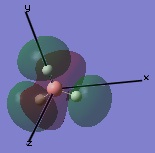 |
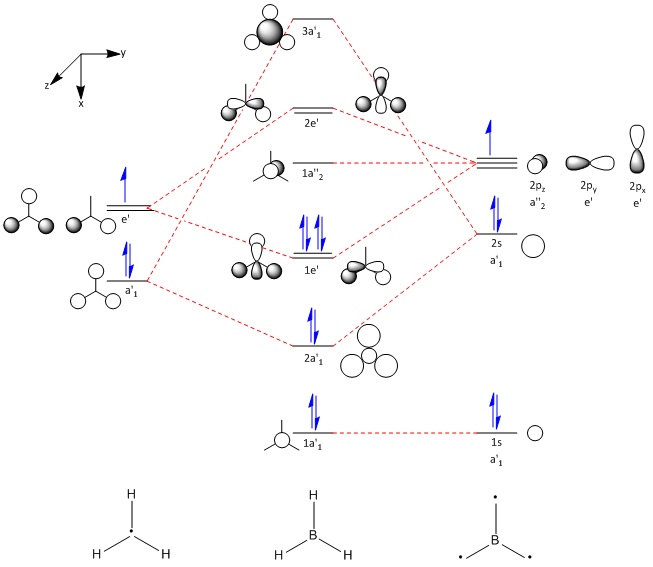
These computer-generated molecular orbitals are the same as the ones generated by the linear combination of atomic orbitals (LCAO) used in a molecular orbital diagram produced from molecular orbital theory. This is also where the symmetry labels for the orbitals arise from.
 |
 |
The natural bonding orbitals (NBOs) can also be analysed. Examining them in GaussView tells us about the charge density of Borane - that the boron atom in the center is very electron deficient (and hence, Lewis acidic) and that the hydrogens are a lot richer in electron density than the boron atom, though the whole molecule is neutral overall. This corresponds to behaviour expected from periodicity considerations, due to atomic boron's high electron deficiency (and tendency to form higher aggregates).
The data file can also be examined to extract additional information. Notably, the B-H bonds are constructed with 44.48% coming from the boron atom (this contribution has 33.33% 's' character and 66.67% 'p' character - hence, sp2 hybridisation and 55.52% coming from the hydrogen (this contribution, as expected, has 100% 's' character). This leads onto the conclusion that an 'sp2' hybrid orbital interacts with an 's' orbital from hydrogen to form a bond.
Frequency Analysis
Frequency/vibrational analyses were done on the molecules to assure minimum structures had been obtained. The scan was run again, however the method was set to 'frequency' and extra keywords 'pop=(full,nbo)' used to activate the full analysis of the electron density and the molecular orbitals for later use. The method was run and the resulting file published.[5] The real output for the *.log file was opened and analysed.
 Low frequencies ---   -0.6560   -0.0171   -0.0020   20.2021   21.4874   21.4974
 Low frequencies --- 1145.7147 1204.6590 1204.6600
Here, the first line signifies the motions of the center of mass of the molecule and the second line signifies the actual vibrations of the molecule, which should exceed the motions of the center of mass of the molecule. In this case, as shown, the smallest frequency (1146cm-1) exceeds the largest 'zero' frequency (21cm-1) meaning that from this, these results look reasonable. The symmetry labels for each vibration can also be extracted from this report.
                     1                      2                      3
                    A2"                    E'                     E'
 Frequencies --  1145.7147              1204.6590              1204.6600
 Red. masses --     1.2531                 1.1085                 1.1085
 Frc consts  --     0.9691                 0.9478                 0.9478
 IR Inten    --    92.6991                12.3789                12.3814
It can be seen that the first vibration has A2" symmetry, whereas the second and third vibrations both have E' symmetry.
The vibrations can be seen in the table below.
The total computer-generated IR spectra is as follows.
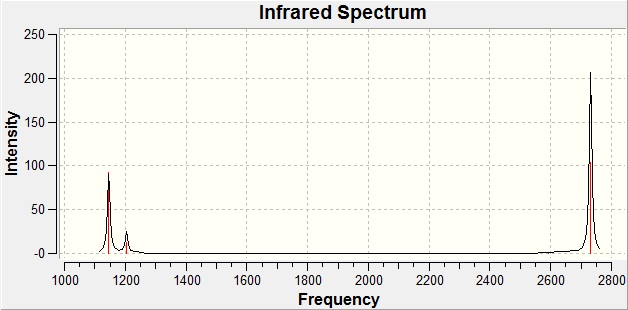
An interesting thing to note about the spectrum is that for a molecule with 6 vibrational modes, only three peaks are formed. This is because vibrations 2 / 3, and 5 / 6 are degenerate, meaning that their peaks will occur at the same frequency and will effectively superimpose themselves onto each other giving rise to a single peak for both vibrational modes. There is also a vibrational mode with an intensity of 0 (vibration 4) meaning that the molecule has this degree of freedom but doesn't vibrate in this way, hence not giving rise to a peak for it.
Computational Analysis of Thallium Bromide (TlBr3)
| |||
| The optimised structure of TlBr3. |
A molecule of TlBr3 was then drawn into Gaussian and optimized using the DFT/B3YLP method and the LanL2DZ basis set. This produced a structure with all the bond angles being equal to 120o (also a trigonal planar molecule, as was borane) and a Tl-Br bond length of 2.69Å[6] (literature: 2.52Å[7]). The bond length is much higher than that of BH3 primarily due to the fact that thallium and bromine both have much larger atomic radii than boron and hydrogen (hydrogen is in period 1, boron is in period 2, bromine is in period 4, and lastly thallium is in period 6). The frequency calculations were then run again as they had been done for borane.[8] The real output file was then analysed to check to see if the structure obtained was definitely a minimum.
 Low frequencies ---   -3.4213   -0.0026   -0.0004    0.0015    3.9367    3.9367
 Low frequencies ---   46.4289   46.4292   52.1449
As before, the first line signifies the motions of the center of mass of the molecule and the second line signifies the actual vibrations of the molecule. The lowest frequency (46cm-1) far exceeds the highest 'zero' frequency of approximately 4cm-1) hence it can be said that this obtained structure is a minimum.
The bond length of the calculated geometry for TlBr3 is higher (about 6% higher) than the literature value. This difference exposes the differences between empirical reaction conditions and the parameters used to calculate such a value computationally. The weaknesses of the computational approach include the use of basis orbital sets which subtract from accuracy and that the result obtained will be for the molecule in the gaseous phase, whereas in this literature, the bond length is measured for the molecule in aqueous phase so another conundrum one is made to consider is what really defines the 'bond length' of the molecule. This would ideally be the internuclear distance under standard conditions and for the compound in its standard, state, but this isn't always the easiest thing to measure empirically OR computationally (in this case, the toxicity of thallium compounds will limit the options available).
A Transition Metal Complex - Mo(CO)4L2
Geometry Optimization using Basis Orbitals of Higher Accuracy
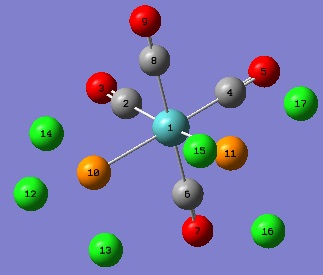
Two isomers of Mo(CO)4(PCl3)2 were drawn into GaussView - the first with the chloride groups cis- to each other and the other with the chloride groups trans- to each other. These were then optimized with Gaussian (using the Imperial College SCAN service) using an optimization DFT/B3YLP method and a LANL2MB orbital basis set.
|
| |||||||
Key
- Teal - Molybdenum.
- Grey - Carbon.
- Red - Oxygen.
- Orange - Phosphorus.
- Green - Chlorine.
An obvious feature about the optimized geometries is that there are no bonds between the chlorine and phosphorus. This is due to GaussView's in-built list of bond distances which, when exceeded, no bond is drawn. The bonds are still there, they just aren't being represented by a line in this case. Upon comparing the bond distance to another bond with a line drawn, such as the Mo-C bond, one can how the bond that hasn't been drawn is longer.
| P-Cl bond length | Mo-C bond length | |
| Cis- isomer[9] | 2.11Å | 2.41Å |
| Trans- isomer[10] | 2.10Å | 2.40Å |
However, these obtained results are not the very lowest energy conformational minima due to the fact that the low level basis orbital set used - it doesn't minimize dihedral angles ideally and this applies particularly to free rotation of the PCl3 groups. Hence, we take these two optimised isomers and adjust the PCl3 groups to become closer to what we would expect and then re-optimise using a higher accuracy orbital basis set.
Due to the higher accuracy of these calculations, they took a lot longer to run on the Imperial College SCAN service than previous calculations (between 10 and 20 minutes, as opposed to less than 5 minutes). The results follow.
|
| |||||||
This run shows a lower energy conformational minima. One more optimisation was done after this to generate more accuracy by accounting for the d-orbital interaction in phosphorus by adjusting the Gaussian input files appropriately but after the calculations had been done, the energy values came out exactly the same with no observable differences in the geometry (particular attention was paid to the PCl3 groups) suggesting that the geometry obtained was, in fact, the most stable.
| Cis- isomer | Trans- isomer | |
| First Optimisation | -617.52501785 a.u. | -617.52204781 a.u. |
| Second Optimisation | -623.57707195 a.u. | -623.57603098 a.u. |
| Third Optimisation | -623.57707195 a.u.[13] | -623.57603098 a.u.[14] |
One conclusion that can be deduced from the results obtained is that the cis- isomer is slightly more stable than the trans- isomer. This contrasts to the triphenylphosphine equivalent of this molecule, Mo(CO)4(PPh3)2, for which the trans-isomer is more stable.
 |  |
| Atom Group | Value | Literature Comparison |
| The Cis- Isomer | ||
| Mo1 - P10 / Mo1 - P11 (bond length) | 2.51Å | 2.58Å - Mo(CO)4(PPh3)2[15] |
| P10 - Mo1 - P11 (angle) | 94.2o | 145o - Mo(CO)4(PPh3)2[15] |
| P10 - Mo1 - C2 / P11 - Mo1 - C4 (angle) | 89.4o | |
| C2 - Mo1 - C4 (angle) | 87.0o | |
| The Trans- Isomer | ||
| Mo1 - P10 / Mo1 - P11 (bond length) | 2.44Å - Mo(CO)4(PPh3)2 | 2.50Å[16] |
| P10 - Mo1 - C4 / P11 - Mo1 - C4 (angle) | 91.3o | 92.0o - Mo(CO)4(PPh3)2[16] |
| C8 - Mo1 - P11 / C8 - Mo1 - P10 (angle) | 88.7o | 87.2o - Mo(CO)4(PPh3)2[16] |
The differences in the bond angles shown and 90o are the deviations of these molecules from an 'ideal' octahedral complex. These variations are caused by the steric demand of the PCl3 ligands. As can be seen, this effect is more prominant in the cis- isomer where the ligands have to shift to relieve the strain of being adjacent to each other, and this is reflected in the longer Mo-P bond length with respect to the same bond length in the trans- isomer.
It is difficult to comment on which isomer is more stable. The difference between the energies of the isomers as computed by Gaussian is less than 0.01 a.u. (where 1 a.u. is 1 Hartree) which is well under the error limitations of the results, meaning that any conclusion about the relative stability would be inaccurate. What can be deduced is that they do have very similar energy, suggesting that if the kinetic barrier for the isomerisation isn't too high, then the isomerisation process may be very labile, particularly at room temperature - though this is definitely the case in the triphenylphosphine equivalent.[15]
When considering the triphenylphosphine derivative, the most obvious difference will be the hugely increased steric bulk of the non-carbonyl ligand groups, accounting for the much higher cone-angle (the P-Mo-P) in the literature value compared to the P-Mo-P angle obtained by the computer. The steric clash of the triphenylphosphine groups in the cis- isomer destabilizes it to the point that the trans- form is about 2-3 kcal/mol more stable,[15] whereas isomerisation still occurs via the dissociative loss of PPh3 since this process is significantly more labile than loss of a similar ligand from a molybdenum metal center, such as PMe2Ph or PMePh2.[15].
The differences between literature values and obtained values for the trans- complex are most likely due to experimental errors in the approximations used in the calculations, differences in reaction conditions (such as the phases of empirical and computational conditions) and the difference in the molecule caused by substituting the PPh3 group for a PCl3 group.
For the purposes of using such a complex in catalytic chemistry, the relative stabilities of the cis- and trans- isomers could be fine-tuned by adjusting the steric bulk of ligand 'L' in the structure Mo(CO)4L2. A much more sterically hindering ligand would effect trans- isomerism, whereas a less sterically demanding ligand will likely favour cis- isomerism.
Frequency Calculations of Molybdenum Complexes
Frequency calculations were then performed for both Mo complexes in their optimised states (the results from the second optimisation were used). The same orbital basis sets and methods were used with the job type being changed to frequency. The Gaussian input files were sent to SCAN for calculation. Once completed, the vibrations were animated as GIFs and analysed.
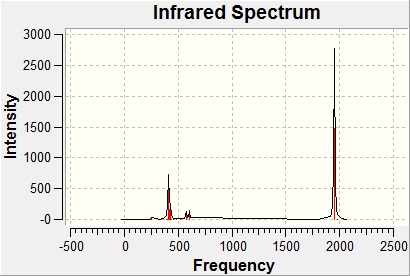
The stretching frequencies of the carbonyls were then examined. Infrared spectroscopy is a technique to telling between these two isomers because of these stretching frequencies - the cis- complex has four carbonyl ligands each in a different environments due to its symmetry, meaning that each carbonyl would give rise to a seperate peak, whereas all of the carbonyl ligands in the trans- complex are in the same environment - and as such, would all form a peak at the same frequency.
The cis- isomer has symmetry elements:
...and its symmetry point group is: C2v. | The trans- isomer has symmetry elements:
...and its symmetry point group is: D4h |
| Carbonyl Stretches - the Cis- Isomer | |||
| Form of the Vibration | Frequency / cm-1[17] | Literature Equivalent / cm-1[18] | |
 | 1945 | 1986 | |
 | 1948 | 1994 | |
 | 1958 | 2004 | |
 | 2023 | 2072 | |
| Carbonyl Stretches - the Trans- Isomer | |||
| Form of the Vibration | Frequency / cm-1[19] | Literature Equivalent / cm-1[18] | |
 | 1951 (1950.52) | 1896 | |
 | 1951 (1951.16) | 1896 | |
It can be seen that there is a systematic error present causing all of the peaks calculated by Gaussian to appear approximately 40-50cm-1 lower than empirical readings in the cis- isomer and about 55cm-1 higher in the trans- isomer. This will be because of the differences in the conditions between computational calculations and empirical readings, as well as experimental error and possible small calibration errors within the engine used to perform the calculations.
Two peaks are obtained in the trans- complex, as opposed to the expected single band. Within experimental error, they occur at the same wavenumber but the computer sees the two groups of carbonyls in different environments since firstly the complex is not a perfect octahedron, and secondly the PCl3 groups aren't subject to free rotation when these calculations are performed. The orientation of the tetrahedral phosphorus ligands is such that the four carbonyls split into two different groups and, as far as the computer is concerned, rotate at a similar yet not identical frequency.
 |  |
A few low frequency vibrations were explored. There were two vibrational modes below 10cm-1 for the trans- complex, and none below this value in the cis- complex so the lowest frequency vibration was explored (10.7cm-1).
The results obtained from this minor analysis make sense since, as can be seen by animating the vibrations, they tend to involve the movement of larger fragments and would, accordingly, occur at a slower rate (hence a lower frequency). They would likely need more energy to be effected. At room temperature, they would have enough energy to vibrate at a very low (negligible) intensity, hence the lack of visible peaks in the IR spectrum.
Mini-Project - Stability of Basic Phosphorus Compounds
Abstract
Phosphorus is a group 5 element with 15 protons/electrons and a total molecular weight of 31. It is in row 3 of the period table, meaning that it is capable of achieving hypervalence due to the availability of d-orbitals (it happens to be the lightest element within the pnictogen group capable of doing so). For this to occur, its 's' and 'p' orbitals stretch beyond sp3 hydridisation and begin to hybridise with the d-orbitals, forming sp3d hybrid orbitals which are a lot bigger than sp3 hybrid orbitals and hence more disperse. As a result, larger hybrid orbitals become unable to form an effective overlap with smaller orbitals such as the 1s orbital in hydrogen to the point at which they cannot bond properly, whereas the sp3 orbitals could, explaining the existence of trigonal pyramidal PH3 (a tetrahedral arrangement with one electron lone pair) as a compound but why trigonal bipyramidal PH5 is only a hypothetical molecule. This part of the module aims to explore both of these compounds and explain why PH3 exists, yet PH5 is an unknown molecule.[20]
Optimisation of Structures
| |||
| The optimised structure of PH3.[21] |
Both PH3 and PH5 were drawn into GaussView and optimised using a DFT/B3YLP method and the even more accurate 6-311G(d,p) basis orbital set for additional flexibility within the calculations. As shown, no electron lone pair is visible in the output file of PH3, though this doesn't mean that it isn't there. There are three methods to detecting the lone pair's presence.
- The geometry of the molecule. If the molecule forms a trigonal pyramidal structure, it suggests that there is a lone pair occupying the region along the C3 axis of symmetry of the molecule where the hydride groups point away from.
- Distortions caused by the lone pair. Had there been a group in the position that the lone pair is expected in, the geometry of the molecule at phosphorus would be tetrahedral. However, since it is an electron lone pair, it should generate a stronger Coulombic repulsion, repelling the other bonds causing their bond angles to reduce and distort away from the standard 109o28' of regular tetrahedral compounds.
- The natural bonding orbitals. On analysis of the NBOs, the NBO of the lone pair should form an entry in the real output file.
We can already see from the structure that it is trigonal pyramidal - a good start! The bond angles can then be measured, and analysis of the NBOs will follow during the analysis of the molecular orbitals of PH3.
| |||
| The optimised structure of PH5.[22] |
PH5, however, clearly forms the expected trigonal bipyramidal structure as shown. Its bond angles between equatorial hydrogens are 120o each, the angle between an axial and any equatorial hydrogen is 90o, and the angle between the two axial hydrogens is exactly 180o (linear). The bond distance for the equatorial hydrogens is 1.43Å, and that of the axial hydrogens is 1.49Å. Despite the fact that this molecule is inexistant, it agrees with the statement that axial bond distances are consistently larger than equatorial bond distances for the trigonal bipyramidal PR5 series.[20]
Orbitals in PH3 and PH5
NBO Analysis - the Valence Bond Theory Perspective
The natural bond orbitals were analysed in the same way that they had been for BH3 earlier in this module. The real output files were analysed and the information about the NBOs searched for. Whilst there were many entries, only the key information will be printed.[23]
       (Occupancy)   Bond orbital/ Coefficients/ Hybrids
 ---------------------------------------------------------------------------------
     1. (1.99583) BD ( 1) P   1 - H   2
                ( 49.47%)   0.7033* P   1 s( 14.65%)p 5.79( 84.77%)d 0.04(  0.58%)
                ( 50.53%)   0.7109* H   2 s( 99.78%)p 0.00(  0.22%)
     2. (1.99583) BD ( 1) P   1 - H   3
                ( 49.47%)   0.7033* P   1 s( 14.65%)p 5.79( 84.77%)d 0.04(  0.58%)
                ( 50.53%)   0.7109* H   3 s( 99.78%)p 0.00(  0.22%)
     3. (1.99583) BD ( 1) P   1 - H   4
                ( 49.47%)   0.7033* P   1 s( 14.65%)p 5.79( 84.77%)d 0.04(  0.58%)
                ( 50.53%)   0.7109* H   4 s( 99.78%)p 0.00(  0.22%)
     9. (1.99613) LP ( 1) P   1           s( 56.11%)p 0.78( 43.85%)d 0.00(  0.03%)
Previously stated comments can be backed up by drawing data from this output. Notably, the lone pair does exist in this model and is held within an orbital with approximately 56% 's' character and 44% 'p' character. Another point, more relevent to the aim of the experiment, is the hybridisation of the orbitals - from this data we can tell that in PH3, the phosphorus bonds to each one of the hydrogens by interacting with their 's'-orbitals using a hybrid orbital of its own with about 15% 's' character and 85% 'p' character (different from a typical sp3 hybrid orbital, which is 25% 's' character and 75% 'p' character).
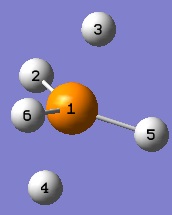
For PH5, the same output file (with irrelevent entries omitted) is as follows.[24]< Since some of the hydrogens are now in different environments, for this information to have true meaning, the atoms must now be labelled.
     1. (1.89433) BD ( 1) P   1 - H   2
                ( 48.32%)   0.6951* P   1 s( 21.47%)p 3.09( 66.36%)d 0.57( 12.18%)
                ( 51.68%)   0.7189* H   2 s( 99.76%)p 0.00(  0.24%)
     2. (1.76412) BD ( 1) P   1 - H   3
                ( 37.46%)   0.6121* P   1 s( 18.39%)p 2.72( 50.00%)d 1.72( 31.61%)
                ( 62.54%)   0.7908* H   3 s( 99.84%)p 0.00(  0.16%)
     3. (1.76412) BD ( 1) P   1 - H   4
                ( 37.46%)   0.6121* P   1 s( 18.39%)p 2.72( 50.00%)d 1.72( 31.61%)
                ( 62.54%)   0.7908* H   4 s( 99.84%)p 0.00(  0.16%)
     4. (1.89433) BD ( 1) P   1 - H   5
                ( 48.32%)   0.6951* P   1 s( 21.47%)p 3.09( 66.36%)d 0.57( 12.18%)
                ( 51.68%)   0.7189* H   5 s( 99.76%)p 0.00(  0.24%)
     5. (1.89433) BD ( 1) P   1 - H   6
                ( 48.32%)   0.6951* P   1 s( 21.47%)p 3.09( 66.36%)d 0.57( 12.18%)
                ( 51.68%)   0.7189* H   6 s( 99.76%)p 0.00(  0.24%)
Here, it is shown that, upon achieving hypervalence, the bonding orbitals formed by the phosphorus center begin to have 'd' orbital participation, particularly in the case of the axial hydrogens (bonds 2 and 3, atom labels 3 and 4). This supports the initial argument of the hybrid orbitals within hypervalent compounds being larger and hence unable to form bonds with smaller orbitals (such as the 1s orbital of hydrogen) that are strong enough to exist.
MO Analysis - the Molecular Orbital Theory Perspective
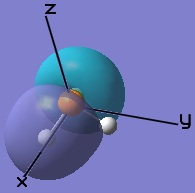
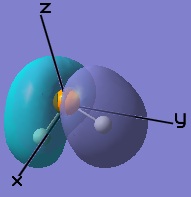
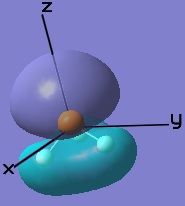
The molecular orbital diagrams of PH3 and PH5 will be drawn.
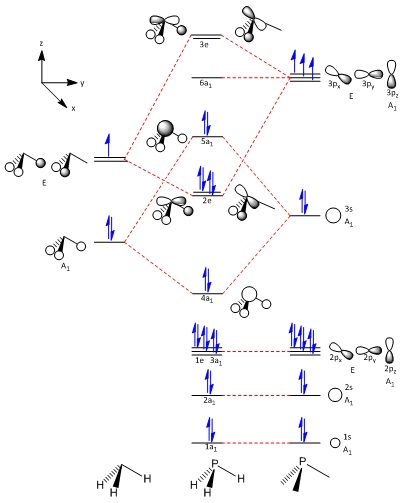
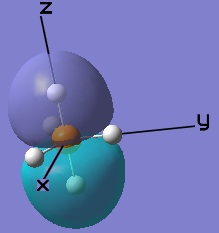
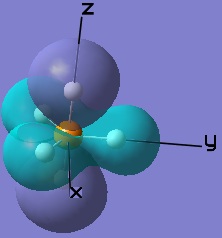
The molecular orbitals obtained through LCAO in constructing the MO diagram can be matched to the molecular orbitals obtained through computational analysis. Only the frontier orbitals will be considered.
 |  |
 |  |
The PH5 molecule, however, will need a bit more consideration when drawing its molecular orbital diagram.
| The Stage 1 MO diagram of PH5 | The Stage 2 MO diagram of PH5 |
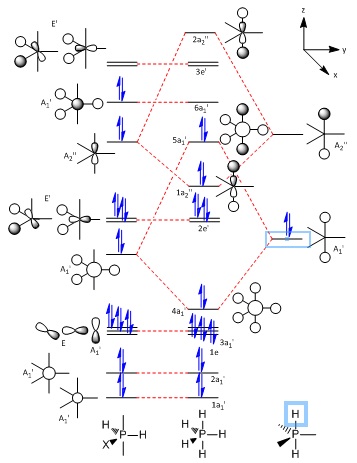 | 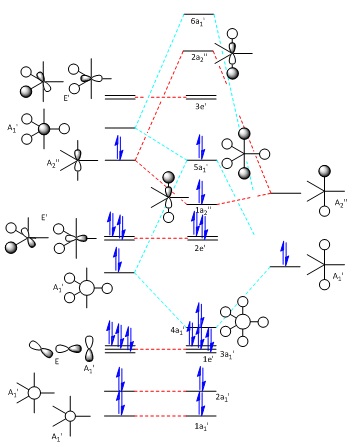 |
The construction of the final molecular orbital diagram for PH5 is largely assisted by the one drawn by R. Hoffmann, J. M. Howell, and E. L. Muetterties[20] with small editions involving the order of the molecular orbitals, being changed to account for the relative energy given by Gaussian upon calculation of the MOs. The need for two stages of diagrams is to account for the orbital mixing which causes the final 5a1' orbital to end up how it does.

These MOs generated from LCAO can also be matched up to the computer generated ones.
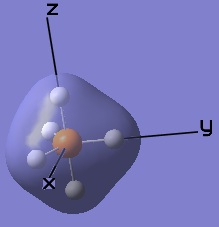 | 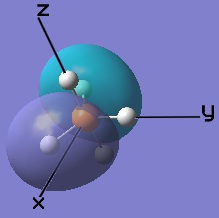 |
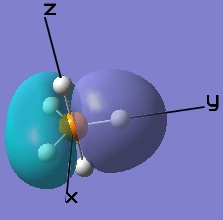 |  |
 | |
Molecular Orbital Theory versus Valence Bond Theory
One strength that the hydridisation viewpoint of valence bond theory has over molecular orbital theory, in this case, is that it accounts for d-participation in the bonding orbitals in this compound. It is known that hypervalence can only be achieved in compounds that have access to d-orbitals, and whilst valence bond theory can account for this (not to mention the results suggest d-character in the bonding orbitals), the molecular orbital diagrams (to the extent at which they're drawn) suggest no particular d-orbital activity in the bonding character of the molecule. It may be possible that d-orbitals of the correct symmetry may be able to mix with some of the molecular orbitals, though for the outlook taken on PH3 and PH5 in this experiment, valence bond theory is the only model capable of incorporating the expected d-orbital participation.
Frequency Analysis
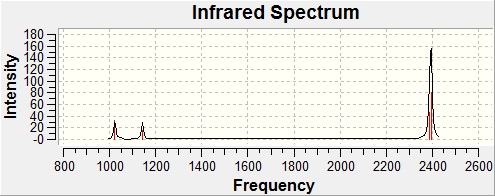
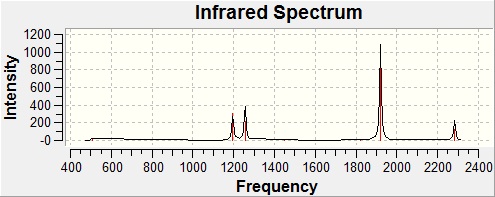
Since we are investigating the bond strength of the P-H bonds, vibrational frequency analysis will help to determine which of the two compounds in question has stronger P-H bonds. The frequencies of the vibrations for both compounds were calculated using the Imperial College SCAN service, after which they were analysed, with the primary goal of finding the P-H stretching vibrations.
 |  |
| Form of the Vibration | Frequency / cm-1 | Intensity |
| PH3 - Key Vibrations[25] | ||
 | 2387 | 46.3 |
 | 2395 | 79.8 |
 | 2395 | 29.8 |
| PH5 - Key Vibrations[26] | ||
 | 2281 | 0 |
 | 2284 | 121 |
 | 2284 | 121 |

It is worth noting that the large peak that appears in the PH5 spectra at 1920 cm-1 is due to a 'sawing' action of the axial hydrogens - a vibrational mode clearly unavailable to PH3. It has an intensity of 1088, dwarfing the sizes of the other peaks by comparison - but by absolute intensity, the other peaks correspond very well to their equivalents in PH3.
The three equatorial hydrogens of PH5 and the hydrogens of PH3 have almost identical vibrational modes, given that their symmetry is not the same - with the obvious difference that all of the peaks in PH3 occur at about 100 wavenumbers higher than those in PH5. There may be a minor contribution to this difference by the symmetry of the molecule and perhaps minor interactions with the axial hydrogen (whether by sterics or by orbital interactions of any kind) but the most likely cause for these bonds to form peaks at higher wavenumbers in PH3 (and hence vibrate at a higher frequency) is that they are a lot less labile than those in PH5, strongly supporting the arguement made in the abstract.
Conclusion
In the frequency analysis, vibrational modes with intensities as low as 0 (hence, forming absolutely no peak of any kind / the molecule does not vibrate to this degree of freedom) have been reported. They are still relevent since this section isn't about correlating with results that would be obtained empirically, but trying to predict the relative energies / strengths of the bonds involved, hence the only result here that matters significantly is the frequency - the intensity has just been reported to explain why there isn't in fact a peak at this intensity in the overall computed IR spectrum. This is one of the benefits of using computational chemistry over experimental results - if this were done as a practical experiment, an infrared spectrum without a peak in a certain place would tell nothing.
From both the molecular orbital theory and valence bond theory points of view (though for different reasons), along with the vibrational frequency calculations, we can justify with computational techniques that PH5 is, overall, a much less stable molecule than PH3.
References and Citations
- ↑ 1.0 1.1 SPECTRa Chemistry Repository, Geometry optimization of BH3, DOI:10042/to-5716
- ↑ P. J. Mohr, B. N. Taylor, D. B. Newell, Rev. Mod. Phys., 80, 633–730, 2008, DOI:10.1103/RevModPhys.80.633
- ↑ 3.0 3.1 Peter Atkins & Julio de Paula, Atkins' Physical Chemistry (8th Edition) page 362, Oxford University Press, 2006 Cite error: Invalid
<ref>tag; name "Atkins" defined multiple times with different content - ↑ SPECTRa Chemistry Respository, Molecular Orbital Calculation of Borane, DOI:10042/to-5788
- ↑ SPECTRa Chemistry Respository, Frequency Calculation for BH3, DOI:10042/to-5791
- ↑ SPECTRa Chemistry Repository, Geometry optimization of TlBr3, DOI:10042/to-5715
- ↑ J. Blixt, J. Glaser, J. Mink, I. Persson, P. Persson, M. Sandstroem, J. Am. Chem. Soc., 1995, 117 (18), pp 5089–5104, DOI:10.1021/ja00123a011
- ↑ SPECTRa Chemistry Respository, Frequency Calculation for TlBr3, DOI:10042/to-5799
- ↑ 9.0 9.1 SPECTRa Chemistry Respository, Cis-Molybdenum Complex Optimization, DOI:10042/to-5801 Cite error: Invalid
<ref>tag; name "MoCisOpt" defined multiple times with different content - ↑ 10.0 10.1 SPECTRa Chemistry Respository, Trans-Molybdenum Complex Optimization, DOI:10042/to-5802 Cite error: Invalid
<ref>tag; name "MoTransOpt" defined multiple times with different content - ↑ SPECTRa Chemistry Respository, Cis-Molybdenum Complex Re-optimization, DOI:10042/to-5816
- ↑ SPECTRa Chemistry Respository, Trans-Molybdenum Complex Re-optimization, DOI:10042/to-5818
- ↑ SPECTRa Chemistry Respository, Trans-Molybdenum Complex Optimization 3, DOI:10042/to-5830
- ↑ SPECTRa Chemistry Respository, Trans-Molybdenum Complex Optimization 3, DOI:10042/to-5831
- ↑ 15.0 15.1 15.2 15.3 15.4 F. A. Cotton, D. J. Darensbourg, S. Klein, B. W. S. Kolthammer, Inorg. Chem., 1982, 21 (1), pp 294–299, DOI:10.1021/ic00131a055 Cite error: Invalid
<ref>tag; name "FACotton" defined multiple times with different content - ↑ 16.0 16.1 16.2 G. Hogarth, T, Norman, Inorganica Chimica Acta, 254 (1), 167-171, 1997, DOI:10.1016/S0020-1693(96)05133-X Cite error: Invalid
<ref>tag; name "GHogarth" defined multiple times with different content - ↑ SPECTRa Chemistry Respository, Frequency Calculations for the Cis- Molybdenum Complex, DOI:10042/to-5872
- ↑ 18.0 18.1 F. A. Cotton, Inorg. Chem., 1964, 3 (5), pp 702–711, DOI:10.1021/ic50015a024 Cite error: Invalid
<ref>tag; name "FACotton2" defined multiple times with different content - ↑ SPECTRa Chemistry Respository, Frequency Calculations for the Trans- Molybdenum Complex, DOI:10042/to-5875
- ↑ 20.0 20.1 20.2 20.3 R. Hoffmann, J. M. Howell, E. L. Muetterties, J. Am. Chem. Soc., 1972, 94 (9), pp 3047–3058, DOI:10.1021/ja00764a028 Cite error: Invalid
<ref>tag; name "RHoffmann" defined multiple times with different content - ↑ SPECTRa Chemistry Repository, Optimisation of PH3, DOI:10042/to-5973
- ↑ SPECTRa Chemistry Repository, Optimisation of PH5, DOI:10042/to-5974
- ↑ SPECTRa Chemistry Repository, Natural Bonding Orbital / Molecular Orbital Analysis of PH3, DOI:10042/to-5975
- ↑ SPECTRa Chemistry Repository, Natural Bonding Orbital / Molecular Orbital Analysis of PH5, DOI:10042/to-5975
- ↑ SPECTRa Chemistry Repository, Frequency Calculation for PH3, DOI:10042/to-5977
- ↑ SPECTRa Chemistry Repository, Frequency Calculation for PH3, DOI:10042/to-5978


