
Rep:Mod:Cab14
Transition States Coursework
Introduction
In this invesigation, three experiments were studied, using gaussian, to determine the relavent MOs to the reaction, the tranisiton states of the reaction and which stereoisomer was most energetically favourable with respect to free energy. Gaussian uses potential energy surfaces to determine the minimum energy, frequency and vibrations of an input molcule or molecules.
A potential energy surface is the graph produced when the energy of every geometry of a molecule is plotted, and restricted to three dimensions. On this surface there are many points with a zero gradient, which represent either a transition state or a local energy minimum. The minima are points on the surface that represent a low energy geometry for the molecule and are identified by the fact that the energy of structures increases in all directions around them. The transition structure points can be identified by the fact that energy decreases in at least one direction, and this represents the reaction path towards and away from this transition state.
A frequency calculation calculates the force constants for each bond using the following equations:
If all of the calculated frequencies and vibrations are real then the stationary point is a minimum. If one imaginary then this is the transition state, and the stationary point is a saddle point.
Nf710 (talk) 13:02, 8 December 2016 (UTC) Nice intro, good understanding of determining TSs, some understanding of the theory would have been good here
Nf710 (talk) 13:08, 8 December 2016 (UTC) The MO to the left the HOMO -1 should be lower in energy it looks like it might interact in the way you have drawn it.
Experiment One
 |
 |
Experiment one was the optimisation of the Diels-Alder Reaction between ethene and butadiene, which follows the mechanism shown in Figure 1.
According to the Frontier Orbital Theory, the chemistry of π conjugated systems is dominatied by the HOMO and LUMO of the reactant molecules. The MO diagram for the product formed is shown in Figure 2. It shows the HOMOs and LUMOs of each reactant and their interaction to form MO's, which occurs because the AOs are of the same symmetry. Orbital interactions where the two AOs are of the same symmetry (i.e. Symmetric- Symmetric and Antisymmetric - Antisymmetric) have a non-zero overlap integral, so can form an MO, but Symmetric-Antisymmetric ineractions have a zero overlap integral so no MO can form. The AOs that can't interact with each other remain at the same energy levels.
Below is a table showing the images of the MOs calculated during the experiment, alongside a diagram of the theoretical MO they correspond to.
The reaction is electron inverse demand because in the HOMO the dieneophile AOs contribute more to the MOs, as seen in Figure 13, in the LUMO the diene is the more dominant MO and provides more electrons, as shown in Figure 15.
| HOMO | LUMO | |||
|---|---|---|---|---|
| Ethene |  |
 |
 |
 |
| Butadiene | 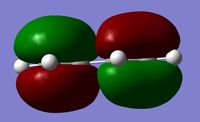 |
 |
 |
 |
| Calculated MO | MO from Diagram ! | ||
|---|---|---|---|
 |
 |
 |
 |
 |
 |
 |
 |
The C-C bond lengths were calculated as the reaction progressed, as shown below in Figure 19.
| Bond | Length/Distance in Reactants (Å) | Length/Distance in Transition State (Å) | Length in Product (Å) |
|---|---|---|---|
| 1 | 1.35520 | 1.40869 | 1.53796 |
| 2 | 2.11507 | 2.02503 | 1.53606 |
| 3 | 1.35520 | 1.38489 | 1.49268 |
| 4 | 1.54000 | 1.42353 | 1.33314 |
| 5 | 1.35520 | 1.38407 | 1.49268 |
| 6 | 2.09000 | 2.02423 | 1.53607 |

It can be seen that as the reaction progresses the dienophile bond extends, from around the average length of an sp2 hybridised C-C bond, 1.3552 Å compared to 1.353 Å[1] <refname= bond/>, towards the typical length of a sp3 C-C single bond (1.53796 Å compared to 1.523 Å<refname= bond/>), as it loses its double bond character. The diene double bonds also move from the typical sp2-sp2 double bond length of 1.353 Å <refname= bond/> towards the typical single bond length with one sp3 hybridised and one sp2 hybridised carbon of 1.503 Å [2](1.49268 Å for both bonds) . The single bond in the diene shortens as the reaction progresses, a change from 1.54 Å to 1.33314 Å which is similar to the literature values for sp2 single and double bonds of 1.439 Å <refname= bond/> and 1.342 Å <refname= bond/>. The most interesting bonds are 5 & 6, the bonds that form during the reaction. Initially they are longer than the Van-der-Waals radius of carbon, which is 1.7 Å [3]. In the transition state they are shorter, but still longer than a single sp3-sp3 C-C bond which is around 1.523 Å <refname= bond/>. In the product the single bonds have fully formed, with lengths of 1.53606 Å and 1.53607 Å respectively.
Figure 21 corresponds to the vibration at the transition state of the reaction, with the carbon atoms that form the new bonds moving towards each other and the dieneophile bond increasing in length and losing its double bond character. Figure 22 shows the lowest frequency vibration of the transition state, which involves the twisting of Ethene around the axis shown.
Figures 23 shows the IRC animation of the reaction, and as you can see the new bonds form synchronously, which you would expect from two symmetrical reactants that are taking part in a concerted reaction.
The reaction coordinate is shown in figure 24.


Experiment Two
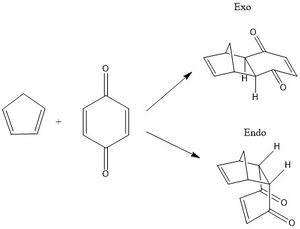
In reaction 2 Benzoquinine and Cyclopentadiene undergo a Diels-Alder Reaction as shown in the reaction scheme, Figure 25. The reaction can follow two possible paths, with exo and endo stereochemistry, forming two different products.
| Homo | Lumo | Transition State vibration | |||||
|---|---|---|---|---|---|---|---|
| Endo | |||||||
| Exo | Figure 30 - Exo Transition State LUMO | |
(You've loaded the wrong file for the exo TS LUMO, but it's accessible in the file for the HOMO Tam10 (talk) 14:20, 22 November 2016 (UTC))
This reaction is normal electron demand, as in the HOMO the diene AO is larger and therefore contributes more to each MO in the transition state, as seen in Figures 26 and 29. By contrast in the LUMO the dienophile is more dominant and supplies more electrons, as shown in Figures 27 and 30.
The overall reaction energy and reaction barrier can be calculated from the calculated Gibbs free energies, shown in Figure 32. Also shown are the reaction profiles for both reactions in Figures 33 and 34. The data shows that the endo product has a lower energy transition state ( 469.8 kJ/mol compared to 478.92 kJ/mol) and higher energy product ( 282.35 kJ/mol compared to 275.73 kJ/mol), eaning it os kinetically more stable. The exo product is the thermodynamic product. The main reason for the endo products increased stability is the favourable secondary orbital interactions between the p-orbitals of the electron withdrawing oxygens of the dienophile and the developing double bond. These can be seen in the endo HOMO as shown in figure 35. The interactions cause the endo reactants to have greater 'dipole induction energies'[4] as they approach each other, leading to a faster forming transition state meaning the endo product is kinetically favoured. In the exo transition state the devloping double bond and the oxygen p-orbitals are too far apart to interact favourably.
| Reactants kJ/mol | Transition State kJ/mol | Products kJ/mol | Reaction Energy kJ/mol | Reaction Barrier kJ/mol | |
|---|---|---|---|---|---|
| Exo | 335.64 | 478.92 | 275.73 | -59.91 | 143.28 |
| Endo | 335.86 | 469.78 | 282.35 | -73.51 | 113.92 |


Nf710 (talk) 14:00, 8 December 2016 (UTC) You havent stated here what level of theory you are suing, you are using PM6 and you should be using B3LYP really as it is a better approximation.
Experiment Three
Experiment 3 examined 3 different reactions between SO2 and Xylylene as shown in the reaction scheme, Figure 36. A cheleotropic reaction is an alternative form of cycloaddition reaction which is characterised by the formation of two new bonds to a single atom.

(In the curly arrow notation, the arrow should be coming from the S in the cheletropic reaction Tam10 (talk) 14:20, 22 November 2016 (UTC))
The reaction coordinate and IRC animations of each reaction are shown below. Xylylene is highly unstable and this can be seen in the IRC animations, as the reaction progresses the double bonds in the 6-membered ring become elongated and the single ones become shorter until the ring gains aromaticity and the bonds become similar in length.
| Exo | Endo | Cheleotropic | |
|---|---|---|---|
| Reaction Coordinate |  |
 |
 |
| IRC Animation |  |
 |
 |
From these calculations the following free energies were obtained, and the Reaction Energy and Barrier calculated for each reaction and shown in Figure 43.
| Reactants kJ/mol | Transition State kJ/mol | Products kJ/mol | Reaction Energy kJ/mol | Reaction Barrier kJ/mol | |
|---|---|---|---|---|---|
| Endo | 203.074564 | 237.7548 | 13.6201 | - 189.4545 | 34.68023 |
| Exo | 203.599664 | 241.7482 | 13.59311 | - 190.0066 | 38.148536 |
| Cheleotropic | 203.270533 | 260.0873 | 4.647135 | - 198.6234 | 56.81677 |
(How were the reactant energies calculated? Their energies seem too high Tam10 (talk) 14:20, 22 November 2016 (UTC))
The above calculations are summarized in the 3 reaction profile diagram shown below, Figure 44. It shows that although the cheleotropic reaction has a higher energy transition state, it has lower energy products and is therefore the thermodynamic product. The Diels-Alder product will be formed faster due to the fact it has a much lower transition state energy, however the products formed are higher in energy. The endo reaction is slightly kinetically favored over the exo due to the secondary orbital interactions of the pi systems, however because of the SO2 molecule being relatively small they do not make the endo product significantly more stable. The reaction is also very energetically favored in all cases, with large negative reaction energies in all cases, which is caused by the stabilization of the previously unstable Xylylene through the formation of an aromatic ring.

Conclusions
In conclusion, Gaussian and potential surface calculations were successfully used to determine the outcome of all three experiments. In experiment 1 the MOs of ethene and butadiene were analysed and it was demonstrated that the reaction was an inverse electron demand Diels-Alder as the HOMO is dominated by the butadiene AOs and the LUMO by thee ethene ones. It was also shown that in this reaction the formation of new bonds is synchronous. In Experiment Two the Exo and Endo Diels-Alder reactions of Benzoquinine and Cyclopentadiene were compared, and the gibbs free energies compared. It was determined that…. FILL IN
In Experiment 3 the reaction between SO2 and Xylylene was investigated. The gibbs free energies of the reactants, products and transition states were compared and showed that the Cheleotropic reaction path was the thermodynamic reaction path, with a higher energy transition state at 260.1 kJ/mol compared to the Diels-Alder transition state and lower energy products. The in reaction energies for the Endo and Exo Diels-Alder Reactions was very small, however the endo transition state was slightly lower in energy than the exo one ( 237.8 kJ/mol compared to 241.7 kJ/mol) and the product was slightly higher in energy than the exo one (13.62 kJ/mol compared to 13.59 kJ/mol). This effect was due to the favourable secondary orbital interactions between the S=O pi orbitals and the forming aromatic ring in the endo product.
Log Files
Experiment 1:
File:CAB14 EX1 DIENE MINIMUM.LOG File:CAB14 EX1 DIENEOPHILE MINIMUM.LOG File:CAB14 EX1 TS.LOG File:CAB14 EX1 PRODUCT MINIMUM.LOG
Experiment 2:
File:CAB14 EX2 ENDO PRODUCTS.LOG File:CAB14 EX2 ENDO REACTANTS.LOG File:CAB14 EX2 IRC ENDO.LOG File:631G TS EXO MINIMUM TAKE 3.LOG File:CAB14 EX2 631G EXO PRODUCT FRQ 2.LOG File:EXO IRC WITH OPT 2.LOG Experiment 3:
File:CAB14 EX3 EXO TS.LOG File:CAB14 EX3 EXO PRODUCT FRQ.LOG File:CAB14 EX2 EXO REACTANT FREQUENCY.LOG File:CAB14 EX3 EXO IRC.LOG File:CAB14 EX3 ENDO REACTANTS MINIMISATION.LOG File:CAB14 EX3 ENDO PRODUCT FREQUENCY.LOG File:CAB14 EX3 ENDO IRC.LOG File:CAB14 EX3 ENDO TS.LOG File:CAB14 EX3 CHELETROPIC TS.LOG File:CAB14 EX3 CHELETROPIC REACTANTS FREQ.LOG File:CAB14 EX3 CHELETROPIC PRODUCT FREQUENCY 3.LOG File:CAB14 EX3 CHELETROPIC IRC TAKE 2.LOG
References
- ↑ Wassermann A. 360. The mechanism of additions to double bonds. Part II. The steric course of two diene syntheses. Journal of the Chemical Society (Resumed). 1935:1511-4.
- ↑ Wassermann A. 360. The mechanism of additions to double bonds. Part II. The steric course of two diene syntheses. Journal of the Chemical Society (Resumed). 1935:1511-4.
- ↑ Rowland RS, Taylor R (1996). "Intermolecular nonbonded contact distances in organic crystal structures: comparison with distances expected from van der Waals radii". J. Phys. Chem. 100 (18): 7384–7391. doi:10.1021/jp953141.
- ↑ F. Monnat, P. Vogel, J.A. Sordo, HCA, 2002, 85(3), 1522-2675, 10.1002/1522-2675(200203)85:3<712::AID-HLCA712>3.0.CO;2-5