Rep:Mod:CSWmodule3
Module 3
In this report, transition structures in relatively large organic molecules will be calculated. As in previous reports, molecular mechanics or force field methods that work well for structure determination cannot be used (in general) as they do not describe bonds being made and broken, and changes in bonding type / electron distribution. Molecular orbital-based methods will be used by numerically solving the Schrodinger equation, and locating transition structures based on the local shape of a potential energy surface. As well as showing what transition structures look like, reaction paths and barrier heights can also be calculated.
The Cope Rearrangement (Tutorial)
In this tutorial the Cope rearrangement of 1,5-hexadiene will be analysed as an example of how to study a chemical reactivity problem.
The low-energy minima and transition structures on the C6H10 potential energy surface will be found in order to determine the preferred reaction mechanism.
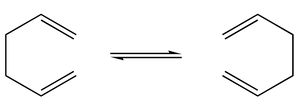
This [3,3]-sigmatropic shift rearrangement proceeds via the lowest energy transition structure. This tutorial will show how the energies of the transition states can be calculated using Gaussian.
Optimizing the Reactants and Products
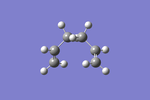
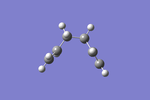
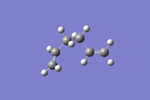
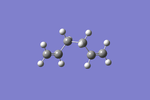
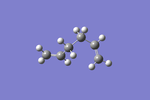
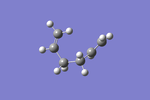
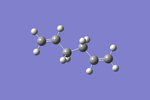
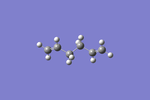
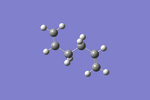
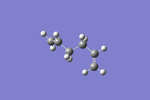
By drawing and optimising the geometries of the different isomers of 1,5-hexadiene, the following table of the isomer energies was constructed.
The isomers were drawn by adjusting the dihedral angles of the 4 central carbon atoms, and the calculations were run using the optimisation function at the HF/3-21G level of theory and the %mem option under the Link 0 tab was set to 250 MB.
The optimised geometries were published on D-space and can be found here: [5] [6] [7] [8] [9] [10] [11] [12] [13] [14]
| Conformer | Structure | Jmol | Point Group | Energy/Hartrees HF/3-21G |
Relative Energy/kcal/mol |
| gauche1 | C2 | -231.68772 | 3.10 | ||
| gauche2 | C2 | -231.69167 | 0.62 | ||
| gauche3 | C1 | -231.69266 | 0.00 | ||
| gauche4 | C2 | -231.69153 | 0.71 | ||
| gauche5 | C1 | -231.68962 | 1.91 | ||
| gauche6 | C1 | -231.68916 | 2.20 | ||
| anti1 | C2 | -231.69260 | 0.04 | ||
| anti2 | Ci | -231.69254 | 0.08 | ||
| anti3 | C2h | -231.68907 | 2.25 | ||
| anti4 | C1 | -231.69097 | 1.06 |
From the tabulated table of isomer energies it can be seen that the Gauche 3 isomer is the most stable, with an energy of -231.69266 Hartrees.
Comparison of the structures with those in the table provided [15] shows that all the given isomers have been correctly found and the energies match to an accuracy of 0.000005 Hartrees.
The Ci anti 2 conformation of 1,5-hexadiene has been correctly optimised and the energy matches the one given in the table.
The anti 2 structure, along with the other 2 lowest energy structures, gauche 3 and anti 1 can be reoptimised using the B3LYP/6-31G* level. This uses a higher level of theory and is more accurate, and so structures that have very similar energies when optimised using the HF/3-21Glevel of theory can be refined to ensure the correct 'energy ordering' of isomers.
Comparisons of the final structures from the HF/3-21G calculations with that at the higher level of theory are shown below:
(The calculation results for the reoptimised structures can be viewed using the Chemical Repository, D-Space 312)
| Structure | Energy under HF/3-21G Optimisation (a.u) | Energy under B3LYP/6-31G* Optimisation (a.u) |
| Gauche 3 | -231.69266 | -234.60911 |
| Anti 1 | -231.69260 | -234.60492 |
| Anti 2 | -231.69254 | -234.61171 |
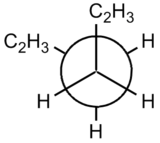
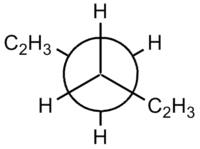
The reoptimised structures suggest that the Anti 2 isomer is actually the most energetically stable. This is more concurrent with what would be expected from chemical theory as the steric clashing associated with Gauche conformations means they are rarely the most energetically stable conformer.
 |  |
| Gauche | Anti |
The steric clashing of the two end groups can be more clearly shown using the Newman projections.
This highlights how Gaussian must be carefully used to collect chemical data, ensuring that accuracy levels are correctly defined. Too much accuracy could lead to unnecessarily long calculation times but too little accuracy can lead to inaccurate results. Computational data should always be 'sensed checked' with known theory.
The geometries of the HF/3-21G and B3LYP/6-31G* optimised molecules can be compared, as shown in the table below:
| Bond | Dihedral Angle HF/3-21G Optimisation (a.u) | Dihedral Angle B3LYP/6-31G* Optimisation (a.u) |
| Central C-C-C-C Bond | 180.00° | 180.00° |
| Central H-C-C-H Bond | 180°.00 | 180.00° |
| End C-C-C-C Bond | 114.6° | 118.55° |
This table shows that the main (central) anit-periplanar linkage is 180° for both structures. The difference in energy results instead from the differing angles of the end four carbons. This can be summarised by saying that although the energy difference between the two optimsied structures is significant with respect to how the reaction proceeds, the geometries are quite similar. This, again, highlights the importance of using the correct level of theory when performing optimisations, in order to achieve accurate results.
The final energies given in the output file represent the energy of the molecule on the bare potential energy surface. In order for these energies to be comparable with experimentally measured quantities, they need to include additional terms obtained by performing a frequency calculation. The frequency calculation can also be used to confirm that a minimum energy conformer has been found, by checking all vibrational frequencies are real and positive. The calculation was run and published to D-space: [16]
There are no imaginary (negative) frequencies, only real ones, and so the frequency calculation can be assumed to have run successfully. The IR spectrum is shown below:
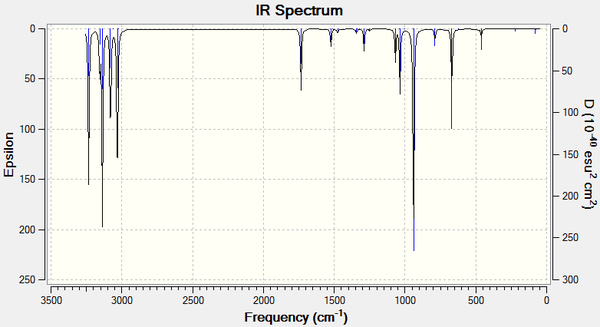
In the log file under the Thermochemistry and Vibrational Temperatures headings, a list of energies are printed.
- Sum of electronic and zero-point energies: -234.469203 a.u: Potential energy at 0 K including the zero-point vibrational energy (E = Eelec + ZPE)
- Sum of electronic and thermal energies: -234.461855 a.u: Energy at 298.15 K and 1 atm of pressure - includes contributions from the translational, rotational, and vibrational energy modes at this temperature (E = E + Evib + Erot + Etrans)
- Sum of electronic and thermal enthalpies: -234.460911 a.u: Contains additional correction for RT (H = E + RT) (Important when looking at dissociation reactions.)
- Sum of electronic and thermal free energies: -234.500780 a.u: Includes the entropic contribution to the free energy (G = H - TS)
These values show a breakdown of how the total energy of the molecule has been computed.
These corrections can also be calculated at other temperatures using the Freq=ReadIsotopes option in Gaussian. A table comparing the results from calculating these quantities at 0 K and 298K is shown below:
| Corrections | At 298K | At 0K | Difference |
| Sum of electronic and zero-point Energies | -234.469203 | -234.468765 | -0.000438 |
| Sum of electronic and thermal Energies | -234.461855 | -234.468765 | -0.00691 |
| Sum of electronic and thermal Enthalpies | -234.460911 | -234.468765 | -0.007854 |
| Sum of electronic and thermal Free Energies | -234.500780 | -234.468765 | -0.032015 |
The change in temperature leads to a small but observable lowering of the energy values, as shown in the table above.
Optimizing the "Chair" and "Boat" Transition Structures
The transition structure optimisation for the 'chair' and 'boat' structures will be set up in this section.
It is possible to set up a transition structure optimization using a number of methods. In this tutorial, the frozen coordinated method the QST2 method will be used.
It will also be possible to visualise the reaction coordinate and run the IRC (Intrinisic Reaction Coordinate). And, in addition, calculate the activation energies for the Cope rearrangement via the "chair" and "boat" transition structures.
Firstly, an allyl fragment (CH2CHCH2) was drawn and the symmetry optimized using the HF/3-21G level of theory.
The molecule was copied and pasted twice into the new window by selecting Paste - Append Molecule. The two fragments were orientated so that they looked roughly like the chair transition state. The distance between the terminal ends of the allyl fragments were set to be approximately 2.2 Å apart.
The first way of optimising the transition structure requires a reasonable starting guess for the transition structure geometry. The force constant matrix is then computed in the first step of the reaction and updated as the optimisation proceedes.
The Hartree Fock and the default basis set 3-21G will be used for the following calculations.
The transition state structure was copied into a new window. A Gaussian 'Opt+Freq' calculation was set up with the following commands selected: Optimization to a TS (Berny), force constants Once and Additional keywords Opt=NoEigen.
The optimised structure is shown below:
|
The optimised structure was confirmed by viewing the imaginary frequency at 818 818 cm-1. The vibration can be viewed by clicking on the image below twice. The animation shows the imaginary frequency vibration in the region where the new bonds are expected to form. This helps to confirm that the transition structure optimisation has been successful.
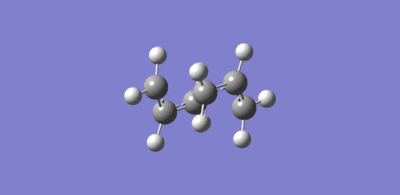
An alternative method, called the freeze coordinate method can be used when the guess structure for the transition structure is far from the exact structure. In this instance, the above approach may not work as the curvature of the surface may be significantly different at points far removed from the transition structure.
By freezing the reaction coordinate (using Opt=ModRedundant) and minimizing the rest of the molecule, a better transition structure can be obtained. Once the molecule is fully relaxed, the reaction coordinate can then be unfrozen and the transition state optimization is started again.
This method may mean that it's not necessary to calculate the whole Hessian, saving a significant amount of time.
The frozen coordinate method was employed in the following way. The transition state structure was pasted into a new window and the Redundant Coord Editor option was selected. The Create a New Coordinate option was chosen followed by Add Unidentified (?, ?, ?, ?). Two of the terminal carbons from the allyl fragments which form/break a bond during the rearrangement were selected and then in the coordinate editor Bond instead of Unidentified and Freeze Coordinate instead of Add options were selected. The same was done for the opposite two terminal atoms. The optimisation was then run using the Hartree Fock and the default basis set 3-21G.
The optimised molecule is shown below:
|
The optimised structure looks very similar the transition struture generated above, except here the bond forming/breaking distances have been fixed to 2.2 Å. These can also be optimsed by using the Redundant Coord Editor by selecting the bonds that were previously frozen and choosing Bond instead of Unidentified and Derivative instead of Add.
A transition state optimization was set up using a normal guess Hessian modified to include the information about the two coordinates that are being differentiating along.
The bond forming/bond breaking bond lengths can be compared the structure optimised above. See table below:
| Chair Transition Structure Opt Method | C-C bond forming/bond breaking internuclear distance |
| Initial Freq+Opt Calculation | 2.01940 |
| Frozen Coordinate Method | 2.01935 |
The data shows that the frozen coordinate methods leads to a bond length that is 0.00005Å shorter than the bond length calculated using the Frew+Opt calculation. The frozen coordinate has therefore been shown to be slightly more accurate.
The boat transition structure will now be optimised. This will be done using the alternative QST2 method.
It is possible to specify the reactants and products for a reaction and the calculation will interpolate between the two structures to try to find the transition state between them.
The boat transition structure will be optimised using the optimized Ci reactant molecule 'anti 2' from the table in part A. By selecting File → New → Add to MolGroup it is possible to read multiple geometries into GaussView. Two molecules can be viewed side by side so both molecules can be viewed simultaneously.
By selecting Atom List and starting from Atom 1 on the reactant, all the atoms on the product were renumbered so that they matched the reactant molecule in order to correctly represent the cope rearrangement.
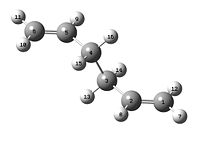 |  |
| Reactant | Product |
It was then possible to run the QST2 calculation. This was done by choosing the Gaussian Calculation Opt+Freq, and optimise to a transition state. Instead of selecting TS (Berny), TS (QST2) was chosen.
As anticipated, the job failed.
By opening the chk file is is possible to see that the structure looks a bit like the chair transition structure but more dissociated. The calculation linearly interpolated between the two structures (it simply translated the top allyl fragment but did not consider the possibility of a rotation around the central bonds). The failed optimisation structure is shown below:
|
It was necessary to modify the reactant and product geometries so that they were closer to the boat transition structure. This was done by selecting the central C-C-C-C dihedral angle and changing it to 0o. The inside C-C-C bonds were also reduced, to 100o.
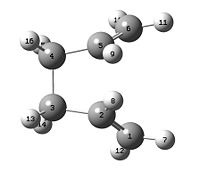 |  |
| Reactant | Product |
The QST2 calculation was set up again, and the job was re-run. The structure converged to the boat transition structure. The success of the optimisation was checked by ensuring that there was only one imaginary frequency. This frequency was found as -840.03cm-1 and can be visualised below (click image twice to view the vibration). As before, the imaginary vibration shows where the new bonds are expected to form:
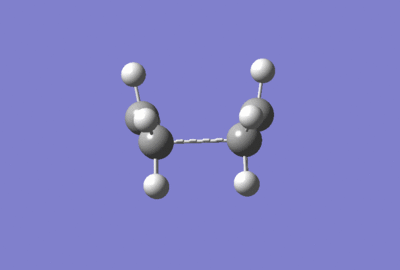
Although the QST2 method is has some advantages because it is fully automated, it can often fail if the reactants and products are not close to the transition structure.
IRC
It is not easy to predict which conformer the reaction paths from the transitions structures will lead to. However, a method in Gaussian allows the minimum energy path from the transition structure down to the local minimum on a potential energy surface to be followed. This is done using the Intrinisic Reaction Coordinate (IRC) method. It creates a number of points by taking small geometry steps in the direction where the gradient or slope of the energy surface is steepest.
The IRC was firstly performed for the chair conformational:
The Gaussian calculation option, IRC under the Job Type tab was chosen. Since the reaction coordinate is symmetrical, it was only computed it in the forward direction. In addition, the the force constants were set to be calculated at every step along the IRC, and the number of points along the IRC was set to 50.
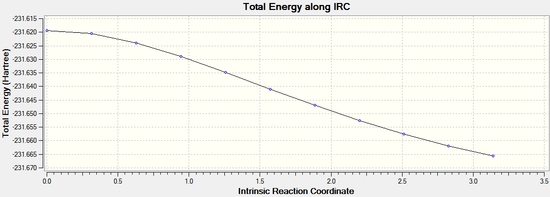
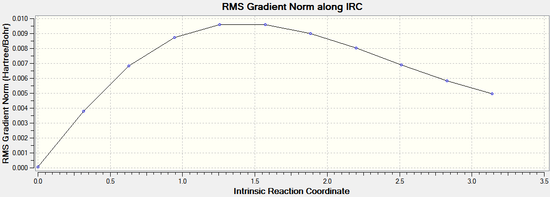
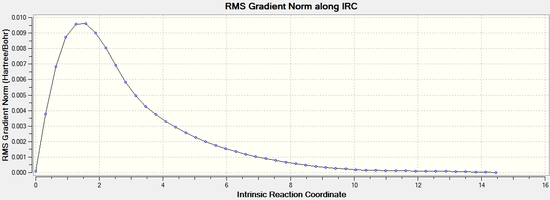
By opening the chk file with all the intermediate geometries it is possible to see how the calculation progressed. The graphs depicting the total energy along the IRC and the RMS gradient along the IRC clearly show that a minimum geometry has not yet been reached:
 |  |
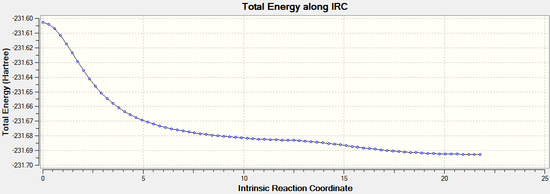
The IRC calculation was then repeated by redoing the IRC and specifying that force constants should be computed at every step. This time it can be seen that the minimum geometry has been found. The minimum energy was found to be -231.69167 Hartrees. It can be noted that this the same energy as the gauche 2 conformer found in part A:
 |  |
The IRC was then performed for the boat transition structure by specifying that force constants should be computed at every step. . It can be seen from the results below that the minimum energy geometry has been found here too. The energy -231.69265 Hartrees which is most similar to the gauche 3 conformation found above.
 | 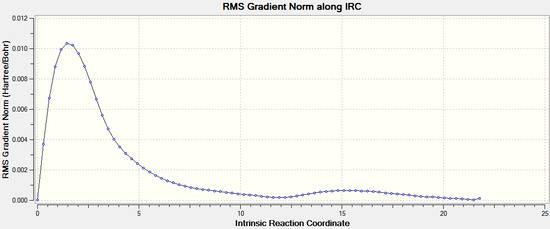 |
Activation Energies
The final step is to calculate the activation energies for the reaction via both transition structures.
This is done by reoptimising the chair and boat transition structures using the B3LYP/6-31G* level of theory and carrying out frequency calculations.
Comparisons of both the geometries and the difference in energies between the reactants and transition states at the two levels of theory are shown below. It can be seen that the geometries are reasonably similar, but the energy differences are quite different.
The files used for the following analysis were published to D-space: 3-21G 6-31G 321G 631G
At 0K
| Energy | Chair HF 3-21G | Boat HF 3-21G | Chair DFT/B3LYP 6-31G* | Boat DFT/B3LYP 6-31G* |
| Transition State Energy (Hartrees) | -231.61932 | -231.60280 | -234.55933 | -234.69391 |
| Energy Anti 2 (Hartrees) | -231.69254 | -231.69254 | -234.61171 | -234.61171 |
| Activation Energy (Hartrees) | 0.07322 | 0.08974 | 0.05238 | 0.0812 |
| Activation Energy (Kcal/mol) | 45.95 | 56.31 | 32.87 | 50.95 |
At 298K
| Energy | Chair HF 3-21G | Boat HF 3-21G | Chair DFT/B3LYP 6-31G* | Boat DFT/B3LYP 6-31G* |
| Transition State Energy (Hartrees) | -231.46622 | -231.45046 | -234.35811 | -234.61068 |
| Energy Anti 2 (Hartrees) | -231.53960 | -231.53960 | -234.461856 | -234.461856 |
| Activation Energy (Hartrees) | 0.08896 | 0.08974 | 0.1037 | 0.10488 |
| Activation Energy (Kcal/mol) | 55.82 | 56.31 | 65.07 | 65.80 |
At 0K, an example .log file is shown below:
 Zero-point correction=                           0.153106 (Hartree/Particle)
 Thermal correction to Energy=                    0.153106
 Thermal correction to Enthalpy=                  0.153106
 Thermal correction to Gibbs Free Energy=         0.153106
 Sum of electronic and zero-point Energies=           -231.466215
 Sum of electronic and thermal Energies=              -231.466215
 Sum of electronic and thermal Enthalpies=            -231.466215
 Sum of electronic and thermal Free Energies=         -231.466215
As seen above, all energies are the same. This is a result of the temperature being 0K and so all electronic and thermal energies being minimised.
The experimental activation energies are 33.5 ± 0.5 kcal/mol via the chair transition structure and 44.7 ± 2.0 kcal/mol via the boat transition structure at 0 K. The values calculated here are comparable to the experimental values.
Conclusion
This section shows the optimised chair and boat transition states for the cope rearrangement. By using IRC the reaction coordinate has been viewed. And by activation energy calculations, the is has been shown that the chair transition state has a lower activation energy than the boat.
The Diels Alder Cycloaddition
In this section the transition structures formed during Diels Alder reactions will be computed and analysed using the same methods as in the sections above. The shapes of the molecular orbitals will also be analysed.
The Diels Alder reaction is a pericyclic reaction. The π orbitals of a dieneophile are used to form new σ bonds with the π orbitals of a diene. Usually, the HOMO/LUMO of one fragment interacts with the HOMO/LUMO of the other fragment in order to form two new bonding and anti-bonding MOs.
The nature of the transition structure for the Diels Alder reaction will be considered for the most basic Diels-Alder reaction and also for a case where both diene and dieneophile have substituents (where secondary orbital effects are possible). The transition state properties are determined by quantum mechanics and so the calculations used will employ quantum mechanical analysis.
Analysis
For the following analysis, the AM1 semi-empirical molecular orbital method was used.
The HOMO and LUMO orbitals of cis butadiene and ethene, along with the symmetry with respect to plane, are shown below:
| Molecuke | HOMO | LUMO |
| Cis-butadiene | 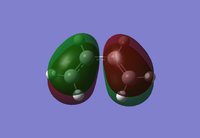 | 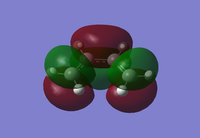 |
| Ethene |  | 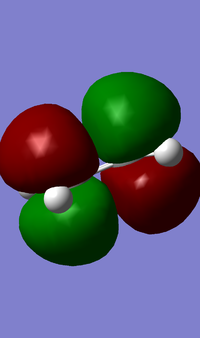 |
From the MO diagrams, it can be seen that the cis-butadiene HOMO is antisymmetric and the cis-butadiene LUMO is symmetric (where teh place intersects the central C-C bond.) The HOMO of ethene and the LUMO of cis-butadiene are of the same symmetry, as is the LUMO of ethene and the HOMO of cis-butadiene. The match in symmetry suggests that aslong as the orbital overlap is good then the Diels-Alder reaction should proceed.
The Transition State geometry for the 'prototype reaction' was computed so that the nature of the reaction path could be determined.
The 'frozen coordinates' method used above was employed in order to generate the transition structure, where the carbon atoms forming the new bonds were positioned 2.2Å apart. The AM1 semi-empirical molecular orbital method was used. The generation of the transition structure was confirmed by viewing the imaginary frequency at -955.90cm-1. (Click image to view the imaginary frequency)
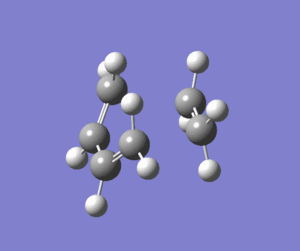
The animation clearly shows where the bonds of the product are forming. The sp2 centres of the reactants are hybridizing to sp3 centres, moving from a trigonal planar geometry towards a tetrahedral one. The annimation also shows the shortening of the central C-C bond in cis-butadiene, as it is transformed from a single to a double bond.
The HOMO and LUMO are shown below:
| HOMO | 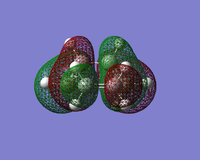 | 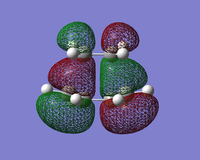 | 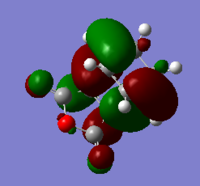 |
| LUMO | 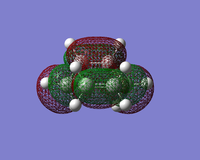 | 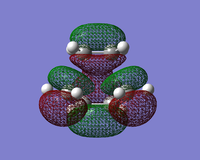 | 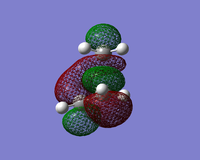 |
The symmetry and nodal properties of the system can be seen here. The molecular orbitals clearly show the overlapping atomic orbitals. The transition state HOMO shows the overlapping cyclobutadiene HOMO orbitals and ethene LUMO orbitals. These are both antisymmetric and the overlap is what would be expected from looking at the initial atomic orbitals.
The LUMO shows an area of 'virtual electron density' where the product bond is expected to form. This results from the dieneophile drawing electron density towards itself from the diene as the reaction progresses. This depicts the donation of the π orbital of ethene into the π* orbital of cis-butadiene.
The transtion state bond lengths can be compared to the literature value bond lengths:
| Bond | Computed Bond Length | Literature Bond Length |
| Partially Formed σ C-C | 2.11928 Å | 1.54 Å [3] |
It is clear that the inter-fragment bond is much shorter than expected for a normal sp3 hybridized C-C bond length. This shows how the transition state geometry is a structure depicting the forming bonds, as would be expected.
The selectivity of the Diels Alder Reaction can also be considered using transition structure analysis
Cyclohexa-1,3-diene raects with maleic anhydride to give primarily the endo (as opposed to exo) product. Since the reaction is meant to be under kinetic control, the exo transition state should be higher in energy. Computational analysis of the transition states can be used to check this hypothesis.
The transition structures for both endo and exo forms were computed using the AM1 semi-empirical molecular orbital method and the frozen coordinate method. The results can be viewed below:
|
|
Frequency Analysis
To confirm that the transition structures had found, frequency analysis was used to depict the imaginary frequencies arsing due to the intermediate bonds. The exo imaginary frequency was at -812.19cm-1 and the endo imaginary frequency was -806.38cm-1. These are shown below, and the animations for the exo and endo transition states can be viewed by clicking on the images.
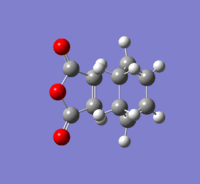 | 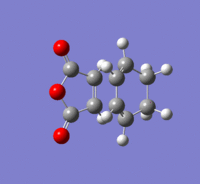 |
The formation of the two bonds can be seen to be synchronous, which, given the reaction is known to be concerted is what would be expected.
The lowest positive frequencies show asynchronous bond formation at around 60cm-1 for both the endo and exo isomers. The energy is significantly higher than the virtual frequencies calculated. This explains why the concerted Diels Alder reaction proceeds in favour of any other stepwise reaction.
IRC
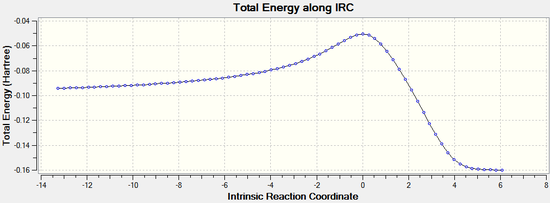
IRC analysis can be used to confirm that the transition states found above are the real transition states.
The IRC calculations were set to follow the path forwards only, to a maximum of 100 points, always calculating force constants.
Exo:
 | 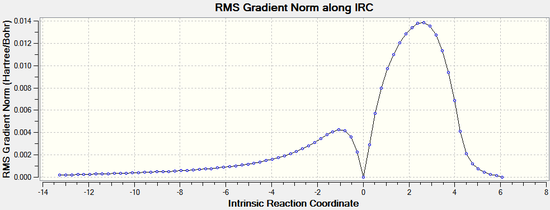 |
Endo:
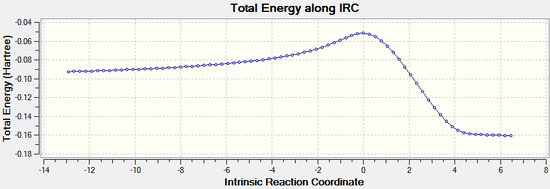 | 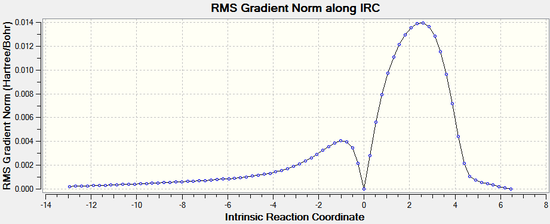 |
The IRC analysis clearly shows the transition states for both the endo and exo isomers. The peaks in the total energy graphs correspond to the transition states, when the molecules are highest in energy and in their most distorted conformation.
Therefore it can be concluded that the transition states have been correctly identified using the freeze coordinate method.
Bond Length Analysis
The bond lengths of the partly formed σ C-C bonds and the other C-C distances.
| Bond | Exo Bond Length | Endo Bond Length |
| Partially Formed σ C-C | 2.17038 Å | 2.16238 Å |
Literature values for similar transition state structures quote the partially forming σ C-C bond length to be in the region of 2 Å. [4] suggesting that the values computed here are a reasonable when compared to experimental values. It can be noted that lengths of 2Å are shorter than normal C-C sp3 σ bonds (1.54Å), but smaller than twice the Van De Waals radius ( 2 x 1.7Å [5]) of carbon suggesting that there is some degree of shared electron density between the orbitals. This is what would be expected from a transition state.
MO Analysis
The HOMO and LUMO orbital have been drawn and are shown below.
| Product | HOMO (top) | HOMO (side 1) | HOMO (side 2) | LUMO (top) | LUMO (side 1) | LUMO (side 2) |
| Endo |  |  |  |  |  |  |
| Exo |  |  |  |  |  |  |
Discussion
The HOMO MOs show that the bond formation occurs via overlap of HOMO π orbitals with the LUMO π orbitals of the other fragment. The HOMO orbitals of both the exo and endo transition structures are antisymmetric.
In contrast to the 'prototpe' Diels Alder reaction, the oxygen atoms can be seen to be assisting the formation of the new c-c σ bonds by delocalisation of Maleic Anhydride's central oxygen atom lone pairs towards the π orbitals of the 1,3-cyclohexadiene fragment (in addition to the C=C bond). This can be seen particularly clearly in the top view of the LUMO orbitals.
It may be postulated that larger groups cause steric hindrance and make the Diels-Alder reaction less favorable. However, as explained above, the existence of secondary orbital overlap from the oxygen lone pair, acutally makes the reaction more favorable. [6]
The relative energies of the exo and endo transition structures are given below:
The energy of the endo TS is: -0.051505 Hartrees
The energy of the exo TS is: -0.046961 Hartrees
The exo is higher in energy than the endo. From the HOMO orbitals, it can be seen that there is a much greater level of overlap between the 2 reactants forming the endo product than the 2 reactants forming the exo product. The exo form may be more constrained than the endo product in terms of ability of the orbitals to overlap and is hence not formed.
IRC analysis shows that the endo product is actually the most thermodynamically stable, confirming that the orbital effects in this reaction have a dominating influence and leads to the formation of the kinetic (endo product).
Conclusion
This module has shown how computational analysis can be used to rationalise the transition states, and hence reaction paths of molecules in a reaction. Often, quantum mechanical effects (or orbital effects) have a dominant role in determining the pathway of a reaction. Computational chemistry allows these effects to be quantified and rationalised.

