Rep:Mod:CN2209
Modelling Using Molecular Mechanics
Hydrogenation of a Cyclopentadiene Dimer
Dimerisation of Cyclopentadiene
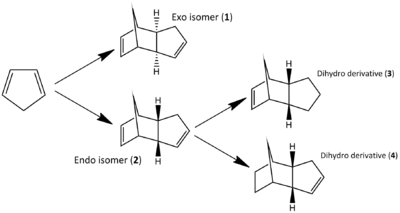
As any synthetic chemist may appreciate, handling cyclopentadiene can be somewhat troublesome. Stored at or above room temperature the monomer readily dimerises, rendering it useless. The dimerisation goes via a 4πs+2πs cycloaddition to form either an exo or endo isomer, set out in Figure 1. Through previous studies [1] it has been confirmed that the endo isomer is the preferred of the two and will form exclusively. To try and explain this observation, the two isomers can be modelled in ChemBio3D and MM2 force-field calculations carried out to assess their relative energies. The data obtained has been set out in Figure 2.
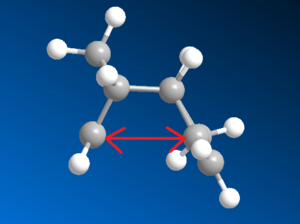
By comparing the data in Figure 2, specifically the total energies, one can conclude that the exo isomer is in fact the more stable molecule by 2.1 kcal/mol. Looking more closely at the data, the torsion values seem to give the greatest mismatch - the endo has a greater torsion by 1.85 kcal/mol. This could be argued is mostly due to repulsive 1,4 interactions destabilizing the overall molecule. These interactions are evidently more prevalent in the endo isomer (Figure 3).
| Exo isomer (1) | Endo isomer (2) | Dihydro derivative (3) | Dihydro derivative (4) | |
|---|---|---|---|---|
| Stretch | 1.29 | 1.25 | 1.25 | 1.10 |
| Bend | 20.6 | 20.9 | 19.2 | 14.5 |
| Stretch-Bend | -0.838 | -0.836 | -0.835 | -0.550 |
| Torsion | 7.66 | 9.51 | 11.1 | 12.5 |
| Non-1,4 VDW | -1.42 | -1.55 | -1.64 | -1.07 |
| 1,4 VDW | 4.23 | 4.32 | 5.80 | 4.51 |
| Dipole/Dipole | 0.378 | 0.448 | 0.162 | 0.141 |
| Total Energy | 31.9 | 34.0 | 35.0 | 31.2 |
Figure 2: MMR force-field calculated data for cyclopentadiene dimers and hydrogenated derivatives of the endo isomer
Despite the exo isomer being the more stable product, the endo isomer is preferred. This can be explained by the concept of kinetic and thermodynamic pathways. Under certain conditions reactions can be made reversible or irreversible. Clearly, in an irreversible reaction the fastest formed product will be preferred - once it has been formed it can't reconvert to starting reagents. This describes a reaction pathway under kinetic control, where the product formed fastest (the kinetic product) is preferred. The particular transition state of the kinetic product will be the more stable, or in other words the kinetic product has a lower activation energy barrier to its formation. On the other hand, a reaction pathway under thermodynamic control is reversible. Under these conditions, all competing processes are still occurring, but as they can be converted back to starting reagents the most stable product (the thermodynamic product) will form preferentially over time.
In the case of cyclopentadiene, the exo isomer is the more stable thermodynamic product. But since the endo product is produced, it can be concluded that the endo isomer is the faster forming kinetic product and the reaction itself is under kinetic control.
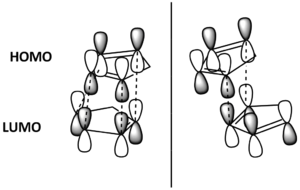
The question that now arises is why? Why does the endo isomer have the more stable transition state? This could be explained using Frontier Molecular Orbital Theory. For the two isomers to form, the cyclopentadienes must come into contact at differing geometries. These are shown in Figure 4. Also shown in the diagram are the HOMO-LUMO interactions that lead to formation of the dimer. It can be seen that the endo T.S. has twice as many bonding interactions between orbitals, so must be more stabilised. This leads to the endo product being formed the fastest.
Hydrogenation of Endo Isomer
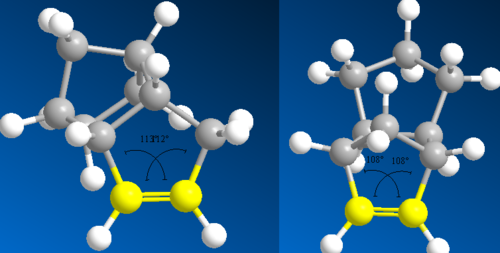
The endo isomer can then undergo hydrogenation to two more stereospecific dihydro derivatives, Figure 1. Once again there is the question of which is the more likely to form. The same process of modelling and computing MM2 calculations can be used to assess the problem. From the data in Figure 2, it can be seen that the dihydro derivative 4 is the more stable overall by 3.8 kcal/mol. Further analysis shows the 'bend' and 'torsion' strain components to be the most significant contributors to this energy difference. Dihydro derivative 4 has a bend component 4.7 kcal/mol less strained than its counterpart. To explain this the double bond angles in both derivatives can be calculated using ChemBio3D and compared. Carbons involved in double bonding are sp2 hybridized and therefore have an optimum bond angle of 120o. Deviation from this geometry will highlight which molecule will be the more strained and therefore less stable. Figure 5 displays the calculated angles and shows derivative 3 to be the most strained with a bond angle of 108o. This is in agreement with the conclusions already set out. From this it can be concluded that dihydro derivative 4 is the thermodynamically more stable product.
It cannot be concluded however which of the two derivatives has the more stable transition state and so forms the kinetic product. Further to this, it is not known whether the reaction is under thermodynamic or kinetic control. Analysis of the transition states, specifically the frontier molecular orbitals of the transition states might reveal which of the two is the kinetic product.
Stereochemistry and Reactivity of an Intermediate in the Synthesis of Taxol

The synthesis of cancer treatment drug Taxol involves a particular intermediate that is the subject of the next investigation. This molecule makes for an interesting application of molecular modelling mainly because it exhibits atropisomerism. Atropisomers are able to interconvert by rotation of a single bond, however this process is hindered, usually by sterics. A large enough energy barrier to rotation allows the isomers to be isolated. The two isomers of the taxol intermediate differ in the orientations of the carbonyl group, either pointing up (9) or down (10). It has been shown[2] that if allowed to stand, the initially formed isomer will eventually convert to its atropisomer, Figure 1.
| Stretch | 2.78 | 2.62 | 2.85 |
|---|---|---|---|
| Bend | 16.5 | 11.3 | 14.6 |
| Stretch-Bend | 0.430 | 0.344 | 0.615 |
| Torsion | 18.3 | 19.7 | 20.6 |
| Non-1,4 VDW | -1.56 | -2.16 | -1.82 |
| 1,4 VDW | 13.1 | 12.9 | 15.4 |
| Dipole/Dipole | -1.73 | -2.00 | -1.73 |
| Total Energy (MM2) | 47.8 | 42.7 | 50.6 |
| Total Energy (MMFF94) | 70.6 | 60.6 | 73.8 |
Figure 2: MM2 force-field calculated data for two possible isomers of Taxol intermediate and hydrogenated product of 10
From modelling both forms of the taxol intermediate, results shown above in Figure 2, it can be seen that 10 is more stable than 9 by 5.10 kcal/mol with regard to MM2 and 10.0 kcal/mol with regard to MMFF94. If one form isomerises to the other more stable form, the results conclude isomer 9 is the kinetic product and will, over time, convert to the more stable isomer 10. There is an obvious discretion between the results obtained for MM2 and MMFF94 calculations, MMFF94 predicts higher energies than MM2, but the results do seem to correlate in some way. This must be due to the two methods measuring different energy contributions and interactions. Perhaps MMFF94 takes into account more factors and so this is why a greater energy is given, this could also make MMFF94 a more accurate calculation. This is all very speculative, and the real picture would most likely be that the relative advantages of each method would differ from model to model and molecule to molecule.

The particular isomers modelled and analysed here are not the only possible isomers of the intermediate. The cyclohexyl ring has not been stereochemically defined and therefore both isomers could theoretically contain twist-boat conformations, as opposed to chair. Comparison of the energies of these isomers (twist-boat/chair) is unnecessary for this investigation though as twist-boat conformations are almost always more strained and therefore less stable than chair.
The results in Figure 2 also include MM2 and MMFF94 configured data for the hydrogenated form of the more stable intermediate 10, ie. where the alkene bond has been hydrogenated to a single bond. Although theoretically it is not sensible to compare energies of non-isomers, it is in this case acceptable as the energy of H2 is negligible. Both results indicate the alkane to be less stable, a rare case of the hyperstable olefin phenomenon - where an alkene is more stable than its parent alkane. This explains the obervation of the alkene reacting abnormally slowly [3].

The difference in energy between the two is fairly significant, -7.90 kcal/mol (a value for the olefinic strain energy). Comparison of the parameters set out in Figure 2 should indicate why. Both 1,4 and non-1,4 vdW components and the bend component give the greatest discrepancies. The most obvious structural feature that might affect the relative stabilities of each molecule is the bridgehead functionality. This restricts the geometry in such a way to give the bond angles presented in Figure 3. Assessing the deviations from ideal bond angles for alkanes (sp3) and alkenes(sp2), will highlight any instability. Figure 3 shows the saturated intermediate to have a bond angle at the bridgehead of 119o, around 10o greater than ideal, whereas the unsaturated only deviates from ideality by 3o. This explains, for the most part, the bend component energy difference.
The vdW repulsions can be identified when "close contacts" are displayed using ChemBio3D. As the images in Figure 4 show, there are 3 non-bonding interactions at a distance less than 2.1Å in the saturated intermediate. This is compared to just one in the unsaturated. This could be evidence for the larger vdW energy components observed in the hydrogenated - close contacts causing destabilising interactions. It is not completely clear though whether these interactions are even repulsive, there is a slight possibility that they are attractive.
Modelling Using Semi-Empirical Molecular Orbital Theory
Regioselective Addition of Dichlorocarbene
Part 1: Reactivity with Dichlorocarbene

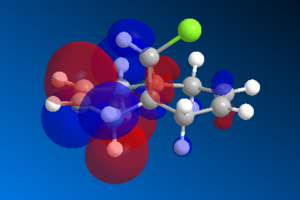
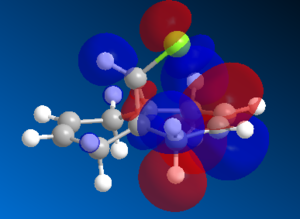
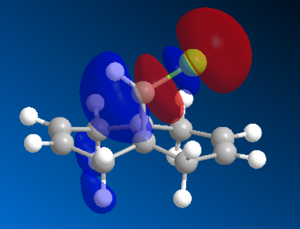
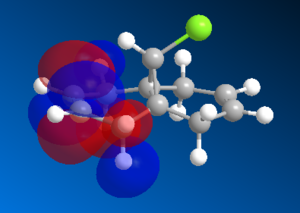
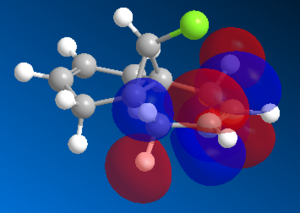
The highly electrophilic dichlorocarbene has been known to react regioselectively with compound 12 in a cycloaddition mechanism, shown in Figure 1. The regioselectivity noticeably refers to the two possible outcomes: attack of the double bond syn to chlorine or attack of the double bond anti to chlorine. By modelling compound 12 in ChemBio3D, and ensuring the geometry has been optimised, MOPAC/RM1 calculations can be performed to give a visual approximation of the most prominent molecular orbitals in this reaction, namely the HOMO-1, HOMO, LUMO, LUMO+1 and LUMO+2. This allows an assessment of which alkene bond is most likely to react and can also infer other aspects of the compound's reactivity.
| HOMO-1 | HOMO | LUMO | LUMO+1 | LUMO+2 |
|---|---|---|---|---|
Looking first at the HOMO, it can be seen that there is large amount of electron density on the C=C syn to C-Cl due to the pi bonding orbital of this bond. This would promote electrophilic attack by CCl2. Moving onto the HOMO-1, there is a large electron density from the π bonding orbitals of the C=C bond anti to C-Cl. Despite the two HOMOs being open to electrophilic attack, it would be much more likely for the MOs of CCl2 to overlap with the HOMO as it is higher in energy and therefore they would be better matched in terms of energy. The LUMO shows a large σ* anti-bonding orbital on the C-Cl, this would be capable of overlap with the HOMO-1 stabilising the C=C anti to C-Cl, making it even less likely to react (Figure 3). The LUMO+1 displays a large π* anti-bonding orbital on the C=C bond anti C-Cl, this would encourage nucleophilic attack at the anti C=C, further reducing the likelihood of CCl2 attacking at this position. All of these observations lead to the conclusion that C=C syn to C-Cl will react with dichlorocarbene and give the resulting molecule shown in Figure 1.
Part 2
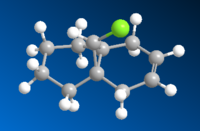
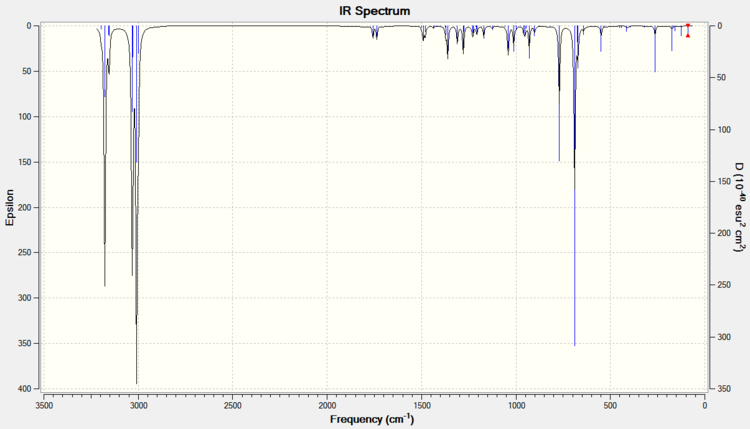
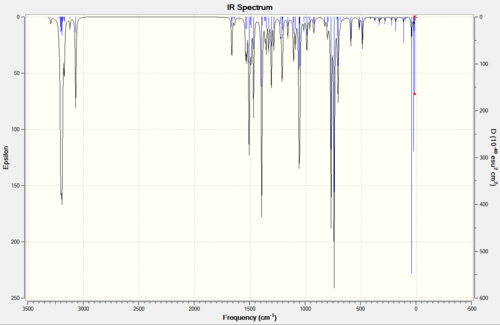
Building on these findings, an investigation can be made into the influence of the C-Cl bond on the vibrational frequencies of the molecule, specifically those of the double bonds. Can the bonds be told apart by spectroscopic means and how does the C-Cl have this affect? To start rationalising these ideas, it is possible to computationally predict or calculate vibration frequencies. This is done by pre-optimising, subjecting the model to further B3LYP/6-31G(d,p) Gaussian geometry optimisation and then running frequency calculations. This has been done for the original compound 12 (a diene) and a mononene of compound 12 with just the anti/exo double bond hydrogenated (Figure 3). Below is the spectra obtained from these calculations (Figure 4) and tabulated data for the relevant bond stretches (Figure 5)
| Diene (12) DOI:10042/to-10331 | Monoene (anti double bond replaced with single) DOI:10042/to-10332 |
|---|---|
Figure 4: IR Spectra of Compound 12 and a monohydrogenated derivative, calculated using DFT approach and SCAN facility, displayed using Gaussview
| Compound 12, Dialkene (cm-1) | Monoalkene, exo C=C hydrogenated (cm-1) | |
|---|---|---|
| C-Cl | 770.8 | 780.6 |
| C=Cexo | 1737.0 | single bond |
| C=Cendo | 1757.4 | 1753.8 |
It may seem too obvious to mention, but first thing to note is that the spectrum of the monoene has only given one peak for an olefinic bond stretch, whereas the diene spectrum has given two characteristic frequencies. The peak at 1737.0 in the diene spectrum must therefore correspond to the exo double dond (it has disappeared in the monoene spectrum). This concludes straight away that the two bonds in compound 12 have different vibrational frequencies, C=Cexo giving a lower wavenumber, and that this must be caused by an effect of the C-Cl bond.
What else is clear is that the two spectra give different C-Cl peaks. Since the only difference between the two compounds is the presence or lack of the exo double bond, it can be inferred that this C=Cexo bond must influence the stretching frequency of the C-Cl bond, aswell as vice versa. Both observations can be explained by relating back to Part 1, where the idea of orbital overlap was discussed. It was seen from the MOPAC/PM6 MO surface images (Figure 2) that the σ*C-Cl of the LUMO was capable of overlap with the πC=C(exo) of the HOMO-1. C=Cexo therefore donates somes of its electron density into C-Cl. This destabilises the C-Cl bond and diffuses the orbital density of C=Cexo, resulting in both having weaker bonds and both giving lower frequencies.
MOPAC/PM6 calculations have been very useful in this case, having led to the prediction of πC=C(exo)/σ*C-Cl overlap which has explained almost all observations of this study.
Monosaccharide Chemistry - Glycosidation
Glycosidation reactions are a major aspect of sugar chemistry, the means by which nucleophilic groups are attached to hexose rings. Cyclic monosaccharides such as those drawn in (Figure 1) can have two possible stereoisomers known as anomers, these differ in the orientation of the nucleophilic group and depend the on the mode of attack. The stereochemistry of the anomer is influenced by the stereochemistry of the starting oxonium ion (A and B), this is known as the neighbouring group effect. If the acetyl is pointing up, the nucleophile will tend to attack from the bottom face giving the α-anomer. The opposite is true if the acetyl is pointing down. Either way, a 1,2-trans product predominates. As well as just stereospecific orientations of the acetyl group, there is also the possibility of stereospecific orientations of the acyl group that makes up part of the acetyl. A '*' indicates an isomer of this case
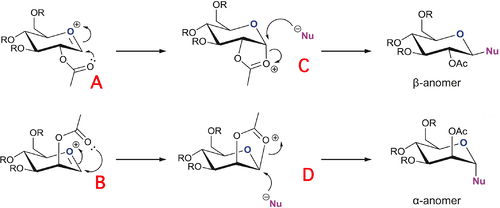
Sketched, modelled and optimised using MM2 and MOPAC/PM6 methods are all four structure A-D, as well as their * isomers. Methyl groups have been used in place of R because they are relatively small so won't take too long adopting an optimum geometry, and won't participate in hydrogen-bonding which can also complicate calculations. MM2 force-field calculations have been used to optimise geometries and predict energies and energetic data, however, the model is somewhat limited when predicting the geometries. Neighbouring group effects are not factored in, and as mentioned previously this is extremely important in terms of the reactivity. For this reason, MOPAC/PM6 optimisations have also been performed to give a better representation of the 'real' molecule and the models obtained from these are displayed in the Jmol table headers.
| Stretch | 2.73 | 2.54 | 2.70 | 2.57 | 1.67 | 2.50 | 1.80 | 2.50 |
|---|---|---|---|---|---|---|---|---|
| Bend | 11.9 | 11.0 | 9.98 | 11.3 | 17.2 | 18.7 | 18.4 | 21.1 |
| Stretch-Bend | 1.02 | 0.951 | 0.936 | 0.859 | 0.798 | 0.957 | 0.746 | 0.938 |
| Torsion | 3.13 | 0.357 | 2.95 | 2.32 | 3.59 | 4.33 | 7.28 | 2.71 |
| Non-1,4 VDW | 1.98 | -2.88 | 0.0702 | -1.00 | -3.11 | -2.06 | -1.61 | -1.70 |
| 1,4 VDW | 19.2 | 18.3 | 19.4 | 19.5 | 16.5 | 18.1 | 16.9 | 17.3 |
| Charge/Dipole | -33.4 | -2.42 | -21.7 | -18.5 | -6.46 | -2.93 | -19.7 | -2.23 |
| Dipole/Dipole | 8.00 | 4.8 | 5.89 | 7.55 | 1.19 | 1.12 | 1.47 | 0.548 |
| Total Energy (MM2) | 14.5 | 32.6 | 20.3 | 24.6 | 31.4 | 40.7 | 25.3 | 41.2 |
| Total Energy (MOPAC/PM6) | -83.9 | -77.2 | -88.5 | -74.4 | -88.7 | -68.7 | -89.0 | -67.8 |
The table above presents all the obtained data, there a number of observable trends. All '*' isomers are higher in energy than their non-* counterparts. This can be explained for the A/B isomers by looking at the charge/dipole forces data which reveal all non-* isomers of A and B to be much more stabilised with respect to this parameter. The orientation of the acyl group seems to have a large effect on the overall energy, and when it is orientated towards the ring it has a stabilising effect as shown by the data. The C*/D* isomers will be higher in energy than the non-* C/D isomers because they are trans-lactones, highly strained conformations. A/A* and B/B* are lower in energy than their intermediate counterparts C/C* and D/D*, this seems mostly due to bending and torsional strain brought about by formation of the energetically unfavourable five-membered ring - noticable in the data.
Looking more closely at the PM6 results it can be seen that A,B,C and D are more closely aligned for the PM6, than the MM2. This reveals that the PM6 method factors in the neighbouring group effect and regards the intermediates as having delocalised non-classical carbocations.
The question is, how can this relate back to the selectivity? A and B are known to be favoured in their formation of C and D to eventually yield the α- and β-anomers. This could be due to A and B being lower in energy, therefore more abundant, and so C and D are more likely to form. A and B are also more reactive than A* and B* due to the alignment of the acyl group with the ring.
Structure based Mini Project using DFT-based MO methods
Assigning Regioisomers in "Click Chemistry"
Introduction

"Click Chemistry", so-called because of the speed and ease with which it occurs, was a term coined by K.B. Sharpless to describe his aims of transforming synthetic chemistry [4]. One such reaction which could fall under the category is the Cu(I)-catalysed 1,3 dipolar cycloaddition of an azide to an alkyne to give a 1,2,3-triazole. If the azide is mono-substituted and the alkyne is unsymmetrical then the reaction becomes a competition for the production of two regioisomers. This hypothetical reaction has been drawn out in Figure 1. Of course it would be futile to speed up an unselective reaction, so the Cu(I)-catalyst also brings about selectivity, almost exclusively giving the 1,4-isomer. Investigated in another project of which Sharpless was involved was the same reaction catalysed by Ruthenium and this time selecting the 1,5-isomer.[5]
Taking R1=Benzyl and R2=Phenyl, computational methods have been used to try and predict the spectroscopy of the two isomers and assess how easily they could be distinguished. The literature[5] on the Ruthenium catalysed reaction described has been used for data comparison.
Optimisations
| A (MM2 Optimised) | A (MOPAC/AM1 Optimised) | B (MM2 Optimised) | B (MOPAC/AM1 Optimised) | ||||||||||||
|---|---|---|---|---|---|---|---|---|---|---|---|---|---|---|---|
|
|
|
|
| 1,4-isomer (A) | 1,5-isomer (B) | |
|---|---|---|
| Stretch | 1.11 | 0.775 |
| Bend | 18.3 | 13.1 |
| Stretch-Bend | 0.108 | -0.0298 |
| Torsion | -15.7 | -14.8 |
| Non-1,4 VDW | 0.727 | -1.69 |
| 1,4 VDW | 14.4 | 14.7 |
| Dipole/Dipole | -1.66 | -1.41 |
| Total Energy (MM2) | 17.2 | 10.7 |
Before any computational spectroscopic predictions could be made, the pre-optimised models were subjected to MPW1PW91/6-31G(d,p) geometry optimisations. This resulted in the structures below.
| A (DFT) DOI:10042/to-10460 | B (DFT) DOI:10042/to-10461 | ||||||
|---|---|---|---|---|---|---|---|
|
|
Predicted NMR Spectra
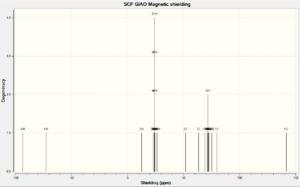
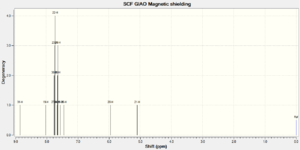
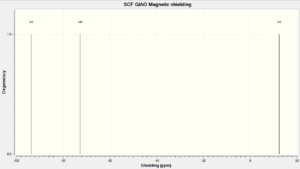
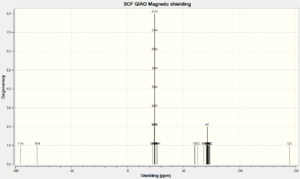
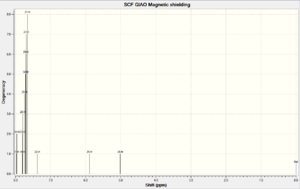
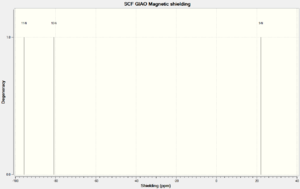
Once the Gaussian MPW1PW91/6-31G(d,p) optimised models had been computed they were sent off to SCAN for NMR predictions. Retrieved back were N, H and C spectra for A and B, set out below. There aren't really enough N environments to help distinguish the spectra and therefore the isomers and there is likely to be an over-complicated 1H NMR spectrum with many overlaps and complex splitting patterns. For this investigation, only 13C NMR seems to be the most pertinent so this will be focussed on and compared to literature. Both isomers are triazole compounds, so the correction formula should be used to account for possible errors. The correction formula is thus: δcorr = 0.96δcalc + 12.2.
| Full NMR Spectrum | 1H NMR Spectrum | 15N NMR Spectrum |
|---|---|---|

| Carbon Assignment | Gaussian δ (ppm) | Gaussian δcorr (ppm) | Literature δ (ppm) | Discrepancy |
|---|---|---|---|---|
| 6 | 54.87 | 64.87 | 54.20 | 10.7 |
| 1 | 117.0 | 124.5 | 119.8 | 4.7 |
| 14 | 121.3 | 128.7 | 126.0 | 2.7 |
| 18 | 121.9 | 129.2 | 126.0 | 3.2 |
| 16 | 124.1 | 131.3 | 128.1 | 3.2 |
| 12 | 124.2 | 131.4 | 128.1 | 3.3 |
| 8 | 124.5 | 131.7 | 128.2 | 3.5 |
| 9,10 | 124.8 | 132.0 | 128.2 | 3.8 |
| 15 | 125.0 | 132.2 | 129.0 | 3.2 |
| 17 | 125.2 | 132.4 | 129.0 | 3.4 |
| 11 | 125.6 | 132.8 | 129.3 | 3.5 |
| 13 | 127.7 | 134.8 | 130.1 | 4.7 |
| 7 | 133.2 | 140.1 | 134.8 | 5.3 |
| 2 | 144.9 | 151.3 | 148.0 | 3.3 |
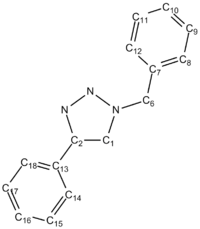
Excluding the discrepancy of 10.7 which seems to arise from perhaps a misuse of the correction formula, the data correlate fairly well. The corrected calculated data are always larger than the literature, but by quite a consistent value each time, suggesting that the correction formula could be adapted. The most noticable discrepancies other than the 10.7 are at carbons 1, 7 and 13. C-7 and C-13, as seen from Figure 8 are the carbons at which the benzene rings are substituted. Experimentally these environments may be subject to particular shielding/deshielding from aromatic ring currents which the modelling has not properly taken into account.
| Full NMR Spectrum | 1H NMR Spectrum | 15N NMR Spectrum |
|---|---|---|
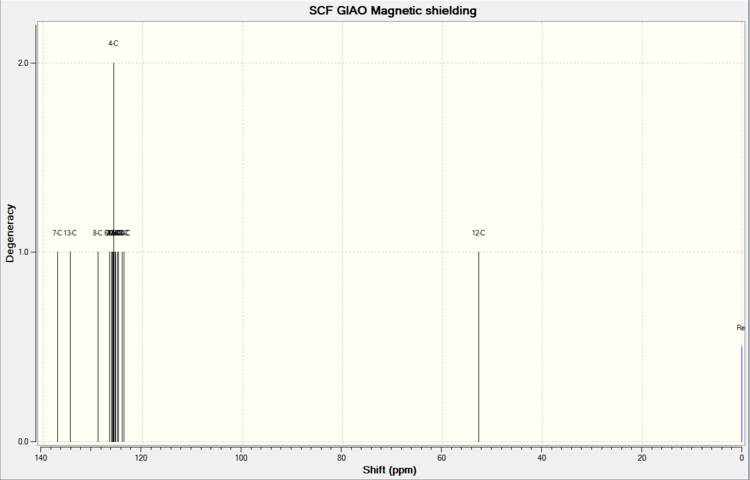
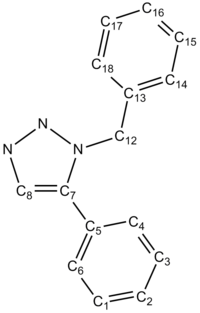
| Carbon Assignment | Gaussian δ (ppm) | Gaussian δcorr (ppm) | Literature δ (ppm) | Discrepancy |
|---|---|---|---|---|
| 12 | 52.25 | 62.36 | 51.85 | 10.5 |
| 14 | 123.4 | 130.7 | 126.93 | 3.8 |
| 18 | 123.7 | 131.0 | 127.22 | 3.8 |
| 16 | 124.5 | 131.7 | 128.22 | 3.5 |
| 5 | 124.7 | 131.9 | 128.22 | 3.7 |
| 3 | 125.1 | 132.3 | 128.92 | 3.4 |
| 15 | 125.2 | 132.4 | 128.92 | 3.5 |
| 4 | 125.5 | 132.7 | 129.08 | 3.6 |
| 17 | 125.5 | 132.7 | 129.08 | 3.6 |
| 1 | 125.6 | 132.8 | 129.64 | 3.2 |
| 2 | 125.9 | 133.1 | 133.26 | 0.2 |
| 6 | 126.2 | 133.4 | 133.26 | 0.1 |
| 8 | 128.6 | 135.7 | 133.34 | 2.4 |
| 13 | 134.1 | 140.9 | 135.66 | 5.2 |
| 7 | 136.7 | 143.4 | 138.26 | 5.1 |
Predicted IR Spectra
| IR Spectrum - A DOI:10042/to-10456 | IR Spectrum - B DOI:10042/to-10458 |
|---|---|
| 1,4-isomer (A) | 1,5-isomer (B) | |
|---|---|---|
| C-H b (Phenyl) | 744.0 | 743.5 |
| C-H b (Benzyl) | 771.5 | 779.7 |
| N-N s (Triazole) | 1309.3 | 1282.5 |
| C=C s (Phenyl) | 1663.5 | 1642.1, 1662.0 |
| C=C s (Benzyl) | 1665.9 | 1633.0, 1662.5 |
| CH2 s | 3071.2 | 3076.3 |
| C-H s (Benzyl) | 3193.2, 3204.9, 3221.3 | 3201.2, 3209.08, 3214.5 |
| C-H s (Phenyl) | 3190.9, 3199.6, 3209.5 | 3193.7, 3203.7, 3210.6 |
| C-H s (Triazole) | 3295.4 | 3275.9 |
References
- ↑ J.E. Baldwin, Journal of Organic Chemistry 1966, 31, 2441–2444
- ↑ S. W. Elmore and L. Paquette, Tetrahedron Letters, 1991, 319
- ↑ W.F. Maier, P.v.R. Schleyer, J. Am. Chem. Soc., 1981, 103 (8), 1891-1900
- ↑ H. C. Kolb, M. G. Finn and K. B. Sharpless Angewandte Chemie International Edition 2001 40 (11): 2004–2021
- ↑ Li Zhang et al. J. Am. Chem. Soc., 2005, 127 (46), pp 15998–15999

