Rep:Mod:CMB22301333464
BH3
B3LYP/6-31G(d.p) level
Summary
Convergence
Item               Value     Threshold  Converged?
 Maximum Force            0.000161     0.000450     YES
 RMS     Force            0.000105     0.000300     YES
 Maximum Displacement     0.000637     0.001800     YES
 RMS     Displacement     0.000417     0.001200     YES
Optimisation log file log bh3_optimisation.log
Frequencies
Low frequencies ---   -0.2458   -0.1130   -0.0053   43.9715   45.1306   45.1313
Low frequencies --- 1163.6034 1213.5913 1213.5940
Frequency analysis log file bh3_frequency.log
Structure
BH3 |
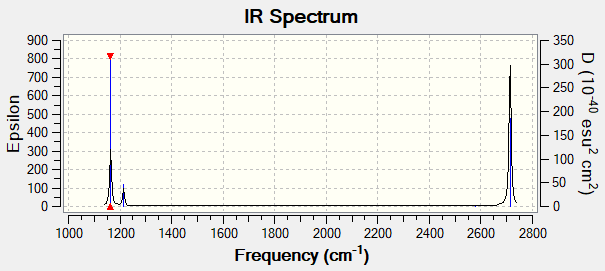
Vibrational spectrum for BH3
| wavenumber (cm-1 | Intensity (arbitrary units) | Symmetry | IR active? | Type |
| 1164 | 92 | A2" | yes | Out-of-plane bend |
| 1214 | 14 | E' | very slight | In plane bend |
| 1214 | 14 | E' | very slight | In plane bend |
| 2580 | 0 | A1' | no | Totally symmetric stretch |
| 2713 | 126 | E' | yes | Asymmetric stretch |
| 2713 | 126 | E' | yes | Asymmetric stretch |
IR Spectrum
Here we can see that there are 3 peaks in the spectrum but we have 6 vibrational frequencies, how is this? This can be explained by the fact that there are 2 sets of degenerate vibrations with frequencies 1213 cm-1 and 2713 cm-1, then the vibration with frequency 2580 cm-1 results in no change in dipole moment due to being a symmetric stretch meaning it is not IR active and not seen. Thus reducing the number of expected peaks to 3 which is what we see.
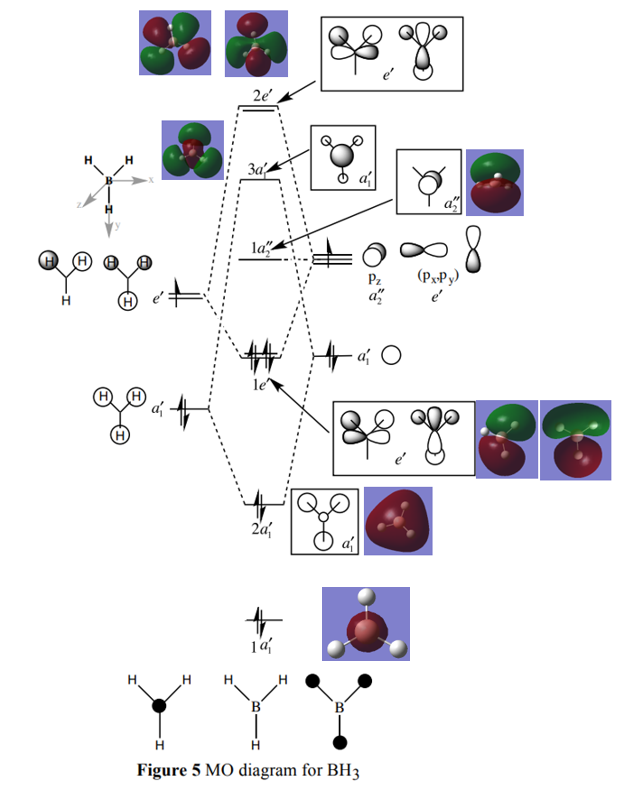
Molecular Orbital Diagram for BH3
Shape: Trigonal Planar
Point Group: D3h
Reference: http://www.huntresearchgroup.org.uk/teaching/teaching_comp_lab_year2a/Tut_MO_diagram_BH3.pdf
Are there any significant differences between the real and LCAO MOs?
The pictorial diagrams from the LCAO MOs are similar to the real MOs. Some difference are the fact that the MOs from the LCAO have been estimated qualitatively and the size of the individual contributions from the atoms are guessed based on how close the MO is to the fragment orbitals. When a calculation is carried out to find the real MOs the computer optimises the coefficients for the molecular system using the mathematics involved in quantitatively solving the Schrodinger equation. We can see that the real MOs are more diffuse and takes into account the calculation of the interactions mathematically between the individual atomic orbitals whereas the LCAOs have been directly places on top of one another once in and once out of phase and not depicted as the final mixed outcome of the atomic orbitals.
What does this say about the accuracy and usefulness of qualitative MO theory?
The LCAO MOs are closely related to the real MOs and the similarities can clearly be seen from the other. The qualitative energy levels are also in the same order as the quantitive energy levels from the computer. This shows us that qualitative MO theory is very useful for predicting the MOs without having to calculate the real MOs using the mathematics involved in solving the Schrodinger equation and can help us understand bonding relatively quickly and easily. This suggests that qualitative MO theory is both accurate and important.
NH3
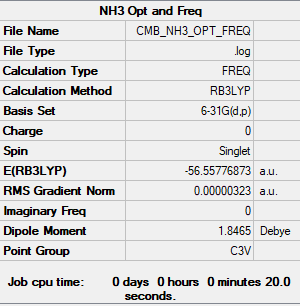
B3LYP/6-31G(d.p) level
Summary
Convergence
Item               Value     Threshold  Converged?
 Maximum Force            0.000006     0.000450     YES
 RMS     Force            0.000004     0.000300     YES
 Maximum Displacement     0.000014     0.001800     YES
 RMS     Displacement     0.000009     0.001200     YES
Optimisation and Frequency analysis log file nh3_frequency.log
Frequencies
Low frequencies ---   -0.0128   -0.0024    0.0007    7.1034    8.1048    8.1051
Low frequencies --- 1089.3834 1693.9368 1693.9368
Structure
NH3 |
NH3BH3
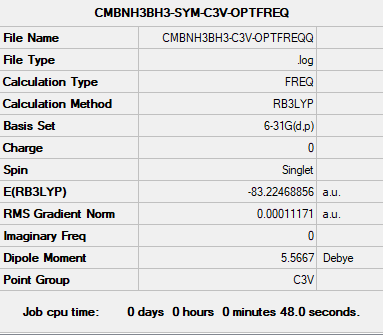
B3LYP/6-31G(d.p) level
Summary
Convergence
Item               Value     Threshold  Converged?
 Maximum Force            0.000233     0.000450     YES
 RMS     Force            0.000083     0.000300     YES
 Maximum Displacement     0.001202     0.001800     YES
 RMS     Displacement     0.000370     0.001200     YES
Optimisation and frequency analysis log file nh3bh3_frequency.log
Frequencies
Low frequencies ---   -0.0407   -0.0057   -0.0004   10.1697   10.1745   37.9549
Low frequencies ---  265.3081  634.4310  639.2095
Structure
NH3BH3 |
Association Energy Calculation
E(NH3)= -56.55776873 a.u
E(BH3)= -26.61532349 a.u
E(NH3BH3)= -83.22468893 a.u
ΔE=E(NH3BH3)-(E(NH3)+E(BH3)) = -0.05160 a.u
1 a.u (Hartree) = 2625.5 kJ mol-1
ΔE = -135 kJ mol-1
From the calculation a conclusion that the B-N dative bond is a fairly weak bond has been made. This is from the comparison to an iso-electronic carbon-carbon single bond which has bond energy of approximately 346 kJ mol-1 [1]
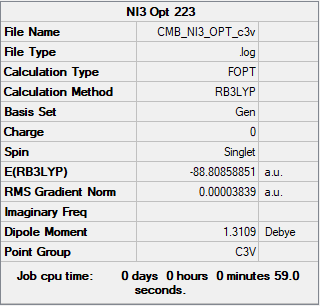
NI3
B3LYP/6-31G(d.p)LANL2DZ
Summary
Convergence
Item               Value     Threshold  Converged?
 Maximum Force            0.000068     0.000450     YES
 RMS     Force            0.000044     0.000300     YES
 Maximum Displacement     0.000493     0.001800     YES
 RMS     Displacement     0.000333     0.001200     YES
Frequency analysis log file ni3_frequency.log
Frequencies
Low frequencies ---  -62.2503  -62.2469  -61.8931   -0.0117    0.0016    0.0074
Low frequencies ---  134.0272  134.0273  196.1461
Structure
NI3 |
Optimised Nitrogen-Iodine Bond distance = 2.184 Å
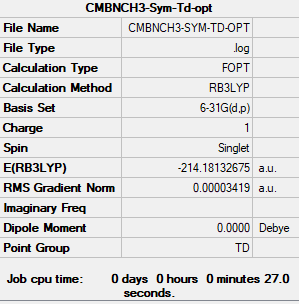
[N(CH3)4]+
B3LYP/6-31G(d.p)
Summary
Convergence
Item               Value     Threshold  Converged?
 Maximum Force            0.000071     0.000450     YES
 RMS     Force            0.000037     0.000300     YES
 Maximum Displacement     0.000952     0.001800     YES
 RMS     Displacement     0.000368     0.001200     YES
Frequencies
Low frequencies ---   -0.0010   -0.0009   -0.0008   34.6123   34.6123   34.6124
Low frequencies ---  216.3622  315.8051  315.8051
Frequency analysis log file nch3_frequency.log
Structure
[N(CH3)4]+ |
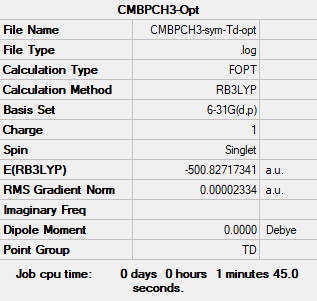
[P(CH3)4]+
B3LYP/6-31G(d.p)
Summary
Convergence
Item               Value     Threshold  Converged?
 Maximum Force            0.000138     0.000450     YES
 RMS     Force            0.000035     0.000300     YES
 Maximum Displacement     0.000718     0.001800     YES
 RMS     Displacement     0.000298     0.001200     YES
Frequencies
 Low frequencies ---   -0.0013    0.0009    0.0012   51.6355   51.6355   51.6355
 Low frequencies ---  188.7480  213.6021  213.6021
Frequency analysis log file pch3_frequency.log
Structure
[P(CH3)4]+ |
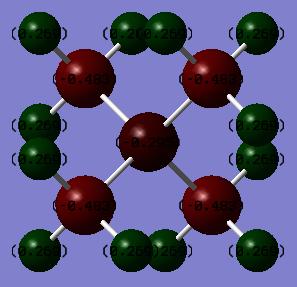
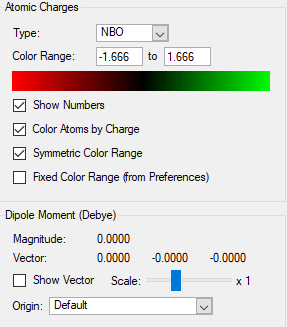
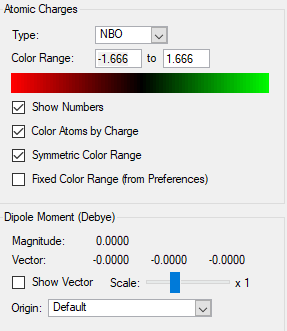
Charge analysis
| Atom | Charge / C |
|---|---|
| Nitrogen | -0.295 |
| Carbon | -0.483 |
| Hydrogen | 0.269 |
| Atom | Charge / C |
|---|---|
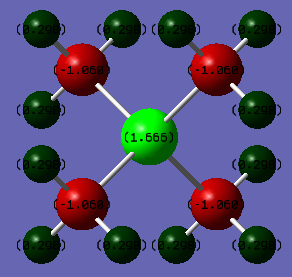
| Phosphorus | 1.666 |
| Carbon | -1.060 |
| Hydrogen | 0.298 |
Discussion
From the tables we can see that the charge on the Nitrogen atom is -0.295 compared to Phosphorous which is 1.666, this is telling us that the positive charge is residing mostly on the phosphorus atom in the phosphorus molecule and not on the Nitrogen atom in the nitrogen molecule.This can be explained via the relative electronegativities (the electronegativites of Nitrogen, Carbon and Phosphorus relative to the Pauling scale are 3.04, 2.55 and 2.19 respectively) of the heteroatom compared to carbon, nitrogen is more electronegative than carbon and so withdraws electron density from the methyl groups as it cannot accommodate a positive charge well, whereas carbon is more electronegative than phosphorus and thus the positive charge resides on the phosphorus atom. In addition to this it is in group 3 and so the orbitals are larger and more diffuse and thus stabilises the positive charge more, this is backed up by the values for the charge in the tables. There is not much variation in the charge distribution on the Hydrogen atoms and this is because the inductive effects from the Nitrogen and Phosphorus atoms due to their electronegativity falls away quickly with distance. We can also see that all the atoms related by symmetry have the same charge on them because they're in exactly the same environment.
Traditionally the positive charge would lie on the nitrogen atom due to the nitrogen atom donating its pair acting as a lewis base and forms a dative covalent bond. Three of the N-C bonds are 2c-2e covalent bonds and due to N having a valency of 5 then then the fourth is a dative covalent bond thus the positive charge is a representation of the difference in the expected number of electrons on a neutral nitrogen atom and that of the nitrogen atom in its current bonding situation. The positive charge is actually spread across the nitrogen atom and also the 4 carbon atoms as carbon is less electronegative and can stabilise a positive charge better than the nitrogen atoms. From our charge analysis we can see that there is negative charge distributed over the nitrogen atom and the carbon atoms and positive charge residing on the hydrogen atoms, this is because nitrogen is electronegative and thus pulls electron density from the rest of the molecule. The diagram is also showing the charge as if they are constricted to one atom however in reality the charge is distributed in different proportions across the whole molecule confined to the MOs.
Molecular orbitals
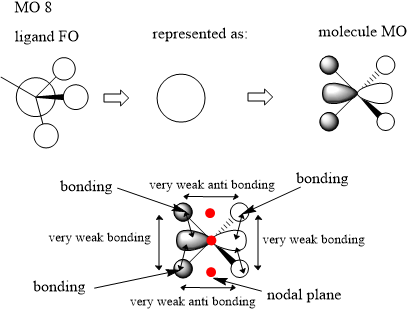
Here we are looking at MO 8. The ligand FO has been identified where there is an s orbital on the carbon atom and each of the hydrogen atoms. There is a bigger contribution on the carbon as it is more electronegative and so contributes more to the bonding MO. We then make a simplification and represent this FO ligand as shown above. We can now represent our MO where there is a p orbital on the nitrogen atom as we can see a node in the real MO. There is some very weak through space bonding and also antibonding interactions between the methyl ligand fragment orbitals however these are likely to not contribute much to the energy and most likely cancel out because there are two of each interaction in and out of phase. There are also some closer through space bonding interactions on either side of the MO with a nodal plane in the middle. Because of this the orbital is overall bonding.
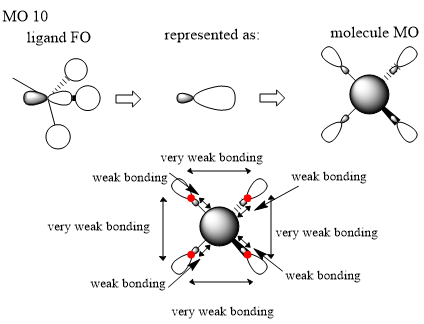
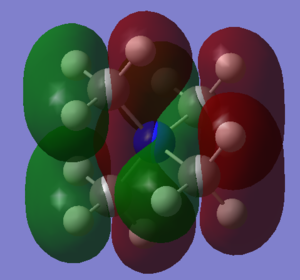
Here we are looking at MO 10. The ligand FO has been identified where these is an p orbital on the carbon atom and s orbitals on the three hydrogen atoms and we have simplified this to be similar to an sp like orbital due to in phase interactions between the s atomic orbitals on the hydrogens and the in phase lobe on the p orbital. We can now represent the real MO where there is an s orbital on the nitrogen atom and our simplified FO ligands which is the same on every methyl group. There are some very weak bonding interactions through space between the larger lobes on the FOs but most likely offer little contribution because they’re so far away and these interactions fall off rapidly with distance. There is also some bonding in phase interactions between the smaller lobe on the FOs and the s atomic orbital on the nitrogen atom. This would suggest that the final molecule MO is overall bonding due to largely bonding character from the ligand FOs.
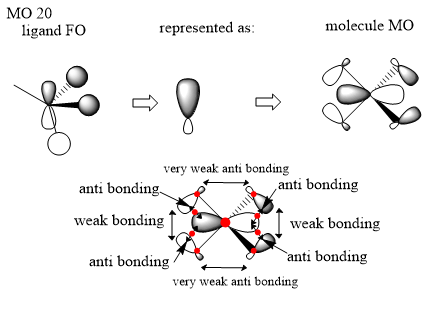
Here we are looking at MO 20. The ligand FO has been identified where there is a p orbital on the carbon atom and then two s orbitals that are in phase with one lobe of the p orbital and one s orbital on the other H atom is in phase with the other lobe. I have represented the simplified FO ligand using an orbital similar to that of a sp orbital even though I would predict it to be more like that of a p orbital because of the two s atomic orbitals in phase with the top lobe being either side of the p orbital compared to the other H atom in phase with the lower lobe being directly being under the lobe and thus having a more direct interaction. I have chosen to represent it as an sp orbital to be clear on the fact that there are two methyl fragments like that shown in the original ligand FO but then two of the reversed phase and if a p orbital was to be used then it could not be distinguished between an inversion of phase or a rotation of the orbital. There is some very weak anti bonding through space interactions from the smaller lobes which will contribute negligible amounts. There are also some in phase through space interactions between the large lobes of the FO ligands on either side and some out of phase through space interactions between the larger lobes of the ligand FO and the lobes of the p orbital of the nitrogen atom where there is an in-region node between these interactions. The overall influence of this orbital is hard to tell however I would suggest bonding due to stronger influence of the bonding interactions in the ligand FO.
References
- ↑ Yu-Ran Luo and Jin-Pei Cheng "Bond Dissociation Energies" in CRC Handbook of Chemistry and Physics, 96th Edition.


