Rep:Mod:CH1516
about energy
The energy units are converted by 0.0004 a.u. = 1 kJ/mol
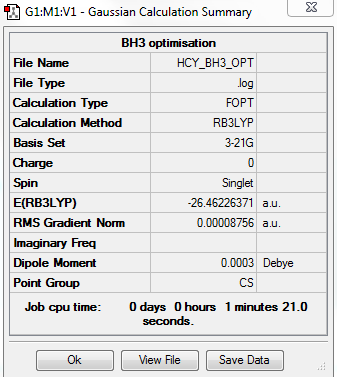
BH3 3-21G
Computational level and basis set
B3LYP/3-21G level
Summary table
Item table
        Item               Value     Threshold  Converged?
Maximum Force            0.000217     0.000450     YES
RMS     Force            0.000105     0.000300     YES
Maximum Displacement     0.000900     0.001800     YES
RMS     Displacement     0.000441     0.001200     YES
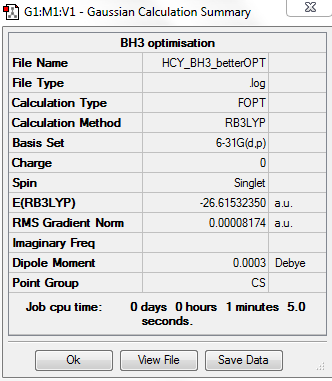
BH3 6-31G
computational level and basis set
B3LYP/6-31G level
summary table
total energy
-2352.40631 a.u.
-5881016 kJ/mol
item table
        Item               Value     Threshold  Converged?
Maximum Force            0.000203     0.000450     YES
RMS     Force            0.000098     0.000300     YES
Maximum Displacement     0.000867     0.001800     YES
RMS     Displacement     0.000415     0.001200     YES
frequency analysis log file
Frequency analysis log file HCY_BH3_FREQ.LOG
low frequencies lines
Low frequencies ---   -0.4059   -0.1955   -0.0054   25.3480   27.3326   27.3356

Low frequencies --- 1163.1913 1213.3139 1213.3166
jmol image
optimised BH3 |
vibration table
| mode # | frequency(cm-1) | intensity(arbitrary units) | symmetry | IR active? | type |
|---|---|---|---|---|---|
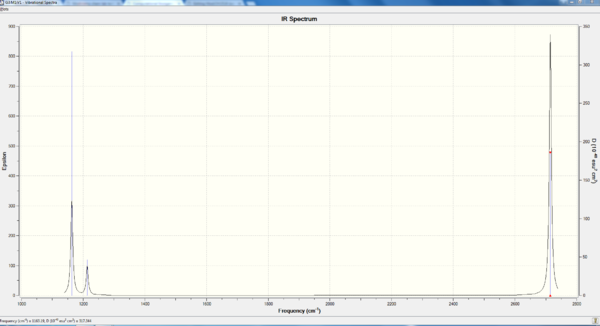
| 1 | 1163 | 93 | A" | yes | out-of-plane bending |
| 2 | 1213 | 14 | E' | yes | angle deformation |
| 3 | 1213 | 14 | E' | yes | angle deformation |
| 4 | 2582 | 0 | A' | no | symmetric bond stretch |
| 5 | 2715 | 126 | E' | yes | asymmetric bond stretch |
| 6 | 2715 | 126 | E' | yes | asymmetric bond stretch |
vibration spectrum
As we can see there is only three vibration peaks on the spectrum but six vibration modes in total. This is because vibration ̃no. 2 and vibration no. 3 are degenerate, they have the same vibration wavenumber so appear as a single peak. vibration no. 4 is IR inactive, because it is a symmetric bond stretch which gives no change in polarity, hence breaking the selection rule. Similarly, vibration no. 5 and no.6 are degenerate and appear as a single peak. Therefore, in total, only three peaks are shown.
Smf115 (talk) 11:53, 25 May 2018 (BST)Correct assignment of the vibrational modes and explaination for only 3 peaks being visible. However, the symmetries of the modes are incorrect which is due to the BH3 molecule having the incorrect point group. The structure should have been symmetrised to D3h for the IR to have the correct symmetries.
MO diagram[1]
As we can see, the LCAO MOs give a good overall representation comparing to real MOs, especially for a1' and a2" MOs. There is some small deviations for e' MOs, such as in the left LCAO MO, one hydrogen at the does not contribute to the MO at all, while in real MO there is some electron density from the bottom H.
It can be concluded that the qualitative MO gives a good representation of the real case with fair accuracy, what is more, the fact that LCAO MOs are really easy to generate enhance their usefulness overall.
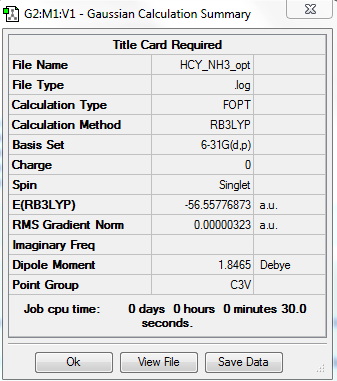
NH3
Computational level and basis set
B3LYP/6-21G level
Summary table
Item table
        Item               Value     Threshold  Converged?
Maximum Force            0.000006     0.000450     YES
RMS     Force            0.000004     0.000300     YES
Maximum Displacement     0.000012     0.001800     YES
RMS     Displacement     0.000008     0.001200     YES
total energy
-56.55777 a.u.
-141394 kJ/mol
frequency analysis log file
Frequency analysis log file HCY_NH3_SYM_OPT.LOG
low frequencies
Low frequencies ---   -8.5200   -8.4726   -0.0035    0.0335    0.1919   26.4074
Low frequencies --- 1089.7616 1694.1863 1694.1866
jmol image
optimised NH3 |
NH3BH3
Computational level and basis set
B3LYP/6-21G level
Summary table
Item table
        Item               Value     Threshold  Converged?
Maximum Force            0.000122     0.000450     YES
RMS     Force            0.000058     0.000300     YES
Maximum Displacement     0.000513     0.001800     YES
RMS     Displacement     0.000296     0.001200     YES
total energy
-83.22469 a.u.
-208062 kJ/mol
frequency analysis log file
Frequency analysis log file HCY_NH3BH3_SYM_OPT.LOG
low frequencies
Low frequencies ---   -0.0614   -0.0457   -0.0067   21.7005   21.7064   40.6240
Low frequencies ---  266.0448  632.3709  640.1464
jmol image
optimised NH3BH3 |
̝
energy calculation[2]
E(NH3)=-56.55777 a.u.
E(BH3)=-26.61532 a.u.
E(NH3BH3)=-83.22469 a.u.
ΔE=E(NH3BH3)-[E(NH3)+E(BH3)]=(-83.22469)-[(-56.55777)+(-26.61532)] a.u.=-0.0516 a.u.=-129 kJ/mol
This is a weak bond, compared to B-N covalent bond. The latter is 377.9 kJ/mol.[2] This weak strength is because it's a dative bond, with two electrons from N.
Smf115 (talk) 11:54, 25 May 2018 (BST)Great consideration towards the accuracy of reported values and nice to see the energies reported for each structure.
BBr3
Computational level and basis set
B3LYP/Gen
Summary table
Item table
        Item               Value     Threshold  Converged?
Maximum Force            0.000008     0.000450     YES
RMS     Force            0.000005     0.000300     YES
Maximum Displacement     0.000036     0.001800     YES
RMS     Displacement     0.000023     0.001200     YES
total energy
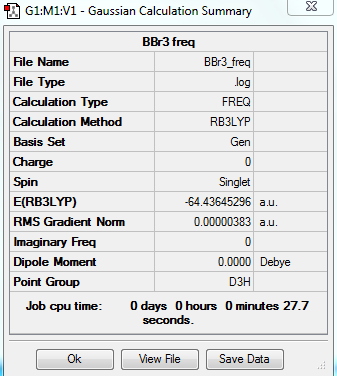
-64.43645 a.u.
-161091 kJ/mol
frequency analysis log file
Frequency analysis log file BBr3_freq.log
low frequencies
Low frequencies ---   -0.0137   -0.0064   -0.0046    2.4315    2.4315    4.8421
Low frequencies ---  155.9631  155.9651  267.7052
jmol image
optimised BBr3 |
̝
DSpace identifier
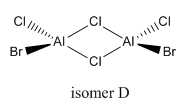
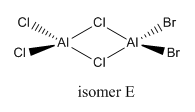
mini-projectː Al2Cl4Br2
isomers and symmetries
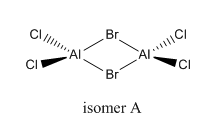
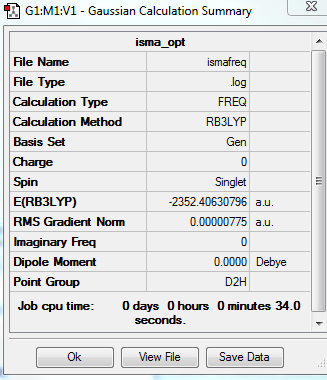
isomer A
Computational level and basis set
B3LYP/Gen
Summary table
Item table
        Item               Value     Threshold  Converged?
Maximum Force            0.000024     0.000450     YES
RMS     Force            0.000008     0.000300     YES
Maximum Displacement     0.000679     0.001800     YES
RMS     Displacement     0.000339     0.001200     YES
total energy
-2352.40631 a.u.
-5881016 kJ/mol
frequency analysis log file
Frequency analysis log file ISMAFREQ.LOG
low frequencies
Low frequencies ---   -5.1263   -5.0805   -3.1863   -0.0005    0.0028    0.0044
Low frequencies ---   14.8606   63.2610   86.0512
jmol image
optimised isomerA |
̝
DSpace identifier
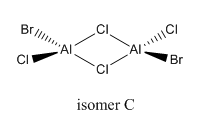
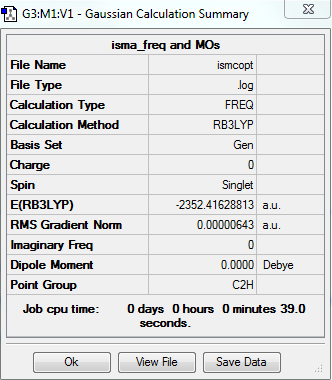
isomer C
Computational level and basis set
B3LYP/Gen
Summary table
Item table
        Item               Value     Threshold  Converged?
Maximum Force            0.000013     0.000450     YES
RMS     Force            0.000006     0.000300     YES
Maximum Displacement     0.000766     0.001800     YES
RMS     Displacement     0.000298     0.001200     YES
total energy
-2352.41629 a.u.
-5881041 kJ/mol
frequency analysis log file
Frequency analysis log file ISMCFREQ.LOG
low frequencies
Low frequencies ---   -4.2179   -2.5716    0.0028    0.0031    0.0038    0.6119
Low frequencies ---   17.7000   48.9940   72.9499
jmol image
optimised isomerC |
̝
DSpace identifier
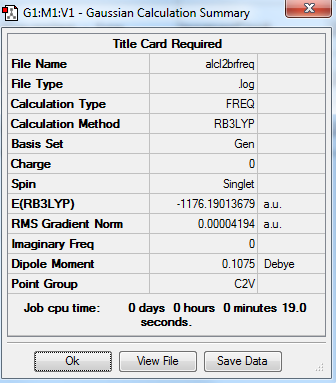
AlCl2Br
Computational level and basis set
B3LYP/Gen
Summary table
Item table
        Item               Value     Threshold  Converged?
Maximum Force            0.000081     0.000450     YES
RMS     Force            0.000042     0.000300     YES
Maximum Displacement     0.001588     0.001800     YES
RMS     Displacement     0.000974     0.001200     YES
total energy
-1176.19014 a.u.
-2940475 kJ/mol
frequency analysis log file
Frequency analysis log file ALCL2BRFREQ.LOG
low frequencies
Low frequencies ---    0.0025    0.0034    0.0045    1.3569    3.6367    4.2604
Low frequencies ---  120.5042  133.9178  185.8950
jmol image
optimised AlCl2Br |
̝
DSpace identifier
energies of isomers
Energy of isomer A
-2352.40631 a.u.
-5881016 kJ/mol
Energy of isomer C
-2352.41629 a.u.
-5881041 kJ/mol
relative stability of isomer A and isomer C
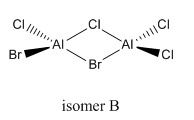
The relative energy of isomer C is 25 kJ/mol lower than isomer A, hence more stable. This might be due to the fact that Al is in the same row as Cl, while Br is a row lower than Al. Therefore, there is a better orbital overlap between Al and Cl, which results in lower bond energy and greater stability.
Smf115 (talk) 12:22, 27 May 2018 (BST)Clear presentation of the energies of the conformers, and of other all other structures throughout the report, with consideration towards the accuracy of reported values. Good idea to justify the relative energies howver, a bit mroe detail could have been added such as which orbitals are overlapping.
dissociation reaction
My stable isomer among the two isomer above is isomer C, whose energy is -5881041 kJ/mol.
The energy of AlCl2Br is -1176.19014 a.u. = -2940475 kJ/mol
Therefore, the dissociation energy of Al2Cl4Br2 = ΔE = 2×E(AlCl2Br) - E(isomerC) = 2×(-2940475 kJ/mol) - (-5881041 kJ/mol) = +91 kJ/mol
The energy change from Al2Cl4Br2 to AlCl2Br is positive, therefore, Al2Cl4Br2 is more stable than the isolated monomers. The dimerisation brings down the energy of the whole system.
MOs of isomer C
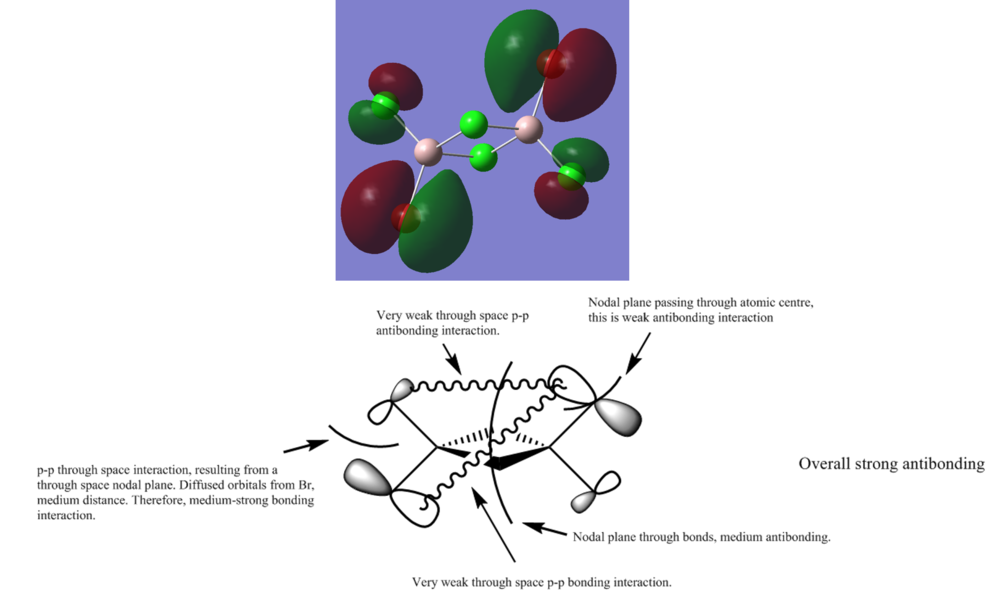
MO 53ː strong antibonding
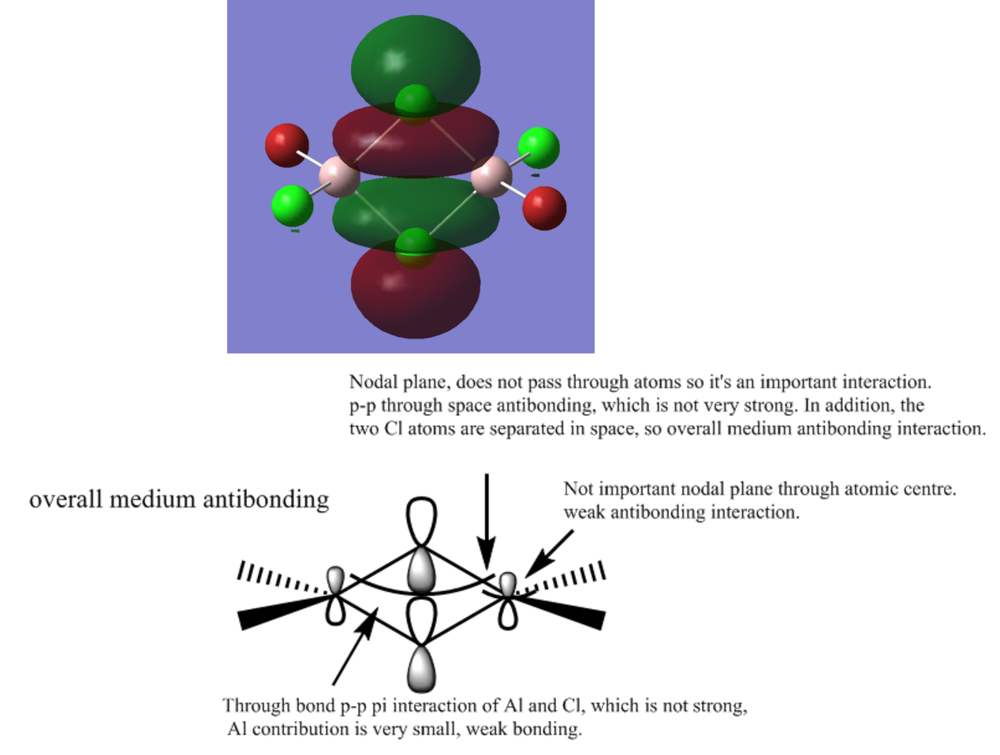
MO 42ː medium antibonding
MO 31ː medium bonding
Smf115 (talk) 12:25, 27 May 2018 (BST)Good selection of MOs and the key interactions and MO character are largely correct and annotated. To improve, there are a few incorrect details, such as for MO 53 this is a weakly anti-bonding orbital and the through space p-orbital interaction between the terminal atoms is anti-bonding. A few more details could have developed the answers a bit further, such as mentioning that the electronegative atoms contirbute more (in MO 53).
Smf115 (talk) 12:26, 27 May 2018 (BST)Overall a good wiki report which is well presented.
reference
[1]ː LCAO MO diagram taken from Dr. P. Hunt http://www.huntresearchgroup.org.uk/teaching/teaching_comp_lab_year2a/Tut_MO_diagram_BH3.pdf
[2]ː Luo, Y. R., Comprehensive Handbook of Chemical Bond Energies, CRC Press, Boca Raton, FL, 2007.

