Rep:Mod:C1Y3HS
Experiment 1C
Conformational Analysis using Molecular Mechanics: Part 1
The Hydrogenation of Cyclopentadiene Dimer
Molecules of cyclopentadiene can undergo a dimerisation via a Diels Alder cycloaddition reaction to form dicyclopentadiene. 2 different isomeric products should be formed, either the exo (1) or endo (2) isomer (Figure 1), depending on the relative orientations of the cyclopentadiene rings during reaction. However when cyclopentadiene dimerises, it preferentially forms the endo isomer. The objective of this experiment was to use molecular mechanics to evaluate whether this cycloaddition is under thermodynamic or kinetic control. To understand this, the energies of the different isomers need to be predicted.
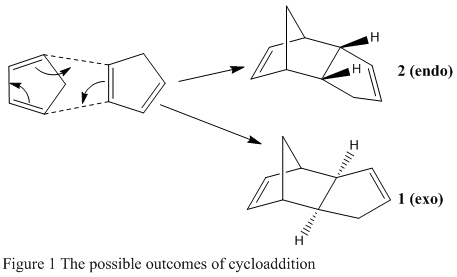
The structures of the 2 different isomers were modelled using ChemBio3D, exo isomer and endo isomer, and using the MM2 force field, their energies were optimised. this also provided various contributions of energies characteristic to each isomer, these are summarised in Table 1.
| Energy Type | Exo Isomer (1) (kcal/mol) | Endo Isomer (2) (kcal/mol) |
|---|---|---|
| Bond Stretching | 1.2850 | 1.2509 |
| Angle Bending | 20.5805 | 20.8477 |
| Stretch-bend | -0.8381 | -0.8358 |
| Torsional | 7.6555 | 9.5109 |
| Non-1,4 VDW | -1.4174 | -1.5439 |
| 1,4 VDW | 4.2334 | 4.3200 |
| Dipole-Dipole | 0.3775 | 0.4476 |
| Total | 31.8764 | 33.9975 |
Comparing the total energies of the isomers indicates that the exo isomer is actually 2.1211 kcal/mol lower in energy than the endo isomer. This information shows that the endo isomer, which is preferentially formed during the dimerisation reaction [1], is produced under kinetic control, and therefore the transition state leading to this product is lower in energy than the one leading to the exo dimer, which would be formed under thermodynamic control. Further analysis of the contributions of energy show that they are all fairly similar apart from the torsional energy, where the endo isomer is 1.8554 kcal/mol higher than the exo isomer. This extra energy is explained by the requirement of proximity when the cyclopentadiene rings line up, one above another to form the endo isomer. Kinetically however, this is favourable as this alignment allows stabilising orbital overlap, which would lower the energy of the transition state. During the formation of the exo isomer, the alignment of the rings takes an 'end-to-end' approach resulting in no stabilising orbital interactions but a lower torsional energy.
During hydrogenation of the endo dicyclopentadiene isomer, 1 of the unsaturated bonds is redcued first before the other one, in a step wise reaction [2]. This means there are 2 dihydro derivative intermediates in the total hydrogenation of the compound and they are shown in figure 2 as compounds 3 and 4.

Molecular mechanics was used in order to reach a conclusion about the stabilities of the relative dihydro derivatives. Product 3 and product 4 were modelled in ChemBio3D and their energies were minimised using the MM2 force field. Similarly to before, a breakdown of contribution energies was obtained and these results are summarised in Table 2.
| Energy Type | Isomer (3) (kcal/mol) | Isomer (4) (kcal/mol) |
|---|---|---|
| Bond Stretching | 1.2488 | 1.0965 |
| Angle Bending | 19.1613 | 14.5243 |
| Stretch-bend | -0.8354 | -0.5494 |
| Torsional | 11.0727 | 12.4974 |
| Non-1,4 VDW | -1.6417 | -1.0700 |
| 1,4 VDW | 5.7965 | 4.5126 |
| Dipole-Dipole | 0.1622 | 0.1406 |
| Total | 34.9643 | 31.1520 |
Firstly the total energy of derivative 4 is 3.8123 kcal/mol lower in energy than derivative 3, proving that it is more thermodynamically stable than product 3. The literature states that product 4 is formed predominantly, therefore the reaction is under thermodynamic control [2]. To understand why, the energies calculated in Table 2 need to be further analysed. The values are similiar for both products, however the most significant difference occurs in the angle bending energy, which differs by 4.637 kcal/mol. The optimal C-C-H bond angle for an sp2 hybridised carbon is 120o. This specific angle differs between product 3 and 4, their values being 126.3o and 123.8o respectively. From this it is obvious that the angles in derivative 4 are more favourable as they are closer in value to the favoured 120o, therefore providing less strain in the molecule. The analysis above indicates why product 4 is the lowest in energy, and therefore formed thermodynamically.
Taxol is an important drug which is used to tackle ovarian cancer. Its synthesis sees the development of two key atropisomeric intermediates (figure 3) which differ in the directionality of the carbonyl group relative to the CMe2 bridge. In 9, it is on the same side and in 10, on the other side. The alkene moiety in the molecule undergoes extremely slow functionalisation reactions. The objective of this experiment was to use similar molecular modelling techniques to confirm which atropisomer is the correct intermediate, and to use the calculated energies to develop an explanation of the slow reactivity of the alkene group.
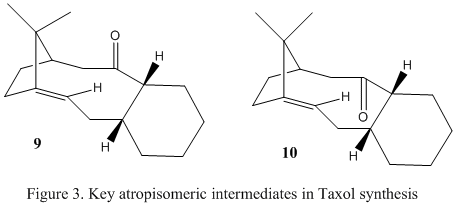
Both intermediates were modelled on ChemBio3D and their geometries were optimised using the MM2 force field. During optimisation it seemed that there were 2 different conformations which resulted in a minimal energy. Upon observation of the models, it seemed these corresponded to 2 chair conformations of the fused 6 membered ring, for each molecule, 9 and 10. Theoretically this is as expected, as the chair conformation minimises the torsional strain experienced by the ring. The results of the calculations and models of the minimised geometries are tabulated below.
| Compound 9 | Compound 10 | |
|---|---|---|
| Chair 1 | Compound 9 Chair 1 | Compound 10 Chair 1 |
| Total Energy (kcal/mol) | 47.8395 | 42.6828 |
| Chair 2 | Compound 9 Chair 2 | Compound 10 Chair 2 |
| Total Energy (kcal/mol) | 58.3856 | 52.5418 |
For both compounds, one of the chair conformations is ~10-11 kcal/mol lower in energy than the other. From the models you can see that the lower energy chair in both molecules is the one where the β carbon, to the carbonyl group, in the six membered ring is facing the opposite direction the the carbonyl group, and the higher energy conformer corresponds the same carbon pointing in the same direction as the carbonyl functional group. Therefore chair 1 for both products are the lowest energy conformers. More in depth comparison of these conformers allowed determination of which was more stable. Using the MM2 force field on ChemBio3D, the contributions of energy were calculated. The results are shown in Table 4. Molecule 9.1/10.1 refers to chair conformer 1 of each intermediate.
| Energy | Molecule 9.1 (kcal/mol) | Molecule 10.1 (kcal/mol) |
|---|---|---|
| Bond Stretching | 2.7846 | 2.6205 |
| Angle Bending | 16.5412 | 11.3392 |
| Stretch-bend | 0.4304 | 0.3432 |
| Torsional | 18.2512 | 19.6723 |
| Non-1,4 VDW | -1.5524 | -2.1622 |
| 1,4 VDW | 13.1093 | 12.8722 |
| Dipole-Dipole | -1.7248 | -2.0023 |
| Total | 47.8395 | 42.6828 |
The difference in total energy between these two molecules is 5.1567 kcal/mol. Upon observation of the contributions, it can be seen that each are very similar for the 2 conformers however this difference arises from the angle bending parameter, where molecule 10.1 is 5.202 kcal/mol lower in energy. This means that the bond angles present in isomer 9.1 are deviated further from ideality than in 10.1. The optimal angle around an sp3 hybridised carbon atom is 109.5o. After thorough analysis of all bond angles in the 2 intermediates, the angle around the α carbon, to the carbonyl group, closest to the CMe2 bridge was shown to have the biggest difference between the molecules. For 9.1 this angle was 123.2o and for 10.1 it was 118.8o, both molecules are therefore strained, with 9.1 generating the most strain. Conclusively if the reaction is under thermodynamic control, atropisomer 10 would be the predominantly formed intermediate during the reaction.
Olefin strain energy is the difference between the strain energy associated with a particular olefin and this energy of its parent hydrocarbon. Using this parameter the stability and reactivity of olefins containing a bridge head, for example molecules 9 and 10, can be predicted [3]. When an olefin experiences less strain than its parent hydrocarbon, due to its location adjacent to a bridgehead, it can be classed as a hyperstable olefin. The lower strain results in higher stability and low reactivity [3][4]. The parent alkanes of Compound 9 Chair 1 and Compound 10 Chair 1 were modelled using ChemBio3D and the angles at the bottom of the bridgehead, where the double bond previously existed, were analysed. The results are displayed in Table 5.
| Compound 9 | Compound 10 | |
|---|---|---|
| Total Energy (kcal/mol) | 57.2994 | 51.3563 |
| Bond Angle | 117.2o | 119.9o |
The difference in total energy between the 2 bridgehead olefins and their parent hydrocarbons is ~10 kcal/mol in each case, with the olefin derivatives being more stable. The hybridisation of the alkanes is sp3, therefore the optimal angle being 109.5o. From the table it is clear to see the alkanes have unfavourable bond angles, and therefore experience strain. These observations allow the classfication of molecules 9 and 10 as hyperstable alkenes, and explain the unreactivity and slow speed of functionalising the double bond.
References
- ↑ H. Han, J. Zou, X. Zhang, L. Wang, L. Wang, Applied Catalysis A: General, 367, 2009, 1–2, 1 Pg 84–88
- ↑ 2.0 2.1 J. Zou, X. Zhang, J. Kong, L. Wang, "Hydrogenation of Dicyclopentadiene over amorphous nickel alloy catalyst SRNA-4", Fuel, 87, 2008, 17–18, Pg 3655–3659. DOI:10.1016/j.fuel.2008.07.006
- ↑ 3.0 3.1 W. F. Maier, P. Von Rague Schleyer,"Evaluation and prediction of the stability of bridgehead olefins", J. Am. Chem. Soc., 1981, 103, 1891. DOI:10.1021/ja00398a003
- ↑ A. B. McEwen , P.V.R. Schleyer,"Hyperstable olefins: further calculational explorations and predictions", J. Am. Chem. Soc., 1986, 108 (14), pg 3951–3960. DOI:10.1021/ja00274a016
Spectroscopic Simulation using Quantum Mechanics: Part 1
Compound 17 and 18, displayed in figure 4, are Taxol intermediates that are derivatives of compounds 9 and 10 respectively, shown in the previous section. Usefully, it is possible to use quantum mechanics to predict the characteristic NMR spectra of the compound. To do this, compound 18 was chosen as its related compound, 10, is more stable than compound 9. The literature has reported the compounds NMR data, namely 1H and 13C NMR[1] that can be used for comparison.
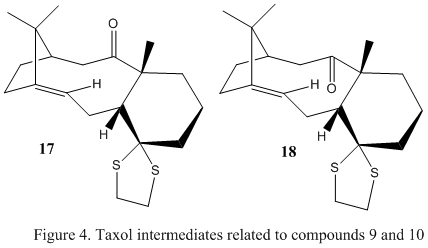
Molecule 18's structure was modelled using ChemBio3D and its energy was minimised to obtain its stable geometry. As with compounds 9 and 10 in the previous section, there were 2 low energy conformations calculated, both corresponding to a chair conformation of the substituted cyclohexane ring, Compound 18 Chair 1 and Compound 18 Chair 2. Chair 1 is ~4 kcal/mol lower in energy than chair 2, making it the more stable conformation. Additionally a low energy boat conformation was also obtained, however a preliminary assumption that the literature would report for the lower energy chair conformations, was made. Similarly to the analysis of compounds 9 and 10, from the models you can see that the lower energy chair in both molecules is the one where the β carbon, to the carbonyl group, in the six membered ring is facing the opposite direction the the carbonyl group, and the higher energy conformer corresponds the same carbon pointing in the same direction as the carbonyl functional group. Chair 1 was chosen for the NMR analysis which was carried out using Gaussian. This decision was made on the assumption that the literature[1] would report for the most stable molecule. The chemical shift results are tabulated in Table 6 alongside the literature values. The literature 1H NMR was carried out at 300MHz in C6D6 and the 13C NMR at 75MHz in C6D6.

| Literature Values[1] | Computed Values[2] | ||
|---|---|---|---|
| Chemical Shift (ppm) | Multiplicity and Integration | Chemical Shift (ppm) | Multiplicity and Integration |
| 5.21 | m, 1H | 5.97 | 1H |
| 3.00 - 2.70 | m, 6H | 3.19 | 2H |
| 2.70 - 2.35 | m, 4H | 3.06 | 1H |
| 2.20 - 1.70 | m, 1H | 2.96 | 1H |
| 1.58 | t, 1H, J = 5.4Hz | 2.77 | 3H |
| 1.50 - 1.20 | m, 3H | 2.65 | 1H |
| 1.10 | s, 3H | 2.48 | 3H |
| 1.07 | s, 3H | 2.33 | 1H |
| 1.03 | s, 3H | 2.22 | 1H |
| 2.00 | 3H | ||
| 1.84 | 1H | ||
| 1.58 | 4H | ||
| 1.27 | 3H | ||
| 1.20 | 1H | ||
| 0.96 | 3H | ||
| 0.63 | 1H | ||
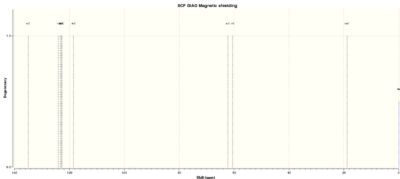
Upon observation of the table and spectrum above, one can see that the literature values for the compound under question does not match up very well with the chair conformation modelled. The multiplet reported in the literature at 5.21ppm appears at a much higher shift of ~6ppm in the computed value. Additionally, the remaining peaks and integrations do not match up well within the ranges reported in the literature. With the lowest response for the computed NMR occuring 0.40ppm lower than that of the literature value.

| Literature Values[1] (ppm) | Computed Values (ppm)[3] |
|---|---|
| 211.49 | 212.22 |
| 148.72 | 148.07 |
| 120.90 | 120.14 |
| 74.61 | 94.11 |
| 60.53 | 60.42 |
| 51.30 | 54.88 |
| 50.94 | 54.20 |
| 45.53 | 49.69 |
| 43.28 | 49.14 |
| 40.82 | 46.77 |
| 38.73 | 41.79 (2C) |
| 36.78 | 38.74 |
| 35.47 | 34.13 |
| 30.84 | 33.65 |
| 30.00 | 28.16 |
| 25.56 | 26.46 |
| 25.35 | 24.55 |
| 22.21 | 22.62 |
| 21.39 | 21.72 |
| 19.83 |
For the 13C NMR data and spectrum above, the values from the table match up relatively closely, with the only larger deviations occuring where the literature value reported as 74.61ppm whereas the computed value read 94.11ppm. Another big difference is the lack of a signal in the computed simulation due to a signal occuring at 41.79ppm showing a degeneracy of 2. This difference indicates that the conformer reported in the chosen literature might not be identical to the conformer that was simulated using Gaussian. The literature value at 74.61ppm corresponds to the carbon atom bonded to the sulfur atom, and it is ~20ppm lower than the simulated value for the same atom. This difference is the most significant and is probably due to the mass difference of the heavy atom sulfur which would subsequently affect the chemical shift of surrounding atoms. The Compound 18 Boat that was obtained during energy minimisation was run on Gaussian to obtain NMR. This was to see if the literature was reporting for this low energy conformation instead. The results are shown below.

| Literature Values[1] | Computed Values[4] | ||
|---|---|---|---|
| Chemical Shift (ppm) | Multiplicity and Integration | Chemical Shift (ppm) | Multiplicity and Integration |
| 5.21 | m, 1H | 5.28 | 1H |
| 3.00 - 2.70 | m, 6H | 3.32 | 1H |
| 2.70 - 2.35 | m, 4H | 3.22 | 1H |
| 2.20 - 1.70 | m, 1H | 3.12 | 2H |
| 1.58 | t, 1H, J = 5.4Hz | 2.86 | 2H |
| 1.50 - 1.20 | m, 3H | 2.45 | 1H |
| 1.10 | s, 3H | 2.40 | 1H |
| 1.07 | s, 3H | 2.28 | 3H |
| 1.03 | s, 3H | 2.09 | 1H |
| 1.97 | 2H | ||
| 1.85 | 2H | ||
| 1.68 | 2H | ||
| 1.62 | 1H | ||
| 1.50 | 2H | ||
| 1.41 | 1H | ||
| 1.35 | 1H | ||
| 1.16 | 1H | ||
| 1.07 | 3H | ||
| 0.96 | 2H | ||
Additionally the computational values for the modelled boat conformation, and the literature values for 13C NMR are shown below in table 9, for comparison.

| Literature Values[1] (ppm) | Computed Values[5] (ppm) |
|---|---|
| 211.49 | 211.83 |
| 148.72 | 148.67 |
| 120.90 | 118.84 |
| 74.61 | 89.09 |
| 60.53 | 67.89 |
| 51.30 | 56.11 |
| 50.94 | 55.60 |
| 45.53 | 50.11 |
| 43.28 | 48.20 |
| 40.82 | 44.22 |
| 38.73 | 42.04 |
| 36.78 | 37.59 |
| 35.47 | 35.31 |
| 30.84 | 31.05 |
| 30.00 | 28.85 |
| 25.56 | 28.66 |
| 25.35 | 25.74 |
| 22.21 | 26.26 |
| 21.39 | 23.39 |
| 19.83 | 21.05 |
Comparing all the data above, the values for both types of NMR simulated for the boat conformer match up relatively closely to the literature values obtained experimentally. They follow the same general trend, however there are some subtle and quite large difference that rarely occur. For example, in the 13C NMR, the shift at 74.61ppm from the literature corresponds to the carbon atom that is bonded to the sulfur atom. The predicted value for this shift occurs at 89.09ppm which is a large deviation. This could be the result of the mass of sulfur which is heavier than other atoms present in the molecule so would affect the the charge experienced during NMR.
Comparisons of the simulated values for both conformations and the literature values sees the 13C NMR for the chair conformation match up more closely than that of the chair conformation and for the 1H NMR, the boat simulated values match up more closely than the chair conformer. Overall, the chair and boat conformations do not differ that significantly in their NMR chemical shift values.
References
Analysis of the Properties of the Synthesised Alkene Epoxides: Part 2
Crystal Structure Analysis of Epoxidation Catalysts
Epoxidation of alkenes can be catalysed by 2 catalysts, the Shi Fructose catalyst (22) and the Jacobsen catalyst (23), shown in figure 5 in their pre-catalyst forms before reaction to their catalytically active forms. The active form of the Shi Fructose catalyst involves the conversion of the keton moiety to a dioxiranes and it is highly selective towards trans alkenes. The active form of the Jacobsen catalyst involves the conversion of the Mn-Cl bond to a Mn=O bond and it is highly selective towards cis alkenes. The aim of this part of the experiment was to model the 2 pre-catalysts and analyse and discuss certain structural features.
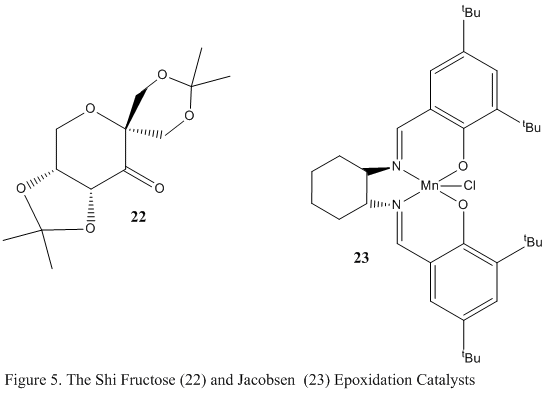
The Shi Fructose Pre-catalyst
The above molecule 22 was searched for using the Conquest program in the Cambridge Crystal Database (CCDC) and its structure was viewed using Mercury. The program was used to measure particular bond lengths within the model to explain conformation and stability. The interactive jmol below shows these features.
ShiPrecatalyst |
The analysed sections have been highlighted green for identification purposes. Upon analysing the anomeric centre that is situated in the 6 membered ring, it is clear that there is no anomeric interaction occuring. This is evidenced by the almost identical bond lengths of 0.142 and 0.141nm. There is no stabilising interaction taking place, therefore the bond lengths here are the same. The same effect is seen in one of the 5 membered ring where the bond lengths are nearly identical, taking the values of 0.143 and 1.144 nm. The anomeric centre located in the opposite 5 membered ring however, does show anomeric interactions. The bond lengths here are 0.141 and 0.146nm. The difference in these bond lengths arises due to antiperiplanar alignment of the lone pair on the oxygen atom with the σ*C-O orbital adjacent to it. This allows a good overlap of the orbitals which allows donation of electron density from nO into the antibonding σ*C-O orbital, resulting in subsequent shortening and lengthening of the respective bonds. The lack of this stabilising interaction in the 6 membered ring is probably due to the equatorial position of the 5 membered substituent, that is favourable as it is a sterically large group. It obtains this geometry to minimise the 1,3-diaxial repulsion that would be experienced had the substituent been located axially to the 6 membered ring. The equatorial positioning means the nO will not lie in the anomerically favoured antiperiplanar positioning.
The Jacobsen Pre-catalyst
Conquest in Cambridge Crystal Database (CCDC) was also used to search for the compound 23 pre-catalyst. This was done so that the approach of the two adjacent t-butyl groups on the aromatic rings could be observed. The CCDC flagged up a structure which is shown below in the interactive jmol, along with its highlighted structural features.
JacobsenPrecatalyst |
For 2 hydrogen atoms to be within the attractive Van der Waals region, they must be within 2.40Å (1.20 x 2) of each other, otherwise significant steric clashing would occur subsequently destabilising a compound. In the Jacobsen pre-catalyst, the hydrogens from the tert-Butyl groups, which are highlighted in yellow, are 0.258nm apart. This therefore is within the attractive Van der Waals region, which effectively stabilises the molecule. The proximity of these groups also blocks the Mn-Cl functionality from this particular side of the molecule, hence the alkene to be epoxidised must approach the catalyst from the side where the cyclohexane ring is situated. This explains the selectivity of the Jacobsen catalyst towards cis configured substrates as this would lead to less steric hindrance.
Calculated NMR Spectra of the Products
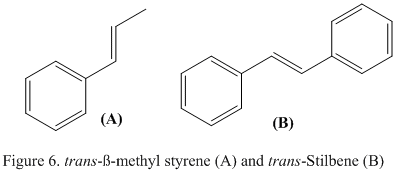
The alkenes substrates that have been chosen to undergo epoxidation are trans-β-methyl styrene and trans-Stilbene. The structures of these compounds is shown in figure 6. The 1H NMR and 13C NMR of the products of the epoxidation, methylstyrene oxide and stilbene oxide, were simulated using identical methods as the NMR simulation for the Taxol intermediate. Their geometries were optimised using the MM2 force field and then Gaussian was used to compute their predicted NMR spectra.
Stilbene Oxide NMR
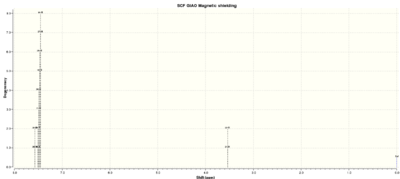
Stilbene oxide was modelled and the 1H NMR data and spectrum is shown below.
| Literature Values[1]. | Computed Values[2] | ||
|---|---|---|---|
| Chemical Shift (ppm) | Multiplicity and Integration | Chemical Shift (ppm) | Multiplicity and Integration |
| 7.45-7.26 | m, 10H | 7.57 | 2H |
| 3.86 | s, 2H | 7.47 | 8H |
| 3.54 | 2H | ||
From these results, it can be seen that the simulated proton NMR spectra matches relatively closely to the results found experimentally within the literature. The range showing response from 10H in the literature at 7.45-7.26ppm is only 0.1 ppm out of range in the computed values. Conclusively I believe the correct minimal geometry was modelled for this compound.
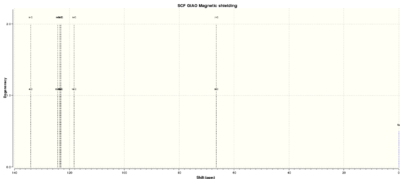
Table 11 shown below displays the simulated and literature values for the 13C NMR.
| Literature Values[3] (ppm) | Computed Values[4] (ppm) |
|---|---|
| 136.99 | 134.09 |
| 128.44 | 124.22 |
| 128.44 | 123.52 |
| 128.19 | 123.21 |
| 128.19 | 123.07 |
| 125.40 | 118.26 |
| 62.81 | 66.43 |
For this spectrum the computed values for the chemical shift do not match as closely as the 1H NMR do, to the literature values. The general range however is relatively similar and the differences only ever occur between ~4-7ppm. From these observations, it can be concluded that the differences in NMR between the 2 sets of data arises due to minor conformational changes in the the modelled compound that was submitted to Gaussian, not any drastic changes than may have seen a different isomer.
β-methyl styrene Oxide NMR
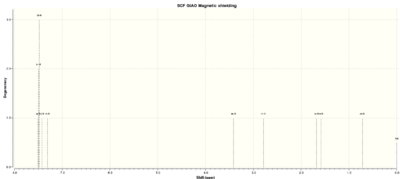
β-Methyl Stryene oxide was modelled using ChemBio3D and its energy was minimised using the MM2 force field. Subsequently Gaussian was used to simulate its predicted NMR spectra. The 1H NMR data and spectrum is shown below.
| Literature Values[5] | Computed Values[6] | ||
|---|---|---|---|
| Chemical Shift (ppm) | Multiplicity and Integration | Chemical Shift (ppm) | Multiplicity and Integration |
| 7.40-7.20 | m, 5H | 7.49 | 3H |
| 3.57 | d 1H J = 2.1 | 7.42 | 1H |
| 3.03 | q,d 1H J = 5.1, 2.1 | 7.31 | 1H |
| 1.45 | d 3H, J = 5.1 | 3.41 | 1H |
| 2.79 | 1H | ||
| 1.68 | 1H | ||
| 1.59 | 1H | ||
| 0.72 | 1H | ||
Comparing the literature values to the computational values above you can see they are fairly similar. The range of shifts corresponding to 5 protons is 0.09ppm out of range for the computational experiment, which shows a close match. Other differences include particular separate shifts at the low end of the scale which correspond to singular shift in the literature. This means the protons which are, in reality, in the same environment, were not simulated as being in the same environment when the molecule was submitted to Gaussian. However this only applies to small conformational changes in the molecule, therefore the results still fit fairly well.
Table 13 shown below displays the simulated and literature values for the 13C NMR.
| Literature Values[7] (ppm) | Computed Values[8] (ppm) |
|---|---|
| 137.9 | 135.0 |
| 128.6 | 124.07 |
| 128.2 | 123.33 |
| 125.7 | 122.8 |
| 125.7 | 122.73 |
| 59.7 | 62.31 |
| 59.2 | 60.58 |
| 18.1 | 18.84 |
The values for the NMR shown above match up the most closely for this molecule, to the literature values determined experimentally. The differences seen only range for ~4-5ppm and therefore, reasoning that the molecule submitted was not the correct geometry can be ruled out. Simulating the NMR spectra of these molecules in the way that has been done above can not aid at all in assigning the absolute configuration of the compounds as the NMR spectra for the different configurations are predicted to be around the same values. Other methods would have to be utilised.
Absolute Configuration Analysis of the Product
Using computational methods, the absolute configuration of compounds can be assigned. Different methods are trialed and outlined below.
Calculating the Chiroptical Properties of Stilbene Oxide
It is possible to use computational methods to compute the optical rotations for the inputted models. The calculations were carried out using the Gaussian program and the optimised output files previously used to compute the NMR spectra. The wavelength of light used in these simulations was 589nm, and the HPC was used to run the final calculations. The results for Stilbene Oxide are shown below.
| Stilbene Oxide | trans-β-methyl styrene Oxide | |
|---|---|---|
| Computed ORP (deg) | 233.82[9] | -76.56[10] |
| Literature ORP (deg) | 239.2[11] | - |
Unfortunately no literature value for the optical rotation of trans-β-methyl styrene oxide was obtained as they all varied across such a range with both positive and negative contributions, which meant the data just simply became unreliable. For the optical rotation of stilbene oxide, the literature value shows relatively good agreement with the computed ORP, and this corresponds to the (R,R)-stilbene configuration.
Properties of the Transition State of Reaction
The following experiments were carried out to confirm which isomer of trans-β-methylstyrene oxide ((R,R) or (S,S)) is formed in enantiomeric excess when trans-β-methylstyrene undergoes epoxidation using the Shi Fructose Catalyst and the Jacobsen Catalyst. To do this, the transition states which are envisaged for the reaction with each catalyst were modelled to calculate their relative free energies, as a sum of the electronic and thermal energies. Using this information the difference in free energy was calculated and this was used to work out the equilibrium constant for the 2 enantiomers using the formula: ΔG=-RTlnK. Once this was calculated, K was used to determine the enantiomeric excess of the reaction.
The Shi Fructose Catalyst Transition State
Using this particular catalyst allows prediction of 8 different transition states across both enantiomers. They corresponds to factors including, which enantiomer is foremed, which is determined by which side of the alkene aprroaches the catalyst, which of the dioxirane oxygen atoms is transferred and attacks the alkene. This choice arises due to the inequivalence of the 2 O atoms as they lie planar to the rest of the molecule. Lastly, because the fructose catalyst contains ring structures of its own, there is a transition state corresponding to where the phenyl ring of the alkene takes an endo or exo approach to the fructose. The information for the 8 transition states was obtained for both entantiomers, (R,R) and (S,S), (4 for each enantiomer). The energy difference was calculated using the transition state with the lowest free energy value for each enantiomer. The transition state with the lowest free energy overall, and therefore the most likely one, occured for the (R,R) enantiomer. The results are tabulated below.
| ΔG (R,R) to (S,S)(kj/mol) | K Constant | Enantiomeric Excess (%) |
|---|---|---|
| -20.218977 | 3500.996761 | 99.94 |
The equilibrium constant determined is very large and therefore the process of (R,R) to the (S,S) configuration conversion is largely favoured. This is also reflected in the enantiomeric excess percentage of 99.94% which means the reaction proceeds favouring the (S,S) configuration of trans-β-methylstyrene oxide.
The Jacobsen Catalyst Transition State
For this Manganese based catalyst, there are only 4 envisaged transition states for the reaction where the Mn=O oxygen is transferred to form the oxide of the alkene. The transition states correspond to whether the (S,S) or (R,R) configuration is formed during the reaction and whether the substrate aprroaches the catalyst in an exo or endo fashion, as the catalyst approaches planar in structure and contains aromatic rings of its own. The information for the 4 transition states was obtained for both entantiomers, (R,R) and (S,S), (2 for each enantiomer). Once again the energy difference was calculated using the transition state with the lowest free energy value for each enantiomer. The transition state with the lowest free energy overall, and therefore the most likely one, occured for the (S,S) enantiomer. The results are tabulated below.
| ΔG (S,S) to (R,R)(kj/mol) | K Constant | Enantiomeric Excess (%) |
|---|---|---|
| -21.363695 | 5557.119507 | 99.96 |
Here the equilibrium constant obtained is also very large indicated the favoured process of conversion from (S,S) to (R,R) enantiomers. The (R,R) enantiomeric excess of 99.96 also highlights this configuration as favoured.
Investigating the non-covalent interactions in the active-site of the reaction transition state
In order to explore the transition state for these reactions further, a non-covalent interaction (NCI) analysis can be carried out on the particular model. The computation allows the observation of these interactions, namely electrostatic, hydrogen bonding and close-approach dispersion interactions, which are present in the transition state. With this image the mechanism of reaction can be further understood. This analysis was carried out upon the Shi catalysed epoxidation of (R,R)transβ-methyl styrene transition state. The resulting model is shown below.
Orbital |
Firstly, there is a significant amount of non-covalent interactions in the transition state model shown above. The majority of these, coloured green, are mildly attractive, which would cause stabilisation of the transition state. They occur between non charged moieties therefore they are consistent with being attractive Van der Waals forces. In the center of the 2 5 membered rings there is a small iso-surface which is red in colour. This corresponds to a repulsive interaction which is occuring between the 2 oxygen atoms incorporated in the ring, more specifically between their lone pairs. This interaction would destabilise the transition state, however due to the low energy of the transition state, the Van der Waals interactions, in green, are causing a stabilisation that outcompetes the destabilisation caused by the replusion between the lone pairs. The interaction shown between one of the dioxirane oxygen atoms and the center of the alkene substrate, forms a ring. This indicates the region where a bond is forming during the reaction. It contains a red interaction, which takes the form of a repulsion most likely between the lone pair on the dioxirane oxygen and the pi-electron cloud from the double bond, and a blue interaction which corresponds to a very attractive force which is the driving force for the completion of the reaction.
Investigating the Electronic topology (QTAIM) in the active-site of the reaction transition state
Using the same transition state as above, QTAIM analysis was carried out to identify the Bond Critical Points, BCP, which is where the first derivative of the electron density equals 0. This will give an idea of where there is high electron density build up in the molecule. In the QTAIM diagram below, the areas where the electron density lies is represented by a small yellow sphere. This type of analysis goes hand in hand with NCI analysis because NCI will show which electron dense areas are related to an attractive or repulsive force.
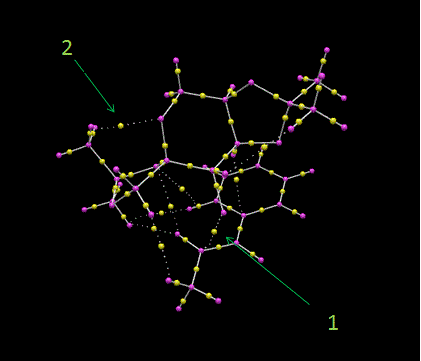
The most important interaction shown here is labelled number 1. It corresponds to electron density lying between the one of the dioxirane oxygen atoms and the alkene substrate, in a region where the epoxide will end up. Other interactions also occur between the substrate and the catalyst, one of which is highlighted as number 2. This is an interaction between a carbon from the alkene phenyl group and a hydrogen from a methyl group on the catalyst. From the NCI analysis in the previous section, these additional interactions were coloured green to indicate the weakly attractive dispersion forces that stabilise the transition state as a whole. With respect to the already present covalent bonds in the alkene and catalyst themselves, the yellow region of electron density lies closest to the more electronegative atom that makes up the bond. In the case of a C-H bond, this would be the H atom and with a C-O bond, this would obviously be the O atom.
New Candidates for Investigation
As a new candidate investigations of the above nature, I have chosen (2S,3R)-2,3-epoxy-2-methyl-1,4-naphthoquinone shown in the figure below as compound X. It is an ideal candidate as its ORP is larger than 300, with a value of 356 deg[12] and a molecular weight of 188.183.
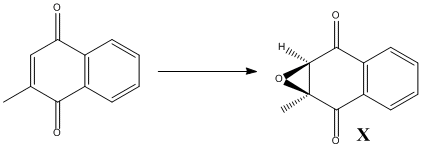
The only drawback is that the molecule is not commercially available, neither is its precursor prior to epoxidation. Therefore it would have to be synthesised in reality.
References
- ↑ R. W. Murray, M. Singh,Organic Syntheses, 1997, 74, 91
- ↑ R. W. Murray, M. Singh,Organic Syntheses, 1997, 74, 91
- ↑ Z. Wang, L. Shu, M. Frohn, Y. Tu,Y. Shi,Organic Syntheses, 2003, 80, 9
- ↑ Z. Wang, L. Shu, M. Frohn, Y. Tu,Y. Shi,Organic Syntheses, 2003, 80, 9
- ↑ S. E. Denmark, H. Matsuhashi, "Chiral Fluoro Ketones for Catalytic Asymmetric Epoxidation of Alkenes with Oxone", J. Org. Chem., 2002, 67 (10), 3479–3486 DOI:10.1021/jo020050h
- ↑ A. Berkessel, M. Guixà, F. Schmidt, J. M. Neudörfl, J. Lex, "Highly Enantioselective Epoxidation of 2-Methylnaphthoquinone (Vitamin K3) Mediated by New Cinchona Alkaloid Phase-Transfer Catalysts", Chemistry - A European Journal, 2007, 13, 16, 4483–4498 DOI:10.1002/chem.200600993
