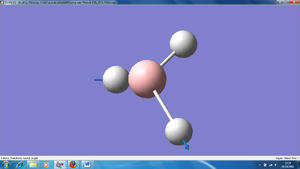
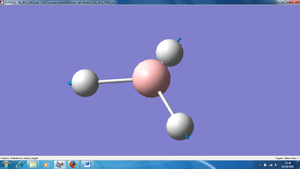
Rep:Mod:BYL109 module 2
BH3
Optimisation
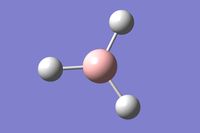
This module starts with the creation of the molecule BH3 in the Gaussview 5.0 program, which had its bond lengths altered to 1.5Â, before being optimised. Optimisation is the process of defining and analysing the positions of the nuclei and electrons, partially using Schrodinger's equation, to attempt to find the lowest energy geometry of a molecule, i.e. its most stable structure in gas-phase. The results of the optimisation, using the B3LYP method and 3-21G basis set, are shown in Table 1 below:
| File Type | .log |
| Calculation Type | FOPT |
| Calculation Method | RB3LYP |
| Basis Set | 3-21G |
| Charge | 0 |
| Spin State | Singlet |
| E(RB3LYP) | -26.46 (a.u.) |
| Gradient Norm | 0.0002 (a.u.) |
| Dipole Moment | 0.00 (Debye) |
| Point Group | D3H |
| Job Time | 6.0 (sec) |
Two methods were used to confirm that the optimisation of the molecule was complete. The first was to ensure, as seen in Table 1, that the gradient is less than 0.001. This means that it has been fully optimised. The second was to check the full convergence of the molecule by looking in the Gaussian output file, which affirmed that convergence had indeed occurred with the 'YES' seen. This proof is shown in the Figure 1 below:
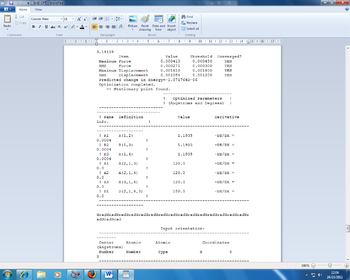
Figure 1: Proof of convergence image
The optimised molecule then had the following data:
Bond length - 1.19 Â
Bond angle - 120°
The bond angle is expected as from the VSEPR theory for a trigonal planar molecule. The literature bond length is 1.19Â[1], which is very close to the optimised length seen above. This would indicate that optimisation of the molecule was accurately performed with the Gaussview program, resulting in the most stable gas structure possible.
These are the optimisation plots recorded from the results: 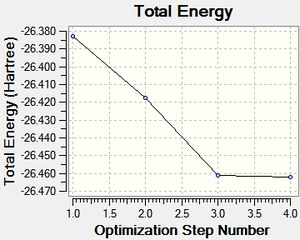
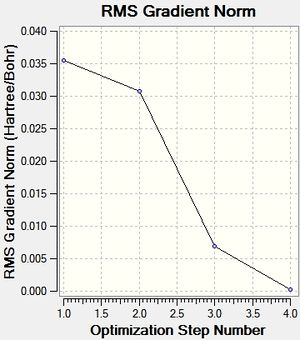
Two plots were calculated, the first showing the energy of the molecule at each step of optimisation, the second showing the gradient of the energy at each step. The more steps that are seen in the plots, the more accurate the low energy molecule will be in terms of finding its most stable geometry. Interestingly, apart from the final step, all the bonds were not present in the molecule during the animation for each of the optimisation steps. This links to the definition of what makes a bond, which is discussed later in the TIBr3 section.
Vibrational Analysis
Vibrational analysis allows for an infrared spectra to be formed, as well as confirming that full optimisation has occurred by providing information on the second derivative of a potential energy surface (PES). A ground state point, i.e. the lowest energy point, is only indicated if all the frequencies analysed are positive. This information can be used when looking at the lowest frequencies obtained from the data. For the results from the vibrational analysis, which used the same method and basis set as the optimisation, this is shown in Tables 2 and 3:
| File Type | .log |
| Calculation Type | FREQ |
| Calculation Method | RB3LYP |
| Basis Set | 3-21G |
| Charge | 0 |
| Spin State | Singlet |
| E(RB3LYP) | -26.46 (a.u.) |
| Gradient Norm | 0.0002 (a.u.) |
| Dipole Moment | 0.00 (Debye) |
| Point Group | C3H |
| Job Time | 11.0 (sec) |
Table 3 is more specific to the IR frequencies obtained for the molecule:
Infrared (IR) Spectrum
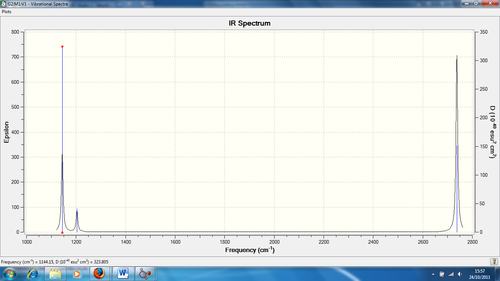
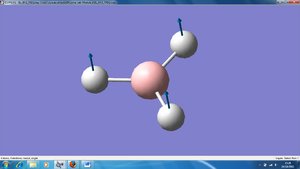
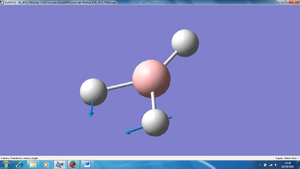
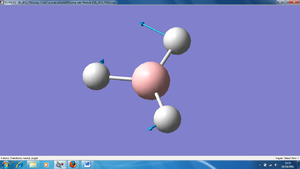
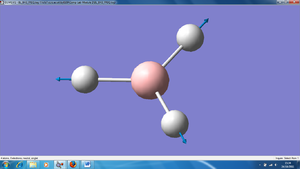
The 3N-6 rule indicates how many vibration modes are expected for this spectrum, which is 6. As seen from the spectrum, there are only 3 peaks. Despite having 6 vibration modes as seen in Table 3, this can be explained by the following:
1) There are degenerate frequencies for pairs 2, 3 and 5, 6. This results in both pairs appearing as one peak each.
2) For vibration 4, there is an intensity of zero so it doesn't show in the spectrum. This is due to the lack of dipole moment related to the symmetry of the molecule (a1' symmetry)
Molecular Orbitals
Molecular orbital theory uses mathematical functions to describe the behaviour of an electron in a molecule. Formed from a combination of atomic orbitals (c.f. LCAO theory from Dr Hunt's 2nd Year course), it is now possible with the Gaussview program to confirm that the theory we have discussed can be utilised in accordance with the computational method of analysis.
Below are the molecular orbitals formed from the optimised molecule of BH3
 |
 |
 |
 |
 |
 |
 |
 |
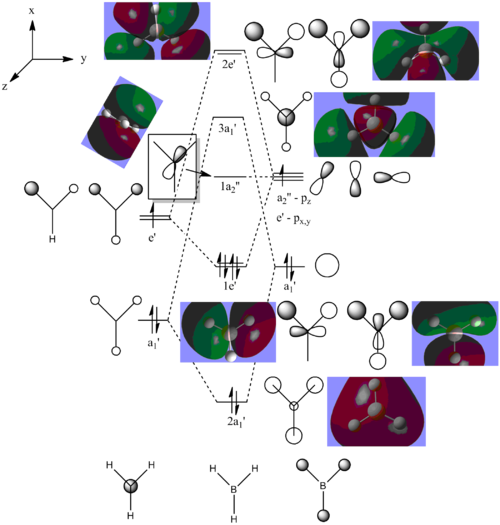
Figure 2: MO Diagram of BH3
A link to the MO calculation file can be seen here: DOI:10042/to-9684
All the MOs of BH3 which were computed using Gaussview have been included in the Figure 2, apart from MO 1, which was excluded from the diagram as its 1a1' energy level was also exlcuded from the diagram. The real and LCAO MOs match well with each other, however once we reach the LUMO and any higher energy levels, the calculated MOs seem to distort slightly. This could be due to the fact that since these energy levels are unoccupied.
Overall, the computational method of configuring MOs is quite accurate and can be used with the theory we have learnt before about molecular orbitals. However, for more complicated molecules which contain more diffuse orbitals, this can lead to complicated MO diagrams and therefore the likeliness of differences between theoretical and experimental data will increase.
NBO Analysis

Analysis of the natural bond orbital will confirm, using colouring in the molecule, what we know about the Lewis acid property of the BH3 molecule. The image on the right shows equal charge distribution to each of the hydrogens (charge of -0.093), with the red signifying negative charge, whilst the boron (charge of 0.278) is green signifying positive charge. The charges are also listed under the section 'Summary of Natural Population Analysis' section in the output file.
Other sections from the output file of the calculation tells us of a few more significant details, for example, the image below (Figure 3) shows what was under the 'Bond orbital/Coefficients/Hybrids' section:
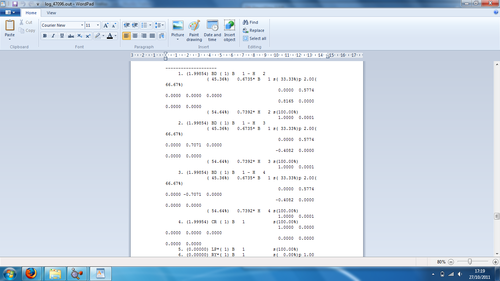
Figure 3: Example of NBO Analysis Output file section
The first three bonds show that 45.36% of the bond is contributed from the boron orbitals (hybridisation 33.3%s and 66.6%p), whilst 54.64% of the bond comes from the hydrogen orbital (hybridisation 100%s). Therefore the boron has formed 3 sp2 hybrid orbitals which interact with the s AO of one hydrogen atom. The fourth orbital shows the core 1s AO of the boron, whilst the fifth orbital is the boron lone pair. The section for Second Order Perturbation Theory Analysis of Fock Matrix in NBO Basis did not show anything of importance for the BH3 molecule, as this shows information related to molecules which incur mixing.
TIBr3
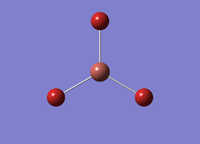
Optimisation
After first creating this molecule, the molecule was optimised using the DFT-B3LYP procedure with the LANL2DZ basis set. This basis set is a pseudo-potential which allows us to analyse molecules with heavier elements, which other methods cannot analyse. The results from the optimisation are as follow:
| File Type | .log |
| Calculation Type | FOPT |
| Calculation Method | RB3LYP |
| Basis Set | LANL2DZ |
| Charge | 0 |
| Spin State | Singlet |
| E(RB3LYP) | -91.22 (a.u.) (2dp) |
| Gradient Norm | 9 x 10⁻⁷ (a.u.) |
| Dipole Moment | 0.00 (Debye) |
| Point Group | D3H |
| Job Time | 27.0 (sec) |
The data from the optimised TIBr3 data:
Bond length - 2.65Â
Bond angle - 120°
Again, the bond angle is as expected for a trigonal planar molecule. The literature value for the bond length is 2.62Â[2]which is fairly close to the value listed above. This again would indicate that optimisation of the molecule was successful, since having obtained near accurate literature values.
File for the optimisation of this molecule: DOI:10042/to-9962
Vibrational Analysis
The vibrational analysis was also carried out for the optimised version of this molecule, with the results in Table 5 below. The same method and basis set was used as with the optimisation. This is because the alteration of the basis set, leading to a change in the pseudo-potential, could have meant the calculation not running to completion or taking a longer amount of time. The pseudo-potential used was practical for this molecule, with both thallium and bromine being heavier elements, the lack of pseudo-potential would have resulted in the Schrodinger equation not taking into account realistic activity that would have occurred with this 'heavier' molecule.
A frequency analysis was again computed to obtain the IR spectrum (see below), as well as confirm optimisation through the results of the data of the second derivative of the PES. All the frequencies being positive indicates a ground state is present in the PES, which therefore confirms having minimal energy structures.
| Number | Frequency | Intensity | Symmetry D3H point group symmetry |
|---|---|---|---|
| 1 | 46 | 3.69 | a2 |
| 2 | 46 | 3.69 | e' |
| 3 | 52 | 5.85 | e' |
| 4 | 165 | 0.00 | a1' |
| 5 | 211 | 25.48 | e' |
| 6 | 211 | 25.48 | e' |
Again using the 3N-6 rule, 6 vibrations are expected, but again 3 are seen in the spectrum.
1) There are degenerate frequencies for pairs 1, 2 and 5, 6. This results in both pairs appearing as one peak each.
2) For vibration 4, there is an intensity of zero so it doesn't show in the spectrum. This is due to the lack of dipole moment related to the symmetry of the molecule (a1' symmetry)
The IR spectrum for the TIBr3 can be seen here:
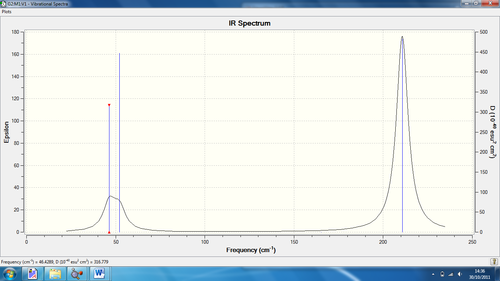
A link to the file for the optimisation of the molecule can be found here:
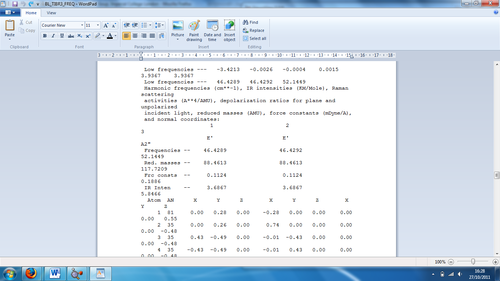
Figure 4: Low frequencies as seen from the output file
As seen from the image above, the lowest real normal mode is 46 cm-1, while the low frequencies for the molecule are -3.421, -0.0026, -0.0004, 0.0015 and 3.9367cm-1. There are no negative frequencies, which would suggest that the molecule has fully optimised.
What is a bond?
Going back to the result of the optimisation plots, as seen in both the BH3 and Mini Project section, this fundamental question needs to be answered first. A bond is a region which forms as a result of attraction between the electron densities of two atoms. A bond is therefore the structural link which defines this form of attraction. However, Gaussview did not show bonds till the final structure as it doesn't maintain that there is a bond present when the attractive force is diminished by distance. Therefore, whilst the bonding attraction was still present at all stages of optimisation, Gaussview didn't display the structural link between atoms until, based on its data, it believed the attraction to be strong enough to display.
Organometallic complex Mo(CO)4(PCl)2
Optimisation
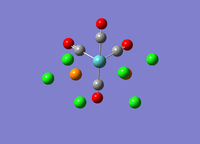

The cis and trans isomers of the complex were optimised using the DFT-B3LYP method, pseudo potential LANL2DZ and with the keyword 'opt=loose' to allow loose convergence.
The torsional angles of both isomers were altered on the Gaussview program to ensure that the lowest possible minima would be obtained for the results from the final optimisation, after changing the firstly optimised molecule accordingly. For the cis isomer, the torsional angles of 0° and 180° were used for the CO ligand-Mo-P-Cl bonds, whilst for the trans isomer, the angle of 0° was used (see thumbnail to the right).

| Cis Isomer | Trans Isomer | |
|---|---|---|
| File Type | .log | .log |
| Calculation Type | FOPT | FOPT |
| Calculation Method | RB3LYP | RB3LYP |
| Basis Set | LANL2DZ | LANL2DZ |
| Charge | 0 | 0 |
| Spin State | Singlet | Singlet |
| E(RB3LYP) | -623.58 (a.u.) | -623.58 (a.u.) |
| Gradient Norm | 0.00001 (a.u.) | 0.00001 (a.u.) |
| Dipole Moment | 1.31 (Debye) | 0.30 (Debye) |
| Point Group | C1 | C1 |
| Job Time | 1 hour 10 mins 10.6 secs | 46 mins 52.6 secs |
The results from the optimisation are seen here below, with some literature values not found. Th article used for referencing only contained information about the cis isomer. However, even after researching it online, as well as looking in the CRC Handbook (see References section), no trans data could be found.
| Molecule | Bond length (Â) | Literature value (Â)[3] | Bond angle (°) | Literature value (°)[4] |
|---|---|---|---|---|
| Cis Isomer | Mo-P 2.51 | 2.576 | P-Mo-P - 94.2 | 104.62 |
| Mo-C (axial) - 2.06 | 2.059 | C-Mo-C - 87.1 | 83.0 | |
| Mo-C (equatorial) - 2.01 | 1.973 | C-Mo-C - 178.4 | 174.1 | |
| Trans Isomer | Mo-P 2.44 | N/A | P-Mo-P - 177.4 | N/A |
| Mo-C (axial) - 2.06 | N/A | C-Mo-C - 179.0 | N/A | |
| Mo-C (equatorial) - 2.06 | N/A | C-Mo-C - 180.0 | N/A |
Despite not having data for the trans isomer, the data is in line with what is expected. The axial and equatorial bonds are the same length as that of the Mo-C axial bond of the cis isomer. The trans isomer no longer distinguishes between the Mo-C bonds in the trans isomer, so they are of the same length. They are also of the same bond angle, which is also expected for an octahedral complex to have 180° bonds trans to each other.
The energies as shown in Table 6 are -623.58 a.u. and -623.58 a.u. for the cis and trans isomer respectively, which can also be analysed as -1,637.201kJ/mol and -1,637.199kJ/mol. The energy difference is only 0.002 kJ/mol, which is a very small difference and can therefore not be used to decipher which is the more stable isomer. Depending on whether electronic or steric effects are more prominent in a molecule, this will determine which is the more stable. Theoretically the trans isomer, due to the bulk of the PCl3 ligands, should be the more stable if sterics override any electronic effects.
By altering the ligand to, for example triphenylphosphine (PPh3), the steric effects of the ligand would override the electronic effects, therefore making the trans isomer the more favourable isomer. However, if it is the cis isomer that is desired, changing the ligand to reduce the repulsive interactions experienced sterically can allow for the cis isomer to be the favoured product. This idea can be used with the computational analysis to direct which isomer the data can favour.
A link to the file for the cis isomer can be seen here: DOI:10042/to-9559
A link to the file for the trans isomer can be seen here: DOI:10042/to-9653
Vibrational Analysis
As with before, the vibrational analysis allowed us to view the IR spectrum. No negative frequencies are seen in either isomer, however low frequencies are obtained as seen in Table 9, which are discussed in this section. The same method and basis set are used as with the optimisation.
| Cis Isomer | Trans Isomer | |
|---|---|---|
| File Type | .log | .log |
| Calculation Type | FREQ | FREQ |
| Calculation Method | RB3LYP | RB3LYP |
| Basis Set | LANL2DZ | LANL2DZ |
| Charge | 0 | 0 |
| Spin State | Singlet | Singlet |
| E(RB3LYP) | -623.58 (a.u.) | -623.58 (a.u.) |
| Gradient Norm | 0.00001 (a.u.) | 0.00001 (a.u.) |
| Dipole Moment | 1.31 (Debye) | 0.30 (Debye) |
| Point Group | C1 | C1 |
| Job Time | 28 mins 51.0 secs | 28 mins 34.8 secs |
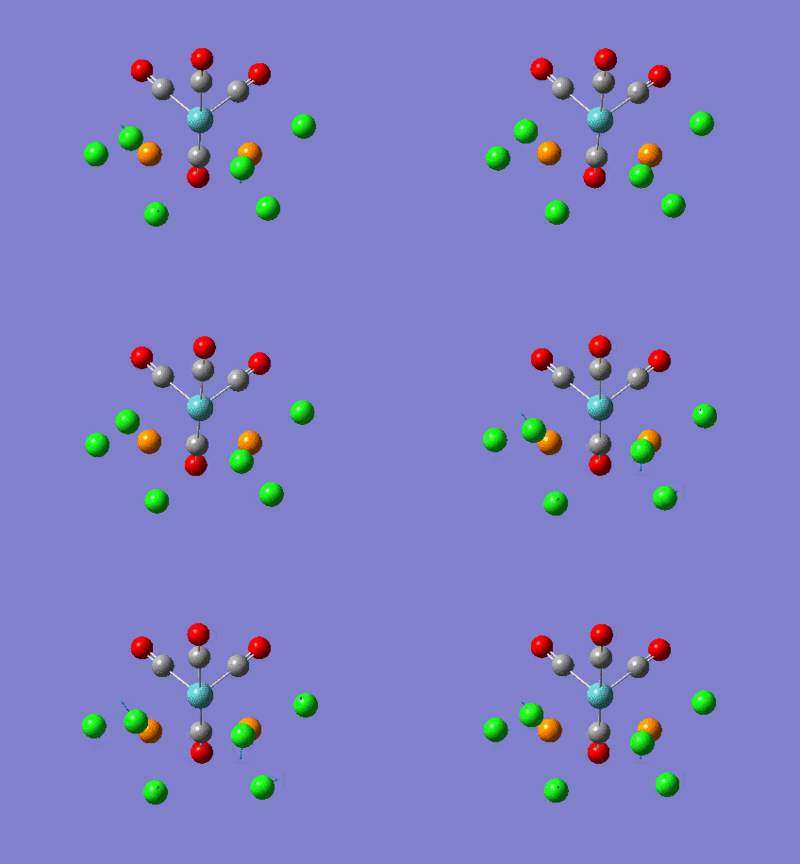
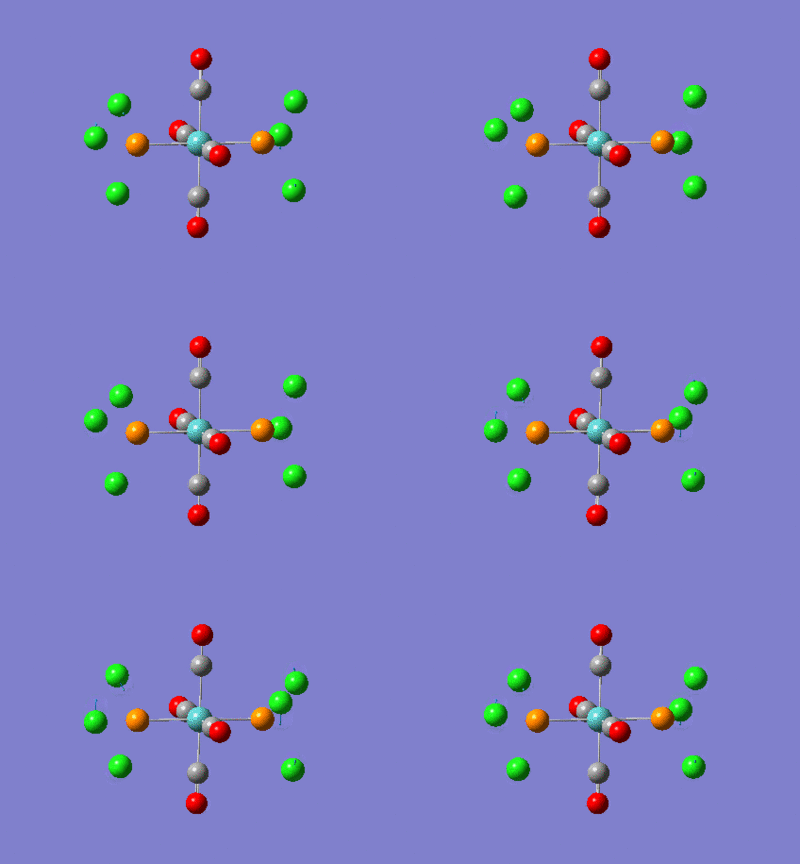
Table 9 below shows the lowest frequencies obtained (closest to zero) for the cis and trans isomers. Despite being at low frequency and very low intensity, these vibrations still occurred. This implies that these vibrations could have been induced thermally, even at room temperature, without the need for the infrared radiation.
| Image | Frequency (cm-1) - Intensity | |
|---|---|---|
| Cis Isomer | 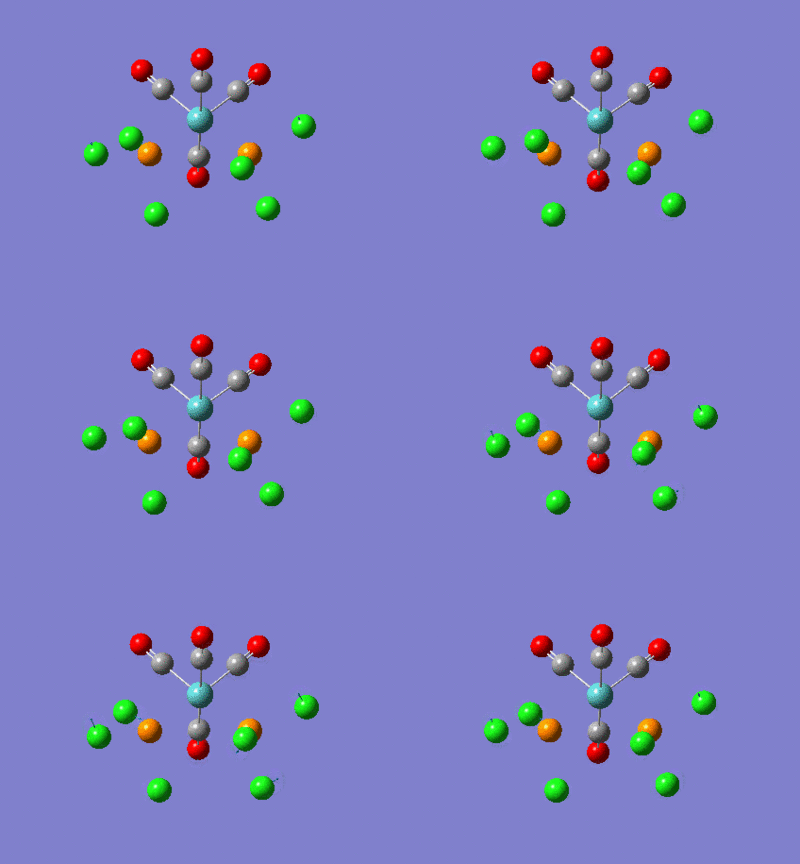 |
10 - 0.0265 |
 |
17 - 0.0073 | |
| Trans Isomer | 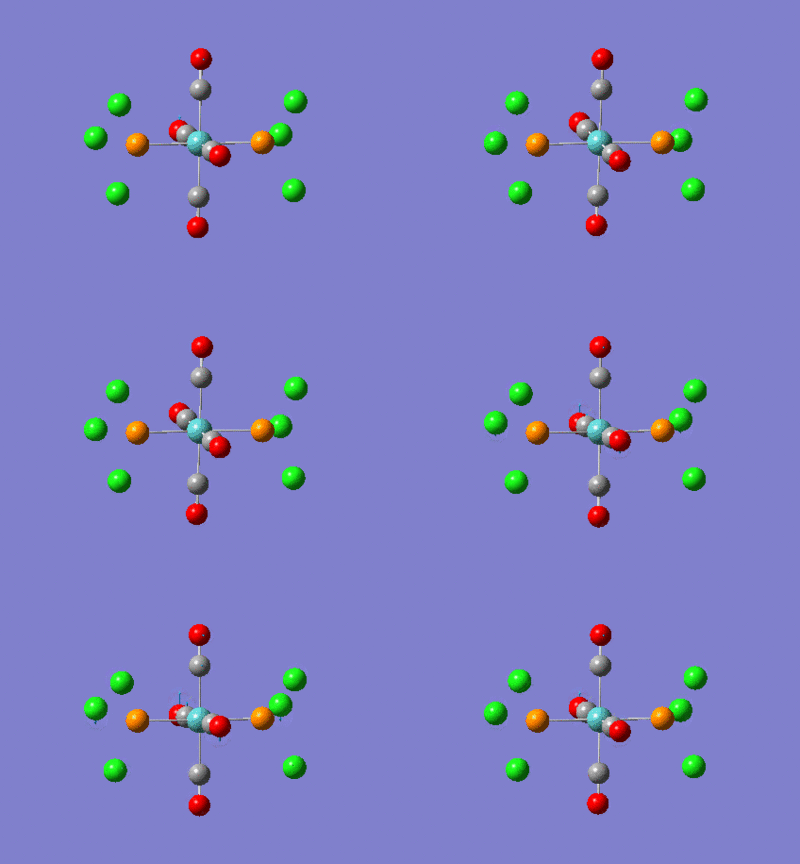 |
5 - 0.0942 |
 |
6 - 0.00 |
Now looking at the IR carbonyl frequencies, the results are shown in Table 10. For the cis isomer, there are 4 main vibrational modes of quite high intensity which result in 4 IR stretches as shown in the spectrum. However the trans isomer, despite having 4 vibrational modes, only has 1 peak in the spectrum. The values from Table 10 confirm this, with the first two vibrational modes being of the same frequency and therefore the same peak, whilst the other two are of too low an intensity to be seen in the spectrum. This is due to the symmetry of the molecule, whereby all four carbonyl ligands in the trans isomer as seen as equivalent, whilst the ligands in the cis isomer are not.
| Frequency - Intensity | Literature Values[5] | |
|---|---|---|
| Cis Isomer | 1945 - 763.06 | 1941 |
| 1949 - 1498.07 | 1948 | |
| 1958 - 632.41 | 1965 | |
| 2023 - 598.28 | 2049 | |
| Trans Isomer | 1950 - 1475.40 | 1943 |
| 1951 - 1466.78 | 1943 | |
| 1977 - 0.65 | ||
| 2031 - 3.78 |
A link to the file for the cis isomer vibrational analysis can be seen here: DOI:10042/to-9654
A link to the file for the trans isomer vibrational analysis can be seen here: DOI:10042/to-9655
Mini Project
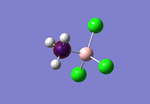
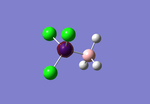
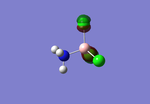
The Mini Project for this module shall focus on the interactions of amino boranes and their stability with a change of substituent, in this case the testing of chlorine interchanging with hydrogens. Therefore, the four molecules I will be looking at are NH3BH3, NH3BCl3, NCl3BH3 and NCl3BCl3. This can therefore test the effect of the Lewis acidity on the molecule, in terms of the position of the chlorine atoms in the molecule, which can be visually determined by looking at the MO diagrams. Ammonia borane has long been under scrutiny for its ability to store hydrogen, and in a reaction release said hydrogen, the latter being considered as an important fuel combatting our need for natural resources.[6]
Looking at the staggered conformations of the amino-borane like molecules, they will be analysed using the computational methods at our disposal.

Optimisation
At the suggestion of Dr Hunt, the molecules being of fairly simple structure were optimised using the B3LYP method and 6-311G(d,P) basis set. The results of which are shown in Table 11 below:
| NH3BH3 | NH3BCl3 | NCl3BH3 | NCl3BCl3 | |
|---|---|---|---|---|
| File Type | .log | .log | .log | .log |
| Calculation Type | FOPT | FOPT | FOPT | FOPT |
| Calculation Method | RB3LYP | RB3LYP | RB3LYP | RB3LYP |
| Basis Set | 6-311G(d,p) | 6-311G(d,p) | 6-311G(d,p) | 6-311G(d,p) |
| Charge | 0 | 0 | 0 | 0 |
| Spin State | Singlet | Singlet | Singlet | Singlet |
| E(RB3LYP) | -83.25 (a.u.) | -1461.95 (a.u.) | -1462.27 (a.u.) | -2840.96 (a.u.) |
| Gradient Norm | 0.00006 (a.u.) | 0.00004 (a.u.) | 0.00002 (a.u.) | 0.00006 (a.u.) |
| Dipole Moment | 5.52 (Debye) | 3.18 (Debye) | 6.76 (Debye) | 1.05 (Debye) |
| Point Group | C1 | C1 | C1 | C1 |
| Job Time | 1 mins 17.0 secs | 8 mins 49.2 secs | 4 mins 45.0 secs | 36 mins 2.6 secs |
Optimisation was confirmed for all the molecules as was carried out before for the other two molecules analysed. The first is seen in Table 10, with each of the gradients being less than 0.001. This means that it has been fully optimised. The second was to check the full convergence of the molecule by looking in the Gaussian output file, which affirmed that convergence had indeed occurred (The 'YES' as seen in the BH3 section of this module).

 Figure 5: Optimisation plots of ammonia-borane
On analysis of the optimisation plots, the graphs show a further two optimisation steps for the NH3BH3 when compared to that of the BH3 molecule, which obviously required less processes in order to find the most energetically stable form of the molecule.
Below in Table are the results for the optimised data:
| Molecule | Bond length (Â) | Literature value (Â)[7] | Bond angle (°) | Literature value (°)[8] |
|---|---|---|---|---|
| NH3BH3 | B-H - 1.21 | 1.23 | H-B-H - 113.6 | 114.6 |
| N-H - 1.02 | 1.04 | H-N-H - 107.8 | H-P-H - 101.3 | |
| B-N - 1.66 | 1.28 | |||
| NH3BCl3 | B-Cl - 1.84 | 1.74 | Cl-B-Cl - 113.4 | N/A |
| N-H - 1.02 | 1.04 | H-N-H - 108.7 | H-P-H - 101.3 | |
| B-N - 1.63 | 1.28 | |||
| NCl3BH3 | B-H - 1.20 | 1.23 | H-B-H - 115.8 | 114.6 |
| N-Cl - 1.80 | 1.76 | Cl-N-Cl - 107.5 | 107.1 | |
| B-N - 1.68 | 1.28 | |||
| NCl3BCl3 | B-Cl - 1.75 | 1.74 | Cl-B-Cl - 120.0 | N/A |
| N-Cl - 1.79 | 1.76 | Cl-N-Cl - 108.4 | 107.1 | |
| B-N - 3.02 | 1.28 |
From the table, the data can either be analysed as agreeing well with the literature values, or be explained by what is expected from VSEPR theory. For those literature values which could not be found, substitute data was used, as with for example H-N-H with H-P-H. Nitrogen and phosphorus, being of the same group but of slightly larger size, will only alter the bond length slightly, but the bond angles will remain the same for the molecule. For example, the H-N-H angle (107.8°) in ammonia-borane can be expected from VSEPR theory, normally with the angle of 107.5° for the same bond in ammonia alone. Another example is the Cl-B-Cl angle (120.0°), as expected for a trigonal planar BCl3 molecule. The larger discrepancy as seen for the B-N bond length can be understood with the lack of structural bond seen in the optimisation files (see 'What is a bond?' section), where the distance was deemed too far for the attractive force to be displayed through structural link. This could have lead to the larger than expected values when compared with the literature.
Looking at difference in relative energies, the data is as expected. The molecule which required the lowest energy before optimisation was that of ammonia borane. With the lack of chlorine atoms around the molecule, this made it sufficiently more easy to manipulate any bonds, which is in line with what the optimisation process is. The addition of 3 chlorine atoms into the molecule then results in a large jump in energy, with the energies for the second and third molecule only differing in 0.84 kJ/mol, which would suggest that the position of the three atoms either on the nitrogen or boron atom has little effect. The difference can be attributed to the pull of the chlorine atoms, being electron withdrawing groups, on the lone pair of the nitrogen. The atoms being on the actual atom, rather than on the boron, could result in a stronger effect on the electron density surrounding the molecule. Finally, looking at the molecule with all 6 chlorine atoms, the energy jumps again, as a result of the pull of the electron density on both the boron and nitrogen atoms.
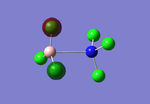
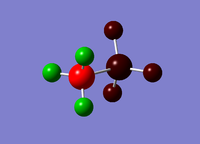
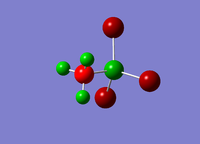
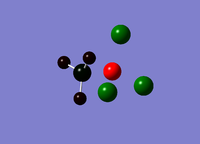
More unusually for the case of the B-N bond length in NCl3BCl3, the BCl3 and NCl3 show in figure 6 virtually no sense of bonding between the two molecules, with the potential 120° angles intact for the individual molecules but no angling between the two. The larger repulsion lead to this structure which show the boron and nitrogen atoms at a great distance leading to the discrepancy between literature values and the data.
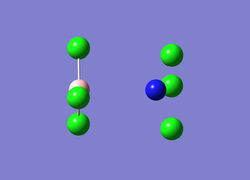
Figure 6: Unusual B-N bond length image
Files for the optimisations for: NH3BH3: DOI:10042/to-9953 NH3BCl3: DOI:10042/to-9952 NCl3BH3: DOI:10042/to-9951 NCl3BCl3: DOI:10042/to-9954
Vibrational Analysis
Using the method as before, the use of the basis set was debated. A pseudo-potential, in line with the basis set, is usually required for the analysis of a molecule with heavier elements, i.e. in this case chlorine. However, since discovering how rapid the calculations were using the basis set 6-311G(d,p) as with the optimisation, I decided to leave the use of the pseudo-potential out from the analysis. If I were to have carried out said process, the results may have lead to more accurate data due to the activity of chlorine orbital interaction being accounted for with the extra addition to the calculation.
| NH3BH3 | NH3BCl3 | NCl3BH3 | NCl3BCl3 | |
|---|---|---|---|---|
| File Type | .log | .log | .log | .log |
| Calculation Type | FREQ | FREQ | FREQ | FREQ |
| Calculation Method | RB3LYP | RB3LYP | RB3LYP | RB3LYP |
| Basis Set | 6-311G(d,p) | 6-311G(d,p) | 6-311G(d,p) | 6-311G(d,p) |
| Charge | 0 | 0 | 0 | 0 |
| Spin State | Singlet | Singlet | Singlet | Singlet |
| E(RB3LYP) | -83.25 (a.u.) | -1461.95 (a.u.) | -1462.27 (a.u.) | -2840.96 (a.u.) |
| Gradient Norm | 0.00006 (a.u.) | 0.00004 (a.u.) | 0.00002 (a.u.) | 0.00006 (a.u.) |
| Dipole Moment | 5.52 (Debye) | 3.18 (Debye) | 6.76 (Debye) | 1.05 (Debye) |
| Point Group | C1 | C1 | C1 | C1 |
| Job Time | 1 mins 4.8 secs | 5 mins 3.9 secs | 6 mins 33.0 secs | 8 mins 28.7 secs |
Now looking at the N-H frequencies, they can be compared to any literature values found to assess the ability of the computational methods in analysing a molecule as one would theoretically. The results are shown in Table 12 below:
| Frequency - Intensity | Literature Values | |
|---|---|---|
| NH3BH3 | 1190 - 120.72 | 1151 [9]B-H scissoring |
| 1343 - 104.09, 1671 - 27.20 | 1252, 1598 N-H scissoring | |
| 2438 - 66.48 | 2418 B-H symmetric stretching | |
| 2488 - 254.69 | 2492 B-H antisymmetric stretching | |
| 3460 - 3.01 | 3398 N-H symmetric stretching | |
| 3561 - 28.30 | 3519 N-H antisymmetric stretching | |
| NH3BCl3 | 678 - 145.90 | |
| 679 - 145.81 | ||
| 751 - 97.88 | ||
| 991 - 203.88 | ||
| 991 - 204.04 | ||
| 1406 - 196.06 | ||
| 3530 - 46.32 | ||
| 3530 - 46.32 |
Since the N-H literature values were not found for the NH3BCl3 molecule, the peaks of the highest intensity were noted down in Table 14. For the ammonia-borane molecule, the frequencies were very close to those of the literature values, which would indicate full optimisation on the part of the computational analysis. Discrepancy between the data could be due to the fact that the structure of the ammonia-borane was not noted down as having either a staggered or eclipsed conformation in the literature values. Theoretically, staggered and eclipsed conformers of the molecule would result in slight differences in frequency, whereby the higher energy (due to torsional strain) eclipsed conformer would result in higher energy vibrational modes, and therefore higher frequencies.
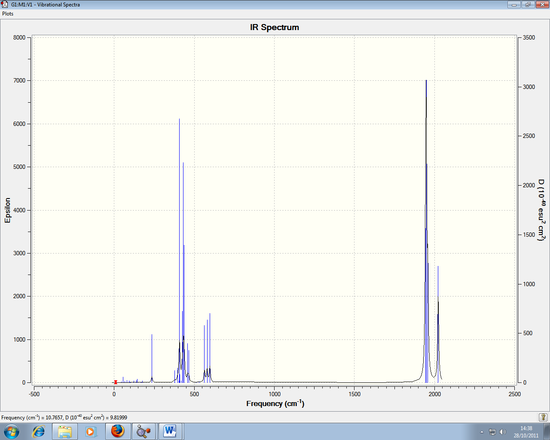
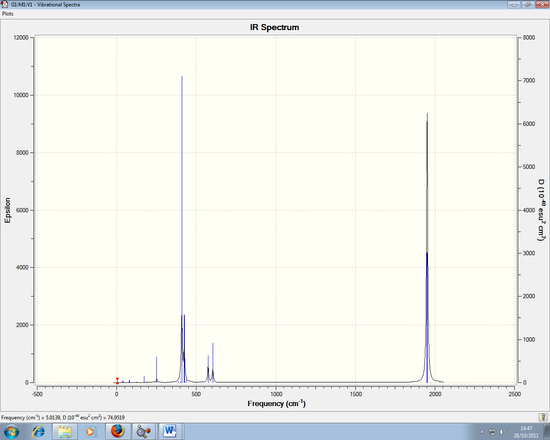
Below are the IR spectra for all four molecules:

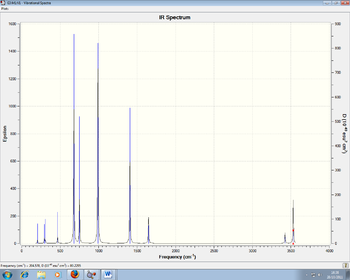 Figures 7 and 8: IR Spectra of NH3BH3 and NH3BCl3
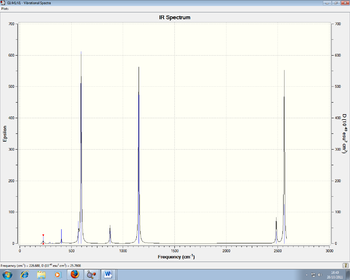
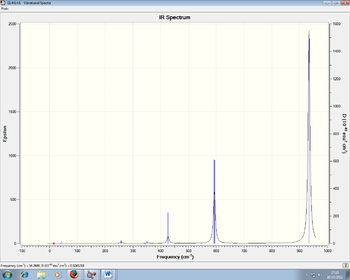 Figures 9 and 10: IR Spectra of NCl3BH3 and NCl3BCl3
Files for the vibrational analysis for: NH3BH3: DOI:10042/to-9955 NH3BCl3: NCl3BH3: DOI:10042/to-9956 NCl3BCl3: DOI:10042/to-9957
Molecular Orbitals
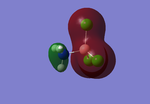
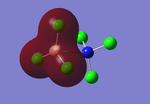
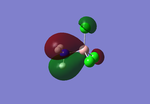
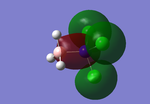
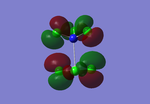
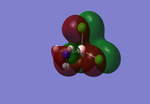
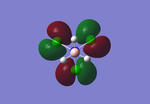
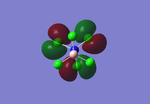
The molecular orbitals chosen for Table 15 was a result of looking at all the occupied orbitals in Gaussview and determining which of the orbitals represented the analysis of the structure most accurately. Many of the orbitals were of similar energy, so one was chosen out of the similar ones to represent the finding.
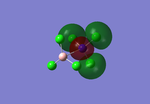
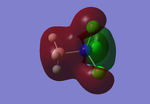
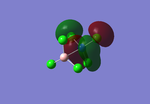
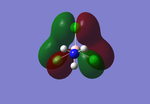
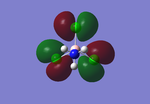
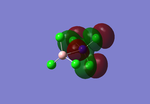
Starting with ammonia-borane, the MOs 1-10 include the HOMO (MO 9) and LUMO (MO 10), which look a lot more complicated than expected of the combination of the two molecules separately. Both MOs 4,5 and 8,9 are degenerate, whilst MO 3 is interesting as it clearly indicates the pull of electron density towards the boron atom. This confirms visually the Lewis acid property of the boron part of the molecule, with the boron atom pulling electron density from the nitrogen atom, as well as its lone pair. The difference between the HOMO and LUMO is again differentiated as with the BH3 molecule, the distortion clear when looking at the LUMO. The fact that the energy level is unoccupied results in a complicated area of electron density surrounding the molecule, with no clear definition of which atom holds what charge.
Next, with the NH3BCl3 molecule, we can certainly see a change with the more elaborate MOs present. As seen with MO 18, it is clear how the effect of the electron withdrawing groups (EWGs) heightens the pull of electron density within the molecule. The electron density is being pulled, not only towards the boron atom, but also partially to each of the chlorine atoms, confirming its status as an EWG. What is interesting is that with the chlorines on the nitrogen atom in NCl3BH3, MO 21 of this molecule shows the opposite effect, with the electron density being pulled away from the nitrogen, as it tries to regain sufficient density whilst having its own density being pulled by the EWGs. Looking at the relative energies, MO 18 of NH3BCl3 and MO 22 of NCl3BH3 have energies of -1.01 and -0.58 respectively. This energy difference in the molecule is only being caused by the swapping of the chlorine positions, and the definite pull of electron density in one direction. Yet the energy for the molecule with the chlorines on the nitrogen is higher, by 1.13 kJ/mol (assuming the energies are given in Ha) which would demonstrate a stronger orbital interaction. This is further proved by the MOs of the final molecule, with both the nitrogen and boron atoms surrounded by chlorine atoms, yet there is a definite preference for the nitrogen atom. The only understanding is that boron retains its electron deficient state when chlorines are no longer aiding it in pulling electron density away from the electron rich nitrogen. The nitrogen atom remains electron rich with chlorines aiding in maintaining that state, therefore showing the electron clouds surrounding that atom only in majority of the MOs.
Files for the vibrational analysis for: NH3BH3: DOI:10042/to-9958 NH3BCl3: DOI:10042/to-9959 NCl3BH3: DOI:10042/to-9960 NCl3BCl3: DOI:10042/to-9961
NBO Analysis
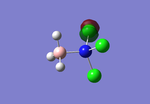
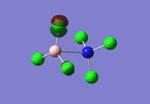
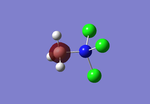
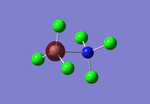
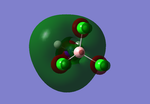
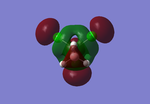
The colouring of the charge distribution agrees with what we know about polarity within a molecule. For example, in ammonia-borane, the positive charge has coloured the hydrogen green relative to the nitrogen (in red)(nitrogen is more electronegative) and the boron ought to be coloured slightly towards the green end, as it retains the positive charge from being less electronegative than hydrogen. However, since both charges are very close to zero, the colouring is neutral with respect to green and red (i.e. brown). Chlorine being more electronegative than both nitrogen and boron results in the chlorine often being coloured more towards the red end.
Unfortunately, the 'Bond orbital/Coefficients/Hybrids' section was looked at for each of the molecules, but a full NBO analysis cannot be carried out at present due to a lack of time for this module. Below is what I started looking at before handing this module in for marking:
NH3BH3 : The first three bonds show that 29.93% of the bond is contributed from the hydrogen orbitals (hybridisation 99.93%s and 0.07%p), whilst 70.07% of the bond comes from the nitrogen orbital (hybridisation 21.19%s, 78.73%p and 0.07%d). So the nitrogen has formed 3 sp3 hybrid orbitals which interact with the s AO of one hydrogen atom. The fourth bond shows nitrogen forming an sp2 hybrid orbital (hybridisation 36.33%s, 63.37%p) with the boron p AO. The last three bonds show that boron has formed 3 sp3 hybrid orbitals (hybridisation 28.03%s, 71.92%p)which interact with the s AO of one hydrogen atom. Orbitals 8 and 9 are the core 1s AO of boron and nitrogen.
NH3BCl3: The first three bonds show that 28.56% of the bond is contributed from the hydrogen orbitals (hybridisation 99.93%s and 0.07%p), whilst 71.44% of the bond comes from the nitrogen orbital (hybridisation 20.89%s, 79.13%p and 0.07%d). So the nitrogen has formed 3 sp3 hybrid orbitals which interact with the s AO of one hydrogen atom. The fourth bond shows nitrogen forming an sp2 hybrid orbital (hybridisation 37.49%s, 62.51%p) with the boron p AO. The last three bonds show that boron has formed 3 sp3 hybrid orbitals (hybridisation 26.42%s, 73.28%p)which interact with sp3 hybrid orbitals (hybridisation 26.42%s, 73.28%p) of one hydrogen atom. Orbitals 8, 9 and 10 are the core 1s AO of boron, nitrogen and chlorine.
The section for Second Order Perturbation Theory Analysis of Fock Matrix in NBO Basis did not show anything of importance for the molecules, as this shows information related to molecules which incur mixing.
Conclusion
In this module, the methods of computational analysis has allowed us to understand its usefulness for comparison with theoretical data. This module saw us optimise and then analyse vibrationally and use MO theory on the molecules we were studying. Overall, the methods have proved successful in providing data close to that of literature data, which would indicate its efficiency in providing an alternative way of analysis.
For the mini project, despite the lack of NBO and MO analysis, the stability of the molecules in comparison with each other can be examined. The optimised data shows that the NCl3BCl3 contains the most repulsion in terms of sterics. This is seen in Figure 6, as well as by the bond lengths and angles in the table of results. The energies of the optimised molecules have been analysed, which gives little information into the effect of the chlorine atoms, aside from the confirmation that the more chlorine atoms present, the larger the increases in energy during optimisation.
With the vibrational analysis, the literature values found matched well with the data, which one can presume means successful production of IR spectra. The larger frequency values witnessed for the two IRs carried out would indicate that N-H and B-H bonds are stronger in a molecule than when there are chlorine atoms present. This can be recognised by the fact the presence of the EWGs can lead to discrepancies in bond strength, the effect of electron density therefore diminishing the bond strength.
Finally with the MO analysis, the main conclusion is the fact that despite the starting thought process that the boron would retain more electron density with the EWGs present (i.e. Lewis acid property), the nitrogen atom has shown the most electron density retention as seen from the electron clouds surrounding the atoms in various MO diagrams above. The presence of the lone pair on the nitrogen, along with the EWGs, allows the nitrogen atom to maintain its electron rich state. This dispels any previously thought strength that the Lewis acid property of a BR3 can obtain. The NBO analysis was mainly to confirm what we knew about the polarities of the molecule, to also keep the knowledge we had obtained previously about the strength of Lewis acids.
References
- ↑ W.M.Haynes, CRC Handbook of Chemistry and Physics, 2010, 91, p9-21
- ↑ W.M.Haynes, CRC Handbook of Chemistry and Physics, 2010, 91, p9-30
- ↑ F. A. Cotton, D. J. Darensbourg, S. Klein and B. W. S. Kolthammer, Inorg. Chem., 1982, 21, 298 DOI:10.1021/ic00131a055
- ↑ F. A. Cotton, D. J. Darensbourg, S. Klein and B. W. S. Kolthammer, Inorg. Chem., 1982, 21, 298
- ↑ M. Y. Darensbourg and D. J. Darensbourg, J. Chem. Ed., 1970, 47, 33 DOI:10.1021/ed047p33
- ↑ T. B. Marder., Angewandte. Chemie. Intl. Ed., 2007, 46, p8116-8118 DOI:10.1002/anie.200703150
- ↑ W.M.Haynes, CRC Handbook of Chemistry and Physics, 2010, 91, p9-21, 25, 26
- ↑ W.M.Haynes, CRC Handbook of Chemistry and Physics, 2010, 91, p9-21, 25, 26
- ↑ S. M. Lee.,X-D. Kang.,P. Wang., H-M Cheng.,Y. H.Lee., ChemPhysChem, 2009, 10, 1830 DOI:10.1002/cphc.200900283

