Rep:Mod:BYL109
Modelling Using Molecular Mechanics
The Hydrogenation of Cyclopentadiene Dimers
Cyclopentadiene is a molecule which undergoes a Diel-Alder cycloaddition to form the dimers (1) and (2) as seen in Figure 1.
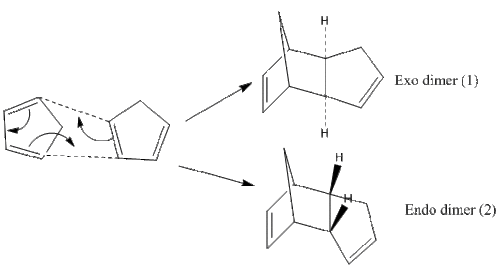
To determine whether the thermodynamic product (the more stable one) or the kinetic product (the more stable transition state) is formed, one will have to look at the conditions the reaction is under, as well as the energies of each dimer. On closer study of the Diels-Alder reaction, under standard conditions, kinetic control is usually predominant and the less stable endo product is formed. However, if the reaction is left to run for a longer period of time and at higher temperatures, this can mean the thermodynamically more stable product gets formed.
The cyclopentadiene dimers (1) and (2) had their geometries optimised via the MM2 force field option in ChemBio3D. As seen in Table 1 below, the exo dimer (1) has a lower total energy. As the endo dimer predominates, one can assume that this reaction happens under kinetic control as the exo dimer would have been favoured otherwise.

| Data for Dimer (1) | Data for Dimer (2) | Data for Dimer (3) | Data for Dimer (4) | |
|---|---|---|---|---|
| Stretch | 1.29 | 1.25 | 1.24 | 1.13 |
| Bend | 20.58 | 20.85 | 18.77 | 13.01 |
| Stretch-Bend | -0.84 | -0.84 | -0.75 | -0.57 |
| Torsion | 7.66 | 9.51 | 12.73 | 12.41 |
| Non-1,4 VDW | -1.42 | -1.54 | -1.34 | -1.32 |
| 1,4 VDW | 4.23 | 4.32 | 6.05 | 4.44 |
| Dipole-Dipole | 0.38 | 0.45 | 0.16 | 0.14 |
| Total Energy | 31.88 | 34.00 | 36.86 | 29.25 |
The exo dimer has a lower total energy due to the interactions as seen in Table 1. Less torsional strain, as well as less 1,4 VDW interactions (seen as unfavourable) result in the total lower energy of the exo dimer. Analysis of the torsional angles between the bonds would have given better insight into just how much difference there is between the angles of dimers (1) and (2). The endo dimer being preferred is common for Diels-Alder reactions. In order to understand why this is, as kinetic factors are involved, the theory of transition states should be discussed. As seen below, the transition states indicate stabilisation of the endo form, due to the dienes' pi-systems pointing towards each other, whilst the exo one has them pointing away. In terms of orbital overlap, with a closer proximity of carbon atoms in the endo transition state, this can be seen as a stabilising effect, rather than a destabilising effect with the exo state, with the orientation of the two dienes being unfavourable for good pi-orbital overlap.
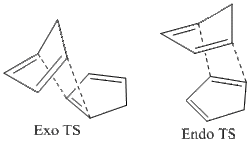
Hydrogenation of the Endo Dimer of Cyclopentadiene
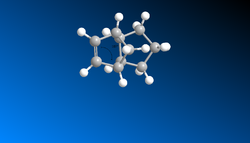
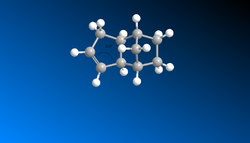
Dimer (4), with the lower total energy as seen in Table 1, is therefore the favoured thermodynamic product. This can be attributed to angular strain, which looks at the bond angles between the C=C double bond and an adjacent carbon. The ideal sp2 bond angle is meant to be 120o, so the further away the bond angle value is from the ideal, the more strained the molecule is expected to be. Dimer (3) has a bond angle of 107o, whilst dimer (4) has a bond angle of 112o, the reason for its lower total energy of 29.25kcal/mol. Looking at other values in the table, stretch, bend, torsion and 1,4VDW energies are all lower in dimer (4), also indicating the reason for it being the preferred product.
| Dimer (3) | Dimer (4) |
|---|---|
 |
 |
Stereochemistry and Reactivity of an Intermediate in the Synthesis of Taxol
Reactivity of Taxol Intermediates
There are two things which need to be analysed about the Taxol intermediates (see Figure 2). One is the fact that they are subject to atropisomerism, a form of stereoisomerism which causes hindered rotation about single bonds related to steric strain. The second is the unusual stability of the alkene in accordance to its slow reactivity.

The intermediates (9) and (10), (9) with the carbonyl group up, the other down, are atropisomers. Apparently, the compound isomerises to the alternative. This implies that there is first the formation of the kinetic product, followed by the conversion to the alternative isomer which is the thermodynamic product (as seen with the Cyclopentadiene reaction). Determining which is the kinetic or thermodynamic product can be seen by looking at the energies of the isomers, calculated through molecular mechanics. The two intermediates had their geometries optimised by the MM2 force field option, where different conformations of the isomers were tested, i.e. changing the 6-membered ring into chair and boat conformers. The boat conformers, being too high in energy (53.30 kcal/mol for (9) and 53.08 kcal/mol for (10)), were excluded from this report. But the data for the chair conformers have been put into Table 2, being of total lower energy than the originally drawn isomers.
The data implies that Taxol (10) is the more stable thermodynamic isomer, with the lower energy as seen in Table 2. The MMFF94 data also agrees with this. It can therefore be assumed that Taxol (9) is the supposed kinetic isomer which is formed first, before its conversion into Taxol (10).
Now analysing the slow reactivity of the alkene, its position in the molecule gives us an idea. The position of the alkene at the bridgehead links to the idea of a hyperstable alkene (olefin stability)[1]. Therefore, in order to ascertain why Taxol (10) is more stable, the olefin strain energies have to be calculated. Strain energies, which are negative compared to their saturated (alkane) forms, are of those alkene bonds which can be considered to be hyperstable.
Therefore the strain energy is calculated by: Energy of olefin - Energy of saturated (alkane) form (both in their mnost stable forms)
For Taxol (10), this strain energy is 44.29-53.67 (kcal/mol) = -9.38kcal/mol. This strain energy has mainly been contributed for by the torsion and VDW forces.
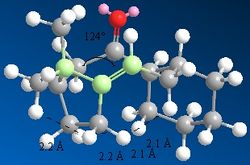
In terms of the torsional contribution, studying the bond angles as we did before, one can judge the difference between the alkene and alkane bonding. An sp2 ideal angle is 120o and an sp3 ideal angle is 109.5o. Removal of the alkene to give the sp3 bond angle gives 120o as seen in Figure 4, whilst the sp2 bond angle is 124o as seen in Figure 3. The deviation of the sp3 bond from its ideal is the reason for the extra torsional strain the alkane experiences in comparison.
In terms of the VDW forces, this requires looking at the H-H interactions, where distances which are less than 2.1Â are considered unfavourable, those greater than 2.4Â favourable. Both molecules have many of these unfavourable interactions with distances less than 2.1Â, however the alkane form has a lot more of them. These can be seen in both Figures 3 and 4 respectively. Both the torsional and VDW contributions rationalise why the Taxol (10) intermediate is favoured.

Modelling Using Semi-Empirical Molecular Orbital Theory
Regioselective Addition of Dichlorocarbene
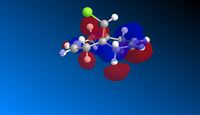
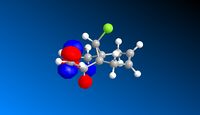
In this section, the idea of using quantum mechanical chemistry is implemented with the use of the MOPAC/PM6 function in ChemBio3D. This allows for the representations seen in Table 3, so allowing for analysis of the electrophilic attack with the dichlorocarbene molecule[2] seen below.

Figure 5: Scheme of electrophilic attack (left)
Despite regenerating the HOMO images in ChemBio to attain a better idea of where the electron density is centred, the ones shown in the Table above would indicate that the syn C=C bond is the most reactive towards electrophilic attack. This is only because the LUMO, assumed to be the point most reactive towards nucleophilic attack, has the most electron density surrounding the anti C=C bond. As this dichlorocarbene is a strong electrophile, one can assume that it will therefore attack at the syn C=C bond.
| HOMO-1 | HOMO | LUMO | LUMO+1 | LUMO+2 |
|---|---|---|---|---|
 |
 |
 |
 |
 |
Without the knowledge we have accumulated through the use of the MOPAC/PM6 calculations, we would not have been able to foresee which C=C bond the electrophilic attack would have occurred at. The attack at the syn C=C bond is the reason the mechanism in Figure 5 has been drawn thus. The reason for the anti C=C bond not being cleaved to form the new bond is its stability in terms of conformational analysis. Stabilisation only occurs if there is a small energy gap between σ to σ* levels (in this case π to σ*) and if there is good orbital overlap. Electronegativity affects the energy level gap, so the chlorine atom lowers the C-Cl σ* level, whilst there must be better overlap than there is with the syn C=C bond. This could possibly be due to the lack of good orbital overlap.
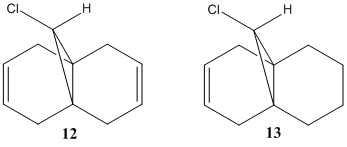
Looking now at the IR spectra, this can help us determine the effect the C-Cl bond has on the data, partially discussed before. We look at compound 12 and its monohydrated form compound 13, which has the C=C bond anti to C-Cl bond replaced by a single C-C bond. Images of the IR spectra taken and analysed are shown below.
| Compound 12 | Compound 13 | |
|---|---|---|
| C=C stretch (anti to C-Cl) (cm-1) | 1736.06 | N/A |
| C=C stretch (syn to C-Cl) (cm-1) | 1757.45 | 1758.06 |
| C-Cl stretch (cm-1) | 770.84 | 774.96 |
Now looking at the IR spectra of the compounds 12 and 13, the stretches demonstrate the differences in the bond strengths. With the removal of the anti bond, the C-Cl bond wavenumber is higher, signifying a stronger bond. If the anti bond was still present in compound 13, the donation of electron density into the C-Cl σ* orbital would have weakened the C-Cl bond, therefore reducing its wavenumber. This clarifies what was said earlier about the orbital overlap and subsequent donation of electron density.
Monosaccharide chemistry: glycosidation
Glycosidation is the reaction of a nucleophile attacking the position at the anomeric centre to provide both the α and β anomers, both of which are diastereoisomers of each other. The idea of this question is to determine just how important the positions of the acyl group in reactivity with the monosaccharides are, and after position modification, their associated energies.
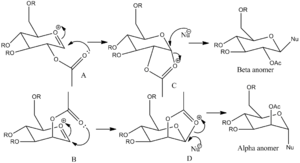
First, looking at the possibilities for the R group, the methyl group was chosen. Being the smallest of all possible R groups, but tested alongside other possible groups including hydrogen, this caused the least difficulty when it came to calculations. The hydrogen group, despite having a lower energy, is usually associated (in monosaccharide chemistry) with having the -OH group being changed into a protecting group first, so making it unlikely for such a molecule to be used in this case.
As for which method is preferable, the neighbouring-group participation effect is one associated with orbital interaction. Solely from this view, it would seem the MOPAC-PM6 would be more useful, carrying out calculations from a quantum mechanical view which would include molecular orbital representations.
With the acetyl group above (X') and below (X) the oxonium ion, we can determine from which position it would be best for it to attack the ion. According to Table 5 below, the monosaccharides which have the acetyl positions below the plane of the oxonium cations are the more stable in terms of energies. This would imply that interactions with the acetyl group below the plane is favourable, in terms of the oxonium cation being stabilised by the carbonyl group.
| Monosaccharide A | Monosaccharide A' | Monosaccharide B | Monosaccharide B' | Monosaccharide C | Monosaccharide D | |
|---|---|---|---|---|---|---|
| Energy (MM2) (kcal/mol) | 25.27 | 29.46 | 24.40 | 28.53 | 30.62 | 38.09 |
| Energy (MOPAC/PM6) (kcal/mol) | -71.20 | -88.73 | -77.51 | -84.08 | -91.66 | -90.51 |
| Jmol | Monosaccharide A | Monosaccharide A' | Monosaccharide B | Monosaccharide B' | Monosaccharide C | Monosaccharide D |
| Monosaccharide A | Monosaccharide A' | Monosaccharide B | Monosaccharide B' | Monosaccharide C | Monosaccharide D | |
|---|---|---|---|---|---|---|
| Stretch | 2.26 | 2.54 | 2.65 | 2.64 | 2.08 | 1.96 |
| Bend | 14.72 | 10.94 | 9.91 | 12.16 | 14.13 | 16.14 |
| Stretch-Bend | 0.95 | 0.99 | 0.89 | 1.04 | 0.75 | 0.69 |
| Torsion | 1.37 | 3.08 | 3.07 | 2.18 | 9.67 | 6.79 |
| Non-1,4 VDW | -0.98 | -1.75 | -0.59 | -0.83 | -2.28 | -4.00 |
| 1,4 VDW | 19.48 | 19.02 | 19.62 | 18.81 | 17.90 | 17.70 |
| Charge-Dipole | -21.44 | -10.55 | -14.88 | -14.44 | -9.55 | 2.88 |
| Dipole-Dipole | 8.91 | 5.20 | 3.74 | 6.97 | -2.08 | -0.27 |
Looking at the data in Tables 5 and 6, the more stable monosaccharides were A and B of A A' B B'. This relates to the acetyl group positioned below the plane of the oxonium cation. Therefore stabilisation can occur with good orbital overlap, which would imply a better orientation around the molecule when the acetyl group is below the plane of the cation. The reasons for the differences between A and A', B and B' could be due to the charge-dipole values as seen in Table 6. A large difference between them, especially for A and A', is the result of proximity of the polar oxygen atoms on the acetyl group in relation to the rest of the molecule.

For C and D, comparison between them and the other monosaccharides shows higher energy values. This is due to the strained conformations of the trans-fused rings on the chair conformers. For the difference between C and D, this can be explained by the anomeric effect. C has the same orientation as the α-anomer, D the β-anomer. The stabilisation of the axial -OH group (for C and D, the acetyl group) donating into the C-O σ* orbital by the lone pair on the oxygen leads to an unusual stabilisation, which normally contradicts the idea that axial substituents on chair conformers are normally destabilised.
Mini Project
Predicting the 13C NMR of (-)-Cubebol
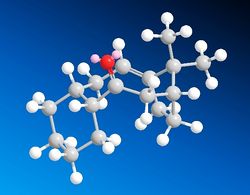
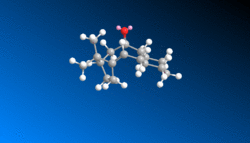
Choosing the suggested investigation into the synthesis of (-)-Cubebol[3], we are looking to investigate using the different methods at hand the differences in the experimental and produced data to see if the configuration of the isomers shown in literature is what we've achieved. First looking at the 13C NMR, one can use the DFT-mpw1pw91 method to obtain a predicted NMR spectrum, which can then be compared with literature values in the journal. Then, the IR data needs the B3LYP/6-31 (d,p) method to obtain a predicted spectrum. Finally, an Optical Rotation uses the Cambridge variation of the same program to produce the data. Both this data can then also be interpreted through comparison with the literature values.

After attempting different conformations of the isomers, i.e. chair and boat conformations, it was seen that the lowest energy conformation was that of a 6-membered ring for both of them. The energy of the chair, chair conformations were 37.01 and 37.28kcal/mol for the cubebol and its isomer respectively. Therefore the 6-membered ring conformations were used for the energies seen below in Table 7.
| Cubebol | Isomer | |
|---|---|---|
| Stretch | 2.39 | 2.35 |
| Bend | 6.74 | 6.33 |
| Stretch-Bend | 0.10 | 0.10 |
| Torsion | 19.36 | 19.55 |
| Non-1,4 VDW | -4.49 | -4.44 |
| 1,4 VDW | 12.77 | 12.70 |
| Dipole-Dipole | 0.06 | 0.20 |
| Total Energy | 36.95 | 36.78 |
| MMFF94 Energy | -74.14 | -74.49 |
Having calculated the predicted NMR spectrum, the results are as follows in Table 7. The link to the NMR spectra has been provided: DOI:10042/to-9543 DOI:10042/to-9553
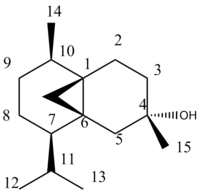
Figure 12: Cubebol numbering (NB: The literature data matching carbon numbers have been switched with the ones drawn above in Figure 12)
| Carbon 1 | Carbon 2 | Carbon 3 | Carbon 4 | Carbon 5 | Carbon 6 | Carbon 7 | Carbon 8 | Carbon 9 | Carbon 10 | Carbon 11 | Carbon 12 | Carbon 13 | Carbon 14 | Carbon 15 | |
|---|---|---|---|---|---|---|---|---|---|---|---|---|---|---|---|
| NMR δcalc | 29.7 | 24.8 | 44.6 | 23.7 | 28.3 | 32.7 | 43.9 | 68.7 | 37.4 | 30.3 | 17.9 | 37.4 | 22.2 | 23.0 | 33.2 |
| NMR δexp | 31.7 | 26.5 | 44.1 | 22.5 | 33.4 | 30.8 | 39.0 | 80.3 | 36.3 | 29.5 | 20.1 | 33.6 | 18.7 | 19.6 | 27.9 |
| NMR Isomer δcalc | 35.2 | 28.8 | 47.7 | 27.2 | 41 | 35.1 | 45.2 | 67.6 | 44.1 | 35.0 | 27.9 | 41.2 | 24.2 | 26.9 | 34.8 |
| NMR Isomer δexp | 34.9 | 25.0 | 44.6 | 19.2 | 30.2 | 29.7 | 39.9 | 80.8 | 36.6 | 27.1 | 20.1 | 31.8 | N/A | N/A | 25.3 |
The NMR spectrum of the original (-)-Cubebol molecule seems to match fairly well with the experimental data, which would indicate that the drawing of the isomer was correct and that the program interpreted the information correctly. A difference of more than 5ppm can be seen for certain peaks, but majority remain with the 2-3ppm range. Carbon 7 is an exception, which can be attributed to the Now looking at the NMR data for the isomer, although slightly higher in the peaks when compared to the original (-)Cubebol molecule, is also very similar to that of the literature values found.
Predicting the 3JH-H couplings
Using the Janocchio program, the 3D molecule of Cubebol was opened in ChemBio3D, changed to the MDL Molfile and used to find the couplings. The couplings have an average value of 6.0Hz, which compared to the value 1.0Hz in the literature, is very different. This could be due to the fact that there is only J coupling listed in the literature (d, J=1.0Hz, 3H, H-15) which is also referring to a different H-C-C-H relationship to the one calculated, which was at position H(14)-C(14)-C(10)-H(10) shown in Figure 12. The one listed for H-15 could be considered incorrect, due to the fact that 3J couplings are not possible at this position, due to the -OH group on C(8).

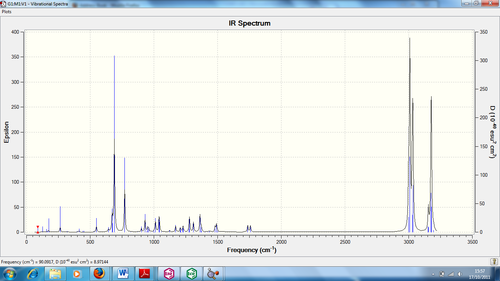
Predicting the IR Spectrum
The IR spectrum of a molecule determines the bonds present, which can differ in terms of wavenumbers depending on the strength of the bond. In the isomer, there are no changes in any of the functional groups present, so there may only be a slight difference in the wavenumber according to the strength of the bond as it passes through the infra-red radiation.
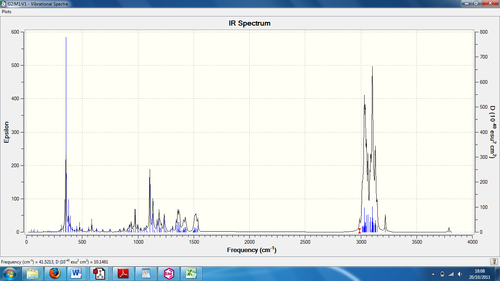
| IR peakcalc (cm-1) | IR peakexp (cm-1) | Bond stretch |
|---|---|---|
| 907 | 910 | C-H |
| 1134 | 1142 | C-C |
| 1494 | 1490 | C-H |
| 2989 | 2860 | C-H |
| 2989 | 2951 | C-H |
| 3791 | 3350 | O-H |
Judging the wavenumber differences between the calculated and literature values, the differences are quite large and the bonds shown are not conclusive if this were to be an unknown substance. Despite having one O-H and one C-C bond, the rest of the peaks which are closest to literature values are those of C-H bonds. Whilst being the most numerous, it would give little explanation to the form of the molecule on a first-hand look. This would indicate that the IR predicted spectrum was not entirely accurate.
Predicting the Optical Rotation
Using the Cambridge variation of the B3LYP/6-31G (d,p) program, the data was finally calculated as 56.4, with the literature value from the journal being -59.6. The data from the isomer was calculated to be -62.3, which is a surprisingly accurate result for both isomers. The negative value in the literature would suggest that the enantiomer originally built for the Cubebol file submitted to SCAN was a representative of the opposite enantiomer, the actual one being the one submitted in the isomer file. The program which runs the optical rotation measurement, despite being used for many years, is not the most accurate of procedures.
References
- 1. J. Clayden, N. Greeves, S. Warren and P. Wothers, Organic Chemistry 2001, Oxford University Press, p328-330
- 2. Wilhelm F. Maier, Paul Von Rague Schleyer, J. Am. Chem. Soc., 1981, 103, 1891. DOI: 10.1021/ja00398a003
- 3. B. Halton, R. Boese and H. S. Rzepa., J. Chem. Soc., Perkin Trans 2, 1992, 447. DOI:10.1039/P29920000447
- 4. David M. Hodgson., Saifullah Salik. and David J. Fox., J. Org. Chem., 2010, 75 (7), pp 2157–2168 DOI:10.1021/jo9022974

