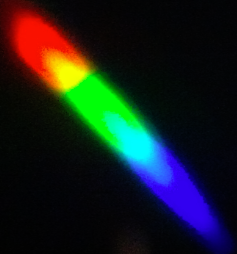
Rep:Mod:BSCPROJECT WJ
Meeting 1, Commencing WEEK 1
Minutes: 23/01/2013
Summary of meeting:
Before Christmas it was decided that Will would undertake his Project based upon 'Outreach Activities'. The main aim is to encourage students to pursue Chemistry at a higher level and encourage them to consider the subject at University.
Will came up with the idea of producing a 'Chemistry Calender' which would associate different calender events with areas of the curriculum. He wants to propose practical lessons and teaching resources relevant to the curriculum and associated with the time of year which can be used in lessons.
He hopes that this will help the students generate a good interest in the subject, will help them learn as they will associate the time of year with what they learnt, and show the students that chemistry is very relevant to the world around them, encompassing everything.
The calender would give the students something to look forward to: maybe a 'once a month lesson' with a really interseting practical.
this idea has been looked into by ACS in america for chemical education: http://www.acs.org/content/acs/en/education/students/highschool/chemistryclubs/activities/calendar.html
For example:
- Bonfire Night - the flame tests could be taught + an interesting practical.
- Valentines day - Acids and bases with their pink and blue indicators.... 'roses are red violets are blue' + an interseting practical
- State opening of Parliment - the politics around Chemistry could be taught for example the Montreal CFC treaty. etc
- Armistace Day - Halogens used as weapons of war. etc.
- Midsummers Day - Hot chemistry - Combustion, alkanes and catalysts trying to 'cool down' the reaction conditions. etc.
- Spring 6 nations rugby/ Autumn football internationals - the Chemistry of Sport.
The audience will be GCSE students, for two reasons: they are taught Chemistry by only one teacher, unlike A-level students who usually have two teachers, so the proposal will be easier to implement, and they will be less decided on their future opposed to A-level students who may already have clear ambitions.
Will also wanted to include the Outreach Lab which could perform experiments that could not be conducted by school teachers. For example the 'Spectroscopy in a Suitcase' Lab.
It was pointed out that it will be better to concentrate on 3 or 4 experiments and do them in depth.
Actions for next meeting (30/01/2013)
| Item | Action | Outcome |
|---|---|---|
| 1 | Contact teachers at Local Schools to see how they feel the proposal could fit with their currrent plans. | |
| 2 | Find the most widely used GCSE exam board in the London schools and begin disecting the syllabus. | |
| 3 | Contact the Outreach Co-ordinator to find out her views | |
| 4 | Contact teachers to find out how they would plan a lesson and work out what I would need to include in my lesson. | |
| 5 | produce a survey to gague opinion on the plan and distrubute at a school I worked in | |
| 6 | Work out which areas of the curriculum fit in with calender events | |
| 7 | Research Experiments that could be included in a package for schools for both students and teachers |
After the results of the teacher feedback, the Opinion of the Outreach Co-ordinator. Will is going to assess the viability of the task he undertaking and refine it accordingly for the next meeting.
Item 1
I have spoken to a teacher and suggested the idea of a calender. She explained to me how the schools are moving towards interactive resources now and the use of Ipads in lessons is becoming more common. She suggested that the calender could be incorporated as an App if that is possible.
She explained that she thinks students are only interested when they are able to understand what they are learning so this needs to be an important part of my plans. To ensure that any complex demonstrations are always contextualised to what they are trying to learn.
Schools are so results driven so everything has to be relevant to the final objective - exam results. Teachers are not going to use anything that is not relevant to the chilren getting a good grade in the exam so I have to be direct and relevant with my proposal.
She did say that the calender could be included in the scheme of work at the start of the year that the head of department produces.
Item 2
AQA is the most widely used exam board for GCSE Science exams. [1].[2]
Item 3
I have arranged to meet with Claire Doyle on 30/01/2014 at 3:15 pm
Item 4
I have been sent a scheme of work by the teacher I spoke to on the phone. It begins with the programme of study given by the exam board and then is broken down into individual lessons throughout the year. Each lesson has learning objectives and outcomes.
Item 5
Item 6
The aim of the GCSE curriculum is summed up by this paragraph on the AQA website: "Many of the materials considered are substances that students will come across in their daily lives like drinking water, vegetable oils and metals. This helps engage students by putting their learning in context. Teachers are encouraged to develop students' practical skills with hands-on work which helps make the subject come alive in the classroom." [3]. The curriculum is given here [4]. My concern is that it is too simple and that I will not be able to generate an in depth study of potential experiments in my report. Apart from bangs and explosions I think that the GCSE syllabus is too basic to base the project upon
Item 7
Christmas Lectures
The Royal Institution have been delivering their annual Christmas lectures since 1825. I have am looking through all the lectures to see if there is potential to use any of the ideas or develop any of the topics from the very old lectures. The table below is a Summary of the Lectures which uses Chemistry: [5].
| Date | Lecturer | Topic | Summary |
|---|---|---|---|
| 2012 | Peter Worthers | The Modern Alchemist | |
| 2002 | Tony Ryan | Smart Stuff | |
| 1987 | John M Thomas & David Philips | Crystals and Lasers | |
| 1976 | George Porter | The natural History of a Sunbeam | |
| 1955 | Harry W Melville | Big Molecules | |
| 1954 | Frank Whittle | The Story of Petroleum | |
| 1947 | Erick Rideal | Chemical Reactions and How They Work | |
| 1938 | James Kendall | Young Chemists and Great Discoveries | |
| 1893 | James Dewar | Air - Gaseous and Liquid | |
| 1886 | " | The Chemistry of Light and Photography | |
| 1880 | " | Atoms | |
| 1876 | John H Gladstone | The Chemistry of Fire | |
| 1872 | William Odling | Air and Gases | |
| 1870 | " | Burning and Unburning | |
| 1868 | " | Chemical Changes of Carbon | |
| 1866 | Edward Frankland | Chemistry of Gases | |
| 1864 | " | The Chemistry of Coal | |
| 1854 | Michael Faraday | The Chemistry of Combustion | |
| 1852 | " | Chemistry | |
| 1847 | William T Brande | Elements of Organic Chemistry | |
| 1841 | Michael Faraday | Rudiments of Chemistry | |
| 1839 | William T Brande | Chemistry of the Atmosphere and Ocean | |
| 1837 | Michael Faraday | Chemistry | |
| 1836 | William T Brande | Chemistry of Gases | |
| 1834 | " | Chemistry | |
| 1832 | Michael Faraday | Chemistry | |
| 1827 | " | Chemistry |
http://www.youtube.com/watch?v=rmtK2BgmGCw prof chris bishop - chemistry of fireworks
I am arranging to meet someone at the Royal Institute to see what work goes into devising the Christmas Lectures.
Peter Wothers: Cambridge University Outreach
Peter Wothers of Cambridge University has created an excellent set of Outreach Chemistry Lectures of particular relevance was the lecture on Combustion entitled 'Fire and Flames'. [6]
- He began by doing the flame tests in trays, burning the metals in alcohol, which meant that the whole flame was coloured rather than just the metal. Sodium - Orange, Boron - Green, Strontium - Red.
- He Burnt a Chocolate muffin using liquid oxygen to show in essence what is happening during digestion.
- He showed than CO2 and H2O are given off during combustion by condensing the water from a candle and showing the chalky deposit in limewater.
- Flour burns vigorously - he illustrated that this could a problem in flour mills.
- He measured the increase in mass of iron mesh when it is burnt in oxygen on a set of scales as the iron forms its oxides.
- He showed that oxygen alone does not burn, a balloon filled with pure oxygen just pops, and that oxygen is required in the reaction when things burn.
- Hydrogen does not burn on its own - he lit a match inside a bag of pure hydrogen.
- An interesting idea that he used which could be incorporated easily into a lesson was - what is the best ratio of propane and oxygen burning together . 5 oxygens burn with 1 propane and of course this created the biggest bang, whereas the 1:1 ratio was less exciting and a carbon residue was was left behind. He filled up 2 balloons with the different ratios to demonstrate this.
- He moved onto catalyst and showed that a reaction could be started without any flame, for example a cotton bud was dipped in palladium powder and at room temperature Hydrogen gas could be ignited with this catalyst in the presence of oxygen.
- An interesting experiment involved creating silane (SiH4) by adding acid to magnesium silicide which was isolated at the bottom of a solution and then observing the bubbles rise to the surface and spontaneously catch fire when exposed to the air.
- He explained how to extinguish a fire under certain conditions: carbon dioxide is good for extinguishing fires from reactions that generate CO2 however for metals that react with CO2 it is not a good tool. Water will not put out a magnesium fire - Mg + H2O -> MgO + H2. Similarly sand reacts with burning magnesium.
Bonfire Night Lesson
Flame Tests
Flame tests can be used as a simple analytical technique to identify elements. The colour observed in the flame represents a transition from a excited electronic state to the ground state for the element. This has particular relevance to material on Bohr's Atomic Theory and emmission spectroscopy [7]. A specific colour is obsereved in the flame representing a discrete transition from a particular wavelength of light.
A recent article in the Journal of Chemical Education gives three methods for performing the flame tests [8].
| Method | Details | Procedure as Described |
|---|---|---|
| 1 | A solid sample is burnt in the flame of a Bunsen Burner | "A cotton swab is dipped into distilled water and then dipped into a sample of the solid metal salt. The cotton swab is the placed into the flame of the Bunsen Burner" |
| 2 | An aqueous sample is burnt in the flame of a Bunsen Burner | " A cotton swab is dipped directly into the 1 M solution of the metal salt and placed into the flame of the Bunsen Burner" This method takes longer for the colour to appear in the flame but is cleaner than method 1, as the solid may contaminate the Bunsen Burner. |
| 3 | A solution including alcohol as the solvent is set alight | "The cotton swab is dipped into alcohol and then into a sample of the solid metal salt" It is then burnt. The article suggests using isopropyl alcohol. Ethanol was not suitable as the fire was too vigorous and burnt out before and colour was observed. This method can be used when Bunsen Burners are not available. |
When the flame tests are performed on a large scale for a bigger audeince the Journal suggested that an extra piece of kit was used for Methanol based flame tests. [10].
It was suggested that a material to absorb the methanol be included in the set-up. This would make the procedure safer. Trials using wood and cellulose to absorb the methanol proved unsuccessful as they both burnt in the flame and were a source of contamination. It was suggested that a 'Mr Clean Magic Eraser' could be a useful porous material and this proved successful. It is already a common tool in the laboratory. It was split into small chunks and then doused in methanolic solutions of the metal salts. When fixed into position with clips ideal colours were obtained when it was ignited and there was no contamination of other colours due to charring.
The authors tested methanol solutions of LiNO3, KNO3, CuCl2⋅2H2O, Sr(NO3)2, and NaNO3; where 150-300 mg of salt was dissolved in 8 mL of methanol and a small amount of water (approximately 1 mL) was added to aid the dissolution. The aim was to saturate the absorbant. In the experiment this was ideal for "2.5 x 2.5 x 4cm" of 'Mr Clean Magic Eraser'.
When performing the flame tests on multiple samples, it is important to avoid cross contamination. Similarly it is important to put out the flame whilst some methanol is remaining otherwise the sponge will char.
T. Mortier, A. Wellens and M. Janssens reported a method that excluded contamination. They used aluminium candle holders to contain the alcoholic solutions of the metal salts. "The exact concentration of the metal salts is not important" [11]. The flame tests are performed with the hollow candle holders in water filled dishes to prevent them from becoming to hot during the procedure. Results gave flame of above 7 cm in height, ideal for a classroom experiment.
In the Lecture given by Peter Wothers in the above section, he used large trays of alcohol to perform the flame tests, this larger scale seemed to provide a more spectactular outcome, as very often with young scientists, 'big means better'. A greater excitement and interest level is achieved. I decided to find out which would be the the least expensive alcohol to perform the demonstration.
An interesting adaption to the flame tests could be performed with a CD used as a makeshift diffraction grating to resolve the light [12]. An interesting idea that was brought to my attention by Dr Edel how to make a UV spectrometer from an iphone and using a CD as the diffraction grating. The phone was first turned to camera mode and a CD was smashed and the metalic part was pealed off. The focal length of the difraction grating was obtained and this was attached to the camera of the phone (the distance was about 10 cm away from the camera. The room was darkened and the the home made spectrometer can be pointed at the flame. A photo is taken and a spectrum is obtained. This could be easily incorporated into a school lesson.
Making a Spectroscope
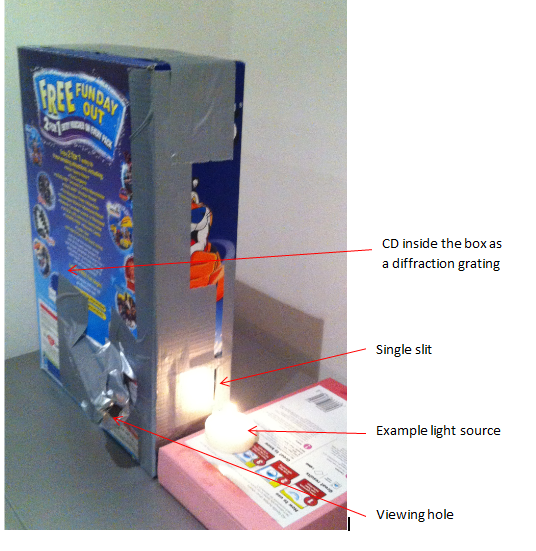
This can be made in a variety of different ways. I like the idea of incorporating the camera function on mobile phones and a CD as a transmission grating. However a more permanent design for school students can be made with a cereal box and a CD as a reflection grating.
This could be used particularly effectively to explain the concept of electron shells and shielding and periodicity across the periodic table. This is something I met in my As-level.
The Ideas I would like to develop
- making a UV spectrometer from an iphone camera and a CD and then using it to analyse the results of the flame test experiments with the ideas developed in the above paragraph.
Meeting 2, Commencing WEEK 2: 2 30/01/2014
- Andrew signed off my COSHH form for my proposed experiment for performing flame tests and taking emmission spectra of the results. I was given lab space in Briscoe lab.
- I met up with Claire Doyle from the Outreach department. We discussed how my project could be used for potential demonstrations and she wanted to see the results.
Tasks for next meeting
Test the viability of the first experiment proposal in the lab and report back to andrew and laura.
Performing Flame tests and measuring the emmission spectra will a spectroscope
Performing flame tests
http://swc2.hccs.edu/pahlavan/intro_labs/Exp_5_Flame_Tests_and_Electron_Configuration.pdf
http://www.chemguide.co.uk/inorganic/group1/flametests.html
http://www.nnin.org/sites/default/files/files/Karen_Rama_USING_CDs_AND_DVDs_AS_DIFFRACTION_GRATINGS_0.pdf LOOK AT THIS!!!
http://pac.iupac.org/publications/pac/pdf/1995/pdf/6710x1725.pdf THE DIFFERENCE BETWEEN A SPECTROSCOPE AND SPECTROGRAPH AND SPECTROMETER PAPER!
http://www.inpharmix.com/jps/CD_spectro.html
The objective for this piece of lab work is to find out which is the best method for performing the flame tests and how can the flame from the metal salt be measured using a spectroscope. This would give us an emmission spectrum.
30/01/2014
Non-conventional flame tests were undertaken in the lab on 30/1/2014 & 31/1/2014. The metal salt was dissolved in ethanol and the solution was burnt to give a larger flame. The first task was to establish a metal salt which would dissolve in ethanol as so could be used for spectral analysis.
- Strontium chloride proved the most successful. This was then used for further analysis
The next task was to establish which method was best for performing the flame tests. Five methods were attempted in the lab. The metal was dissolved in ethanol. Strontium chloride best dissolved (8g in 10 mL ethanol) so this was chosen for the next part of the investigation.
- An aluminium candle holder was placed in a petri dish filled with water as described here [13]. This method proved poor as the flame was very contaminated with an orange colour. Initially I thought than the aluminium might be producing a flame spectrum however upon closer observation it appeared that the candle holder was coated in something that appeared to burn. This was the source of the contamination. The aluminium itself burns with a colourless flame [14].
- The next method was to soak a spong in the ethanolic solution of the metal salt. This initially generated a strong red colour but as the spong began to burn itself it began to carbonise and this contaminated the flame in with an orange colour.
- A method had to be employed where the the flame can be burnt without source of contamination.
The next method was to try and burnt the ethanolic metal ion solution in a small petri dish. This result was good however the pertri dish got too hot and smashed.
31/01/2014 & 03/02/2014
- On this note, it was clear that glass would be a useful material to hold the salt solution. Another method was tried out where glass wool was soaked in a solution and then this was set on fire again the reult of this was good.
- Aluminium foil or even better the premolded 'Mr Kipling Apple Tart' trays produced excellent results, an uncontaminated colour in the flame was obsereved, as the aluminium was pure. The only down side was that it got quite hot.
The last 2 methods produced the best results so could be used in the next step in the spectroscope set up. A point to note was that the flame was quite turbulent and it was a worry that a clear spectrum would be hard to generate.
I decided to experiment using a different alcohol and different metal salts.
Methanol burnt with a cleaner flame than ethanol and the colour of the metal was easier to see and could be seen quicker than when ethanol was used.
I initially hypothesised that metal nitrates would give the strongest color as they have an oxidising agent already present in the compound. However it was the metal chlorides that burnt the quickest and with the strongest colour.
I also found that in order to get the best colour you should start with your metal salt in methanol (it does not have to dissolve), light this solution and then gently sprinkle the metal salt on the burning solution in order to get the strongest colour, then leave the flame to burn. By sprinkling metal salt on the flame, it seemed to initialise the burning of the metal salt already in the candle holder.
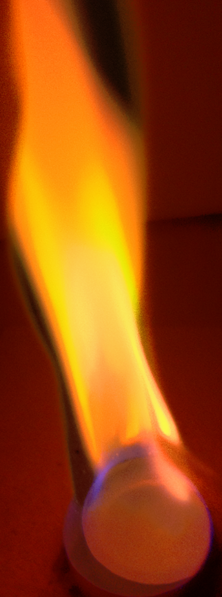
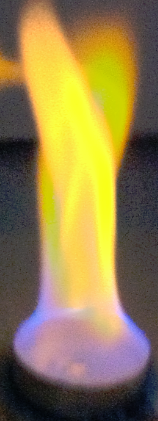
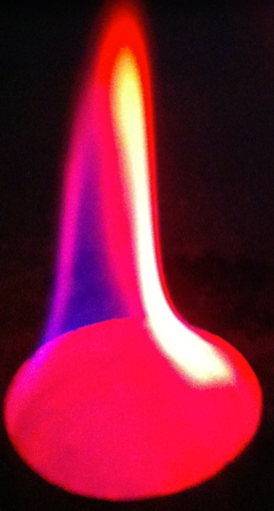
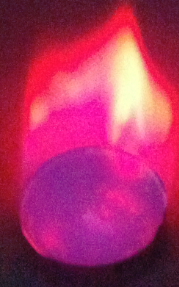
Here are results for the chlorides, from left to right: Calcium chloride, Sodium Chloride, strontium Chloride, Potassium Chloride.
I tried the methanolic metal chloride methods and in this case the best route was to perform them in the aluminium candle holder to get the most intense flame (the above pictures).
Making the spectroscope
(Saturday) 01/02/2014
This website was consulted [15] as well as the third year physical chemistry lab [16].
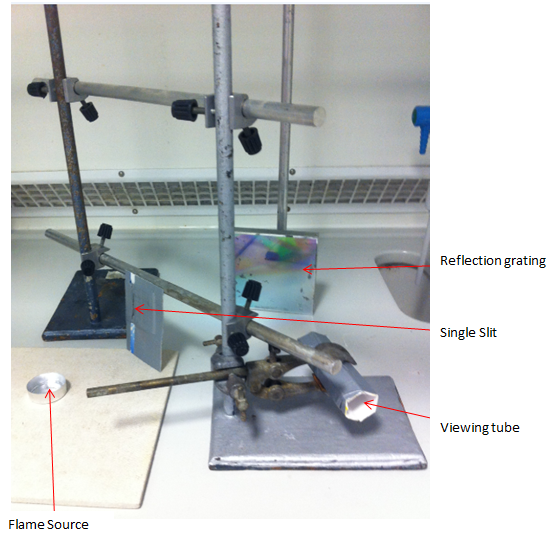
A simple design from the above website was trialled and a spectroscope was made, the result is shown here:
Initially a candle was used to see if a continuous spectrum could be generated. I thought this was best as it could be tested at home and I could see if it was possible to stabilise the spectrum. It is analogous to a turbulent flame that is generated in the flame tests.
Initially a CD was used as a refelction grating. I tried to smash the CD and peel off the diffraction grating but this was not possible, the grating was inherently built in to the CD. I was not able to generate any spectrum from this technique, even in a dark room with no other source of light other than the candle.
I decided to trial the homemade spectroscope using a reflection grating from an old spectrometer, that Simon gave me out of Briscoe lab. This gave me a spectrum seen below.
This is a zoom in of the spectrum. The resolution is not good due to the candle flickering and the phone camera was not able to focus on the spectrum image and get a better resolution. A second image was taken with the grating being rotated so that it was orthogonal to the viewing aperture rather than orthogonal to the single slit as in the first image and this spectrum is shown below.
It is apparent that there is less of a yellow region in this spectrum.
04/02/2014
I decided to trial this simple set up in the lab with a strontium flame tests as this showed a strong colour from the results in the above section:
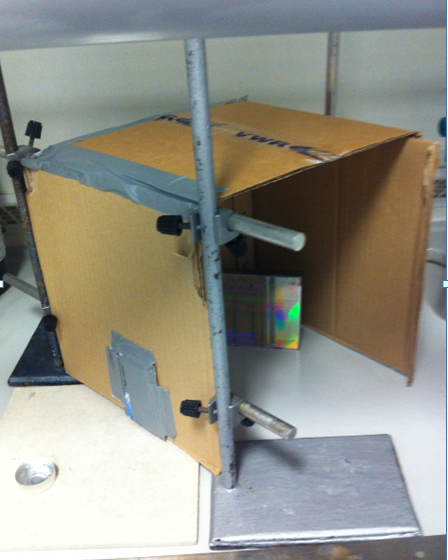
The same set up was used as in the home made spectroscope, but in order to shown what was actually inside it and measure the effect of rotating the angle of the diffraction grating on the spectrum quality, a similar set up was used in the lab:
This set up was covered with a cardboard box on three sides and a sheet on the side of the viewing tube, a phone camera was attached to the viewing tube in order to take a picture of the spectrum.
The lights were dropped in the room and a picture of the strontium chloride spectrum was taken. The spectrum below is for an angle of the diffraction grating at ~16o to the slit. The result is poor and you can see rotation in the spectrum. Also the spectrum is not resolved into discrete lines.
The form of the spectrum is not good. Although the first order reflection angle has been obtained. There is rotation in the spectrum as the alignment of the grating is not perpendicular to the slit.
Points to note from initial spectroscope experimentation
- The light that is refracted must be coherent in order for an interference pattern to be observed. This is the purpose of the single slit. It only allows light to enter from an orthogonal direction.
- A reflection grating was used. It is hoped that the set up will be adapted so that a CD/ DVD can be used in place. The issue here is what to use - CD or CD-ROM or DVD. Which will produce the best pattern according to the density of lines on the grating. A DVD has a denser grating than a CD than a CD ROM
- I would like to experiment with reflection gratings as they are more common 'around the home' however I will compare the results with a refration grating. The only obvious 'home made' source for this is 3D glasses used in 3D cinema.
- Is a concave surface on the reflection grating required to focus the light. Do I need to look at the possibility of lenses. This is all with the aim of keeping the setup as simple as possible so that it can be used in school. I will try and optimise the set up then scale it down.
- How wide does my single slit have to be in order to let enough light pass but also to keep the light coherent. The balance between these 2 factors has to be considered
- Great consieration about the angles has to be taken into account as the greatest intensity light will come from fist order reflection where n=1. n=0 will not work as this corresponds to light that does not diffract, as no interference pattern is observed
- Can I calculate the wavelength of light passing through? I would need to know the width of the lines on the CD. This concept would be hard to explain to school students. Perhaps the Young's double slit experiment can be used to explain the concepts.
- Would it be simpler to use a diffraction grating opposed to the reflection grating.
- It is becoming pbvious that the flame is not just due to a specific band and that it is due to a mix of a series of emmission bands. This website provides detail [17].
Over the weekend I made a homemade spectroscope using a CD and cereal box. The rudimentary design is shown below:
- Here is a good website for comparing emmission spectra [18]
It occured to me that the source of light in certain street lamps is sodium vapour and this would be excellent for testinga spectrometer/ spectroscope design. It is a non-turblent source opposed to the flame tests that were tried out in the lab. Serious modifications need to be made to the current design in order to obtain a line spectrum. [19].
Using a Diffraction grating
5/02/2014 & 06/02/2014
A device was made using a DVD diffraction grating. The spacing of the lines on the DVD diffraction grating are much smaller than on the CD so it was hoped that better resolution would be obtained. I decided to try and perfect the design on a sodium vapour street light before taking the device into the lab.
A set of DVDs were bought. I carefully smashed a DVD and pealed off the diffraction grating. The lines on the DVD are circular however the aperture on the camera is small so the diffraction lines on the image did not appear circular. It was negligible.
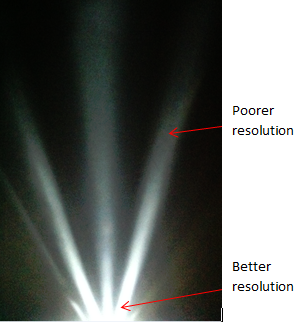
I decided to experiment with the distance of the diffraction grating from the phone camera and I found that I got the best resolution results when the grating was directly attached to the phone camera. I found that this can be explained using a single slit to represent the diffraction grating and shining light at it. From the picture below it is apparent that the strength and resolution of the interference patten is strongest for distances closest to the slit (the slit represents the diffraction grating).
I found that when using a DVD diffraction grating there was no need to have a single slit and all the spectra I recorded below did not have a single slit as recommended on many websites, in this way the experiment can be simplified for school children. The defining factor in the work was the intensity of the light source.
The orientation of the lines needed to be alined with the camera orientation. I did this by just attaching the grating and shining it up to a light and observing the orientation of the spectrum and then changing it accordingly. See left and right images below.
The aim now was to produce a line spectrum.
By attaching a piece of diffraction grating to my phone I was able to take pictures of these Sodium-Mercury street light. You are able to see the Mercury lines in the spectrum.
These 2 spectra are not as good as the other ones below. This is an example of me not allowing the camera to focus on the spectrum and rushing the picture:
The resolution in the below spectra are much better:
The spectra below are zoomed in using the HDR function on the iphone camera. They illustrate the resolution limit well:
The spectra below are for a high pressure sodium street light: The first spectrum below is an example of where the camera was not given enough time to focus on the spectrum and the image is consequently blurred. I found it took about 2 minutes for the camera to focus on the spectrum and produce good definition. Thje spectrum is a virtual image so it is important to remember this.
The below spectra give better resolution:
In the below spectrum you are able to see the spectrum aligned with a per-recorded spectrum of a HPS street lamp. (picture permission given by Michael Roberts, CTO, EcoLuxIndustries)
These spectra depict the phosphorous present in a fluorescent lamp, I took them from 4 different lamps:
07/02/2014
Phosphorous lighting in cafe:
Small fluorescent light in my bedroom:
Phosphorous lighting in train carriage:
Using a Diffraction grating to Record Spectra of the Flame Test Metals
06/02/2014
It was initially very hard to record spectra. I tried all the metal ions mentioned in the above section. I wasn't able to generate any results.
I had to try and find a way to stabilise the flame as it was very turbulent in the fume hood. I made a wind shield and ensure the environment was as dark as possible. There was still a certain amount of 'flickering' of the flame. It was very apparent that the more intense the light source the better the spectra, this can be seen from the phosphorous light examples.
The phosphorous light in the train is qualitatively much brighter than my room light so spectrum was much easier to see.
I tried to generate as intense a flame as I could from the confines of the aluminum candle holder. The results for Calcium Chloride are given below. There is overlapping of the lines but it is still possible to pick out the emission lines (Red, Orange, Green).
I was not able to generate good results using the other metal ions, however this image does still illustrate the point.
I would like to try a larger version in an aluminium tray (those used for baking lasagne e.g.) and see if I can generate the required light intensity to generate a spectrum for the other metal halides I trialed in the flame tests.
Meeting 3, Commencing WEEK 3: 7/01/2014
Summary of the meeting and objectives for the forthcoming week:
- prepare a lesson plan for my flame test spectra lesson. Devise an experimental section for the lesson. Laura suggested that the pupils are given the DVD diffraction grating the lesson before and then they can record the spectra in preparation for the lesson.
- Come up with an idea for the next 'calender day'. I suggested that Green Chemistry could be included in St Patrick's Day. Laura and Andrew gave me a couple of books to look for reaction ideas that could be used for a school lessons.
- We spoke about ideas for valentines Day, I suggested that that scents such as esters would be a good idea. I found a practical that uses EDTA and rhubarb extrac and gives a pink colour for the complexation. Similarly acid and base indicators give pink and blue colours.
- I need to start writing up the flame test experiment and should not leave it until the end.
- Andrew said it would be a good idea if I came up with shopping lists for the lessons.
- I need to have all the teaching resources ready.
Here is the As level syllabus for OCR, the Green & Sustainable Chemistry' topic is on page 35: http://www.ocr.org.uk/Images/81089-specification.pdf
St Patrick's Day Lesson
I am going to talk about green chemistry.
Fried egg
10/02/2014
When I teaching in a school last year I liked to use the fried egg analogy to explain the difference between atom economy and percentage yield:
The atom economy is going to be less than 100 % as you can't cook the egg shell but you can try and get the percentage yield for the fried egg as close to 100% as possible depending upon how carefully you crack the egg.
I have found something that could be used as a fun ice breaker for the lesson to explain this concept. I remember that it caused certain confusion in my class when I first learnt the 2 concepts.
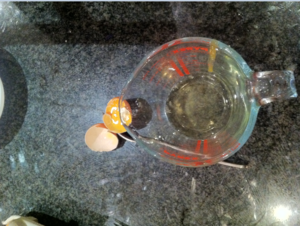
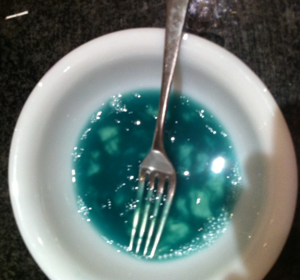
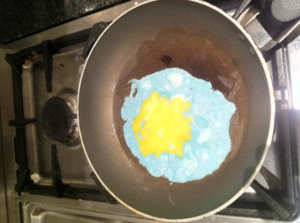
I want to fry an egg, but I want the yolk to be green to give it a St Patricks day flavour. See the webpage below for details.
http://chemistry.about.com/od/chemistryhowtoguide/a/friedgreenegg.htm
In short:
- crack the egg
- separate the yolk from the white.
- Add red cabbage extract to the egg white
- recombine the 2 and then cook the egg which appears green.
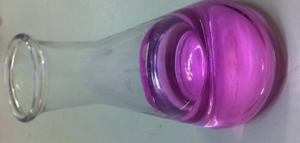
How carefully you separate and recombine the white and yolk determines the percentage yield. The atom economy is fixed as the shell is not used for cooking. I could give arbitrary numbers for the students to perform simple calculations and thus introduce the idea. I can also explain that the red cabbage extract is a pH indicator is red when acidic but turns green when in contact with the alkaline yolk. ( this is relevant to acids and bases that the students will have learnt earlier in the year).
 |
 |
 |
 |
Green flower
11/02/2014
I looked into ideas for the second experiment here are some of the ones I came up with. this might be a nice touch at the front of the lesson in a couple of varses. carnations are the best according to this website: http://www.stevespanglerscience.com/lab/experiments/colorful-carnations and all you need to do is add a little green food colouring to the varse the night before and the flowers will absorb the pigment. Of course this theme ties in with using plants as a source of biofuels rather than fossil fuels.
Green coloured plastic
http://scifun.chem.wisc.edu/homeexpts/gluep.htm
Solvent Free Reactions
Demonstrating the Greenhouse Effect
http://www.journalofanimalscience.org/content/73/8/2483.full.pdf REFERENCE FOR METHANE PRODUCTION FROM CATTLE FOR STUDENT RESOURCE
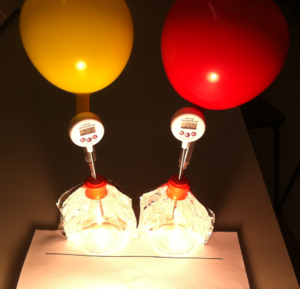
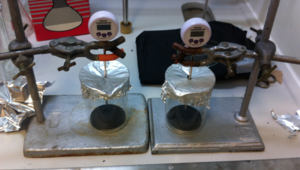
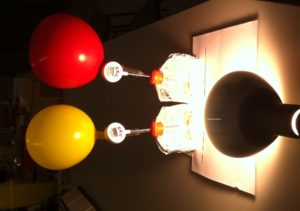
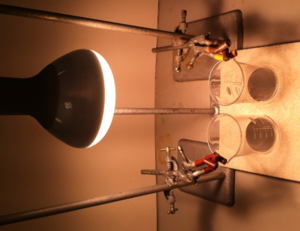
I found this article in J. Chem. Ed. which gives a simple experiment to show how CO2 absorbs IR radiation giving the temperature difference when it is warmed with a heat lamp. [20].
The aim is to show the effect of greenhouse gases by making CO2 and CH4 and using them in the set up described in the above reference.
I want to fill a balloon up with CO2 and also with methane. Ideally I will produce the methane from a biofuel source as described in [21].
I have devised a way to produce CO2 using sodium bicarbonate and ethanoic acid: NaHCO3 + CH3COOH --> CO2 + H2O + CH3COONa [22]
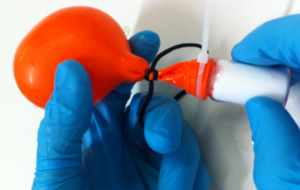
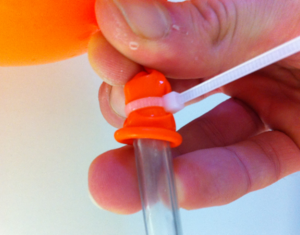
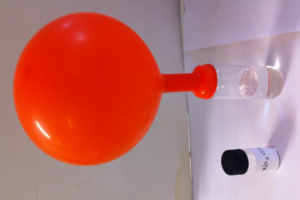
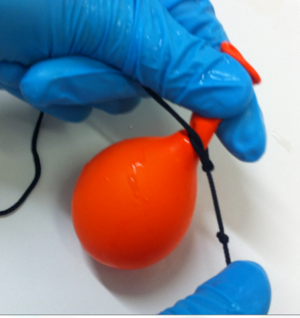
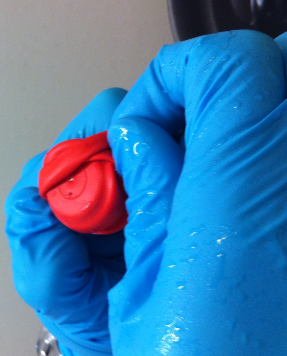
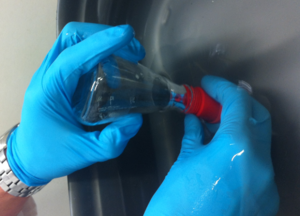
I will fill up a small pot with sodium bicarbonate (weigh out an amount) and then add ethanoic acid (1:1 ratio) to a balloon (inside the balloon). I then need to fix the balloon to the small pot, ensuring it is air tight. The tip the balloon to the acid and salt mix and then CO2 gas will be given off according to the equation. The students can calculate the percentage yield and atom economy of these reactions. This will be an example of calculating the percentage yield when a gas is involved and will give the pupils practice with mole calculations for gases. This could be a challenging examination question.
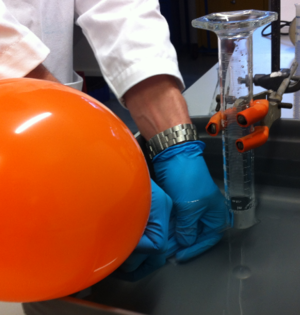
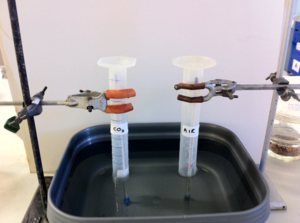
I would like the students to work out how much gas is produced by first bubbling the gas through water into an inverted measuring cylinder. They should then repeat the procedure with the exact same quantities for the CO2 experiment.
If it is not possible to obtain ethanoic acid and sodium carbonate, baking soda and distilled vinegar can be used. This may be useful as it will add complexity to the mole calculation as the students will have to work out the percentage of sodium carbonate in the soda and for vinegar etc.
I am working on a way of generating my own methane.
I will take a IR spectrum of CO2 and Methane so the students can learn about the spectroscopic aspect of the work and how to measure atmospheric CO2 and methane presence from IR stretches.
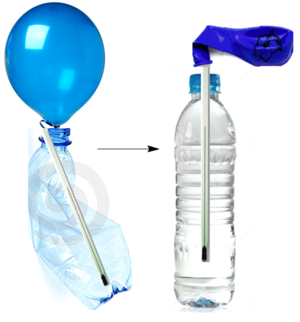
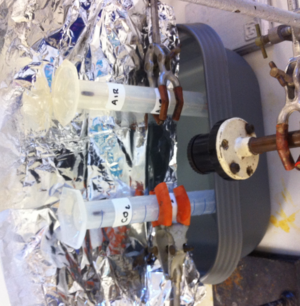
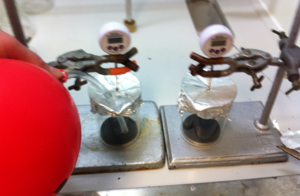
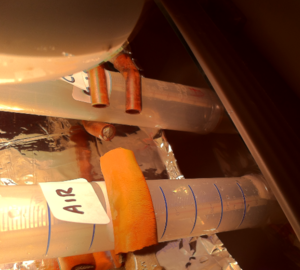
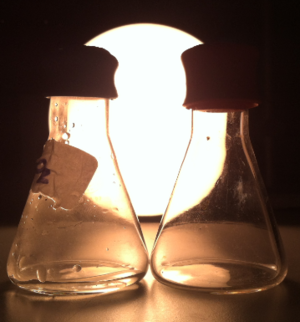
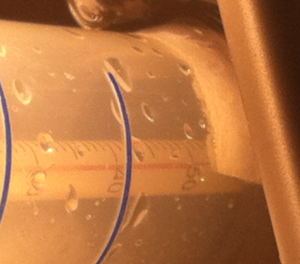
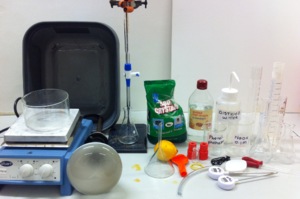
The plan is to use 2 large drinks bottles without the tops. Place a thermometer in the drinks bottles and suck all the air out with an attached syringe. Fix the CO2 balloon from the previous part to the top and fill the bottle with CO2. Leave the other bottle with a thermometer in as a standard. It will be filled with normal air.
At the back face of each balloon attach a piece of silver foil. This will mimic the earths surface as it reradiates the 'sun's' energy. Measure the temperature change then each bottle is radiated.
I hope to try this with methane.
 |
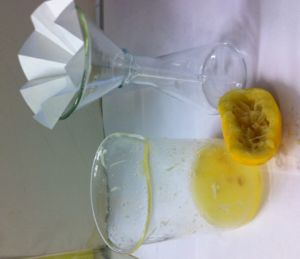
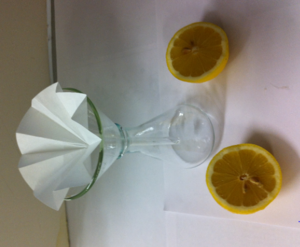
reference for citric acid in lemon juice: http://www.ncbi.nlm.nih.gov/pmc/articles/PMC2637791/
reference for making methane http://www.bbsrc.ac.uk/web/FILES/Resources/activity-1a-biogas-generator.pdf
12/02/2014
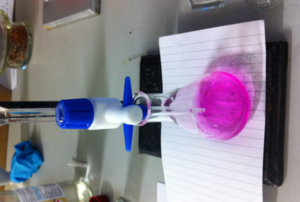
- I bought lemon juice and distilled vinegar from Sainsburys and performed titrations to work out their respective molarities.
- I made phenolphathlein indicator by adding 0.1 g of crystals to 10 mL of ditilled water and then again to 10 mL of ethanol.
- lemon juice and vinegar were titrated against 0.1 M NaOH to work out the concentration of citric and acetic acid respectively and the results are given in the table below:
| Titre | trial 1 | trial 2 | trial 3 | average |
|---|---|---|---|---|
| Lemon Juice | ||||
| Vinegar |
- I performed an acid titration on baking soda and washing soda and the results are given below:
| Titre | trial 1 | trial 2 | trial 3 | average |
|---|---|---|---|---|
| washing soda |
- It became apparent that the baking soda contianed a range of carbonates, not sodium carbonate exclusively. It contained sodium hydrogen carbonate and sodium sequicarbonate. This meant that the it would not be possible to calculate the mass needed and the calculation would be inaccurate.
- I used the results from the calcuation to measure out the stoichiometric amount of green acid + carbonate that should react. I tried the 4 combinations and measrued the percentage yield. The results are given in the table below:
| Combination | Percentage Yield |
|---|---|
| Lemon Juice + Sodium Carbonate | |
| Lemon Juice + washing soda | |
| vinegar + sodium carbonate | |
| Vinegar + washing soda |
13/02/2014 & 14/02/2014
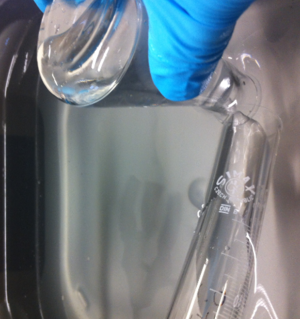
- I tired various ways of demonstrating the greenhouse effect, all of which were unsuccessful, I was however successful in demonstrating that carbon dioxide is a greenhouse gas. In order to save time I used a small amount of solid carbon dioxide and placed it into a balloon as my source of CO2 rather than generate it with reaction every time.
17/02/2014
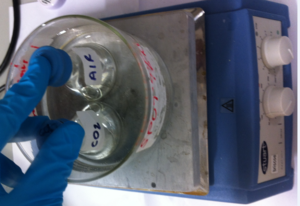
- I trialled the experiment from start to finish and yes I can see the whole lesson being a double 2 hour period. I pictures and ran IR of carbon dioxide gas spectra and nitrogen spectra (nitrogen being the most common component in the atmosphere. These are included in the teaching resource.
APOLOGIES - PICTURES AREN'T IN ORDER YET
 |
 |
 |
 |
 |
 |
 |
 |
 |
 |
 |
 |
 |
 |
 |
 |
 |
 |
 |
 |
 |
 |
 |
 |
 |
 |
 |
 |
 |
 |
 |
18-24/02/2014
I wrote up the teaching resources for the first 2 lessons which are uploaded on a new wiki for the teachers to access:
http://wiki.ch.ic.ac.uk/wiki/index.php?title=Mod:SCHOOL_RESOURCES
I planned the new experiment which is drafted below
Meeting 4, Commencing WEEK 4: 7/01/2014
Valentines Day
Thinking of valentines day ideas: http://chemistry.about.com/od/chemistrydemonstrations/a/Gallium-Beating-Heart.htm
http://chemistry.about.com/od/valentinesdaychemistry/tp/valentines-day-chemistry.htm
how many water drops can you add onto a penny
lift up the cup and it will be in its form of the cup
https://www.youtube.com/watch?v=cl88QEll-Xc&list=RDEaKDOYTZbJg
synthesis of geraniol to geranyl acetate http://www.doiserbia.nb.rs/img/doi/0354-4664/2011/0354-46641104111V.pdf
http://www.sigmaaldrich.com/catalog/product/aldrich/163333?lang=en®ion=GB
http://pubs.acs.org/doi/pdf/10.1021/ct7001495
http://www.ocr.org.uk/Images/81089-specification.pdf
http://onlinelibrary.wiley.com/doi/10.1002/14356007.a11_141/pdf page 85 for geraniol
http://books.google.co.uk/books?id=YUlLAQAAQBAJ&pg=PA103&lpg=PA103&dq=geranyl+acetate+odour+different+from+geraniol&source=bl&ots=ftjHW9Y07g&sig=TEhnB0G2vtovrWuSTXtksqYMKVE&hl=en&sa=X&ei=zxUFU4mfM9ORhQethoCYCA&ved=0CD8Q6AEwAw#v=onepage&q=geranyl%20acetate%20odour%20different%20from%20geraniol&f=false page 103 it explains how the odour is stronger for geraniol acetae than geraniol. this can be used as a detector to check that the reaction is complete.
how to do a test tube reaction http://answers.yahoo.com/question/index?qid=20070703033350AAHx02A
for the chromatography part: geraniol is soluble in hexane... water/ hexane mix? geranyl acetate <0.1 g sollubility in water, geraniol 686 mg/L.
this webpage explains why geraniol is converted into geranyl acetate. http://biocyc.org/META/NEW-IMAGE?type=PATHWAY&object=PWY-5835. SEE THIS WEBPAGE FOR THE OTHER REFERENCES. the concs seem to depend upon the fertility of the plant. http://www.ncbi.nlm.nih.gov/pubmed/11397433
http://www.ncbi.nlm.nih.gov/pubmed/12737976
- natural product synthesis.
geraniol solluble in hexane: http://jonnsaromatherapy.com/pdf/GC-MS_Cymbopogon_martini_2004_01.pdf
Reference for tlc geraniol - toluene:ethyl acetate 96:4
Singh, N., R. Luthra and R.S. Sangwan, 1990. Oxidative pathways and essential oil biosynthesis in the developing lemongrass (Cymbopogon flexuosus) leaf. Plant Physiol. Biochem., 28: 703-710.
http://www.chem.umass.edu/~samal/269/ester.pdf a good introduction http://www.organic-chemistry.org/namedreactions/fischer-esterification.shtm really useful reference on the equilibrium around esters and mechanism
le chatelier principle
molecular sieves prof don craig heteraromatics
Lab Diary
24/02/2014
I realised that I had not worked out the slit spacing on the DVD diffraction grating and compared it to the CD diffraction grating. I ran the experiment with a laser and worked out the spacing. SEE LAB BOOK.
using Bragg's Law, 2 lasers of 532 nm GREEN and 650 nm RED. measure a distance from the screen and then the distance from the 0th order to the 1st order
DVD RED LIGHT distance from screen distance from 0th order slit spacing 5cm 11.4 cm 7.0986 *10^-7 m 10 cm 20.5 cm 7.2324 *10^-7 m 13cm 27.1 cm 7.2099 *10^ -7 m
GREEN LIGHT distance from screen distance from 0th order slit spacing 5 cm 5.7 7.0765 *10-7 m 10 cm 10.9 7.208355 *10 -7 m 13 cm 14.3 7.1913 *10 ^-7 m
CD RED LIGHT distance from screen distance from 0th order 16cm 22cm 30 cm
GREEN LIGHT distance from screen distance from 0th order 16cm 22cm 30cm
25/02/2014
I ran the esterification reaction in ethanol and took an IR spectrum to see if it had gone to completion. Large OH peak in the spectrum, this could have been due to the ethanol remaining in the reactuion and not having been removed via the rotavap. As such: I ran the esterification reaction in hexane and rotavaped and took an IR spectrum to see if it had gone to completion. There was still an OH peak in the spectrum.
I monitored both reactions by TLC and there was always a geraniol spot. eluent as described above. I ran both esterifications for an hour each.
26-27/02/2014 I decided to run a computation (using Gaussian) of the reaction to see what the value of Kc was and the free energies of the reaction. SEE NOTE BOOK
28/02/2014
ran the reaction without a solvent and changed the set up and changed the equilibrium composition. I measured how much water I was able to extract from the equilibrium. As had an excess of acetic acid (double mole ratio). wanted to pull the reaction towards the right hand side so the school students could smell the difference (i.e. all acid removed and just ester remaining). had to do reaction work-up as described in lab book, and why i decided to use an excess of acetic acid.
3/03/2014
ran IR spectrum of worked up reaction, obvious ester peaks, and a very small amount of hydroxyl remaining probably due to geraniol. monitored by tlc it is best to do the reaction without a solvent, this makes the work up so much easier for the school children.
4/03/2014
Ran the reaction on a large scale and monitored by TLC to check it worked. analysed what i had sone to see if any improvements could ghave been made
6 & 7 /03/2014
In out reach lab and writing up results. See teacher feedback form
Lab Diary - See Lab Notebook
See Notebook for DSSC work
SEE THIS WIKI FOR SCHOOL RESOURCES http://wiki.ch.ic.ac.uk/wiki/index.php?title=Mod:SCHOOL_RESOURCES
References
- ↑ http://www.theguardian.com/education/2009/aug/25/teachers-choosing-exam-boards-gcse
- ↑ http://www.aqa.org.uk/about-us
- ↑ http://www.aqa.org.uk/subjects/science/gcse/chemistry-4402
- ↑ http://filestore.aqa.org.uk/subjects/AQA-4402-W-SP-14.PDF
- ↑ http://www.rigb.org/christmas-lectures
- ↑ http://sms.cam.ac.uk/media/1183095
- ↑ Smith, E. T. J. Chem. Educ. 1995, 72, 828.
- ↑ http://pubs.acs.org/doi/abs/10.1021/ed081p969
- ↑ http://pubs.acs.org/doi/abs/10.1021/ed081p969
- ↑ http://pubs.acs.org/doi/pdf/10.1021/ed086p577
- ↑ http://pubs.acs.org/doi/pdf/10.1021/ed085p522.2
- ↑ http://pubs.acs.org/doi/pdf/10.1021/ed069p828.
- ↑ http://pubs.acs.org/doi/pdf/10.1021/ed085p522.2
- ↑ http://www.jce.divched.org/video/colors-elements-flame-aluminum-chloride
- ↑ http://sci-toys.com/scitoys/scitoys/light/cd_spectroscope/spectroscope.html
- ↑ https://bb.imperial.ac.uk/bbcswebdav/pid-248159-dt-content-rid-1236780_1/courses/DSS-CH3_LABS-13_14/Physical%2013-14/P3-14%20Printed%20Spectrometer.pdf
- ↑ http://www.chemguide.co.uk/inorganic/group1/flametests.html
- ↑ http://chemistry.bd.psu.edu/jircitano/periodic4.html
- ↑ http://unicorn.ps.uci.edu/H2A/handouts/PDFs/sodium.pdf
- ↑ http://pubs.acs.org/doi/pdf/10.1021/ed070p73
- ↑ Experiments in Green and Sustainable Chemistry; H. W. Roesky & D. K. Kennepohl; 2009;38;233-237
- ↑ http://www.instructables.com/id/Making-Carbon-Dioxide-At-Home/.

