Rep:Mod:BHT1234
Use of Gaussian Software to Predict Molecular Characteristics
In order to get a better understanding of key molecular characteristics, as well as quantitatively determining molecular orbitals and their respective energies, it is often necessary to use specific software that performs some approximations in order to calculate these parameters. GaussView is an example of this software, and in this case was first used to optimise the molecules studied, which could then allow an accurate representation of the molecular orbitals involved in chemical bonding. Other applications tested are the prediction of the IR spectrum and vibrational modes for each of the molecules studied, along with a calculation for energy change of the Haber-Bosch reaction.
In order to make this type of calculation possible on normal computers, the B3 LYP method, which is a type of approximation used to obtain a value of exchange-correlation energy of electrons, can be used to determine many different molecule characteristics, such as bond length.
Optimisation of Molecules Involved in the Haber-Bosch Process
Optimised NH3 Molecule
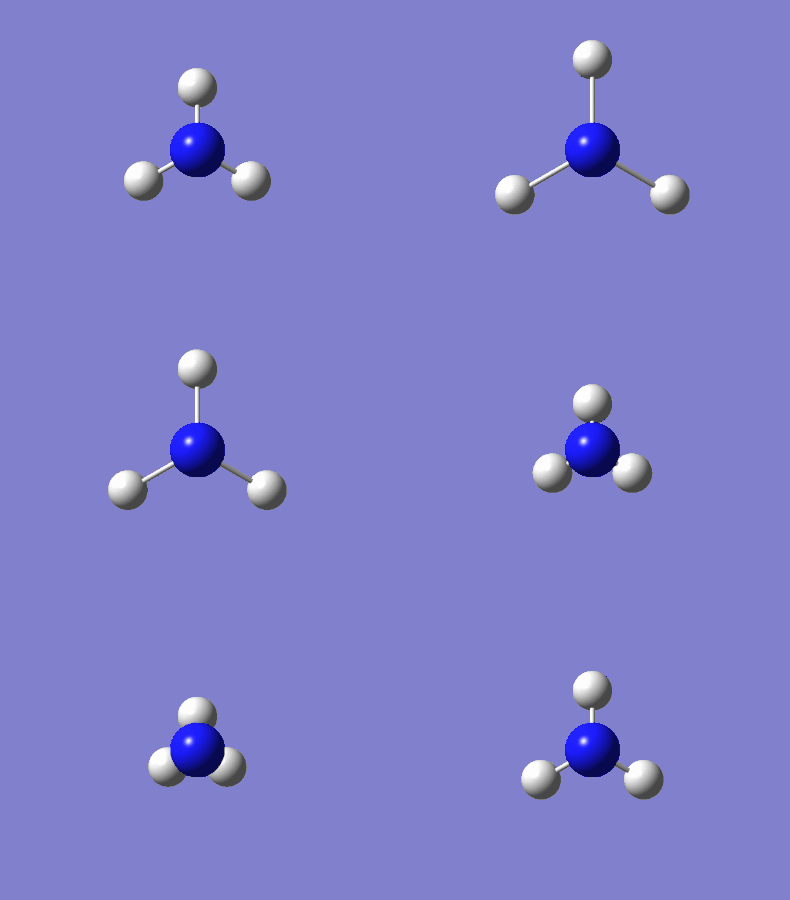
A visualisation of the NH3 molecule can be seen in Figure 1, while a summary of the molecular characteristics for ammonia is shown in the table below. The final energy of the molecule represents the energy at equilibrium bond length, while the RMS gradient essentially describes the energy change of the molecule as the distance between the atoms is changed. An RMS gradient close to zero corresponds to a molecule very close to or at it's minimum energy. The basis set describes a set of functions that are combined to solve the Schrödinger equation and calculate the molecular orbitals. When compared to literature values obtained by A. H. Pakiari et al.[1], the bond angle obtained from the Gaussian calculation is fairly consistent, determining a value of 105.7° as opposed to 106.5°. The bond length determined was also close to experimental values, with the calculated length of 1.018 Å comparing well to the literature value of 1.016 Å.
| Information | Values |
|---|---|
| Molecule | NH3 |
| Calculation Method | B3LYP |
| Basis Set | 6-31G(d.p) |
| Final Energy (au) | -56.55776873 |
| RMS Gradient (au) | 4.85 x 10⁻⁶ |
| Molecule Point Group | C3V |
| N-H Bond Length (Å) | 1.01798 |
| H-N-H Bond Angle (°) | 105.741 |
The convergence parameters for the equilibrium bond length are shown below, with the threshold determining the value below which the result is classed as converged. At equilibrium bond length, the maximum and RMS forces tend to zero, while the displacement values indicate the distance travelled from the last iteration of the software calculation. These values never completely equal zero due to errors from the way the software rounds numbers, which is why a threshold is used to determine the convergence.
| Convergence Parameters | Value | Threshold |
|---|---|---|
| Maximum Force (au) | 0.000004 | 0.000450 |
| RMS Force (au) | 0.000004 | 0.000300 |
| Maximum Displacement (au) | 0.000072 | 0.001800 |
| RMS Displacement (au) | 0.000035 | 0.001200 |
Figure 1 - Interactive Diagram of Optimised Ammonia |
The original optimisation .LOG file can be seen here

NH3 Molecular Vibrations
According to the 3N-6 rule for calculating the number of possible vibrations in an NH3 molecule, a total of 6 observed vibrations would be expected. The vibration frequencies, as well as the type of vibration can be seen in Figure 2. As seen in the diagram, bond modes 1, 2, and 3 correspond to bending vibrations due to their lower frequency, while modes 4, 5, and 6 are all stretching vibrations. In addition, vibration modes 2 and 3 are degenerate, as are modes 5 and 6, due to the fact they have the same vibrational frequencies. Vibrational mode 4 is a particularly symmetric stretch, while mode 1 could be regarded as an 'umbrella' bend due to the specific movement of the N-H bond angles. A gif of vibrational mode 4 is shown below.
Due to the degeneracy of the aforementioned modes, a total of 4 separate absorptions would therefore be expected in the experimental spectrum of gaseous ammonia. However, the very low intensity of modes 4, 5, and 6, mean it is highly likely that they would not be detected by the spectrometer, so only two absorptions would be present.
NH3 Charge Analysis
Following the electronegativity trends, it is expected that the more electronegative nitrogen atom within gaseous ammonia would have a slightly negative charge, while the less electronegative hydrogen atoms would therefore have a slight positive charge in the ammonia molecule. This is supported by the fact that gaseous ammonia can undergo hydrogen bonding, suggesting a relatively substantial difference in the charges on the nitrogen and hydrogen atoms.
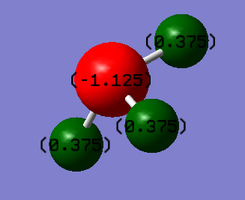
This is also consistent with the charge distribution values achieved from the Gaussian calculations, producing a value of -1.125 on the nitrogen atom, while a value of 0.375 was determined for the hydrogen atoms. These values are summarised in Figure 3.
Optimised N2 Molecule
Once again, a diatomic molecule of nitrogen was optimised using the same calculations for NH3, with the summary shown in the table below. Comparing the bond length obtained from the software to literature values from S. Chattopadhyay et al.[2], the value of 1.111 Å achieved is also relatively close to the experimental value of 1.098 Å.
| Information | Values |
|---|---|
| Molecule | N2 |
| Calculation Method | B3LYP |
| Basis Set | 6-31G(d.p) |
| Final Energy (au) | -109.52412868 |
| RMS Gradient (au) | 6.0 x 10⁻⁷ |
| Molecule Point Group | D∞H |
| NΞN Bond Length (Å) | 1.10550 |
The convergence parameters are also shown below, with all values being determined as very close to zero.
| Convergence parameters | Value (au) | Threshold (au) |
|---|---|---|
| Maximum Force | 0.000001 | 0.000450 |
| RMS Force | 0.000001 | 0.000300 |
| Maximum Displacement | 0.000000 | 0.001800 |
| RMS Displacement | 0.000000 | 0.001200 |
An interactive diagram of the optimised N2 molecule is shown in Figure 4
Figure 4 - Interactive Diagram of Optimised Nitrogen |
The original optimisation .LOG file can be seen here
N2 Molecular Vibrations
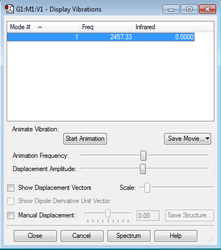
As N2 is a linear molecule, the quantity of vibrational modes are expected to follow the 3N-5 rule, producing a single vibrational mode. Once again, the results are consistent with this prediction, with a single symmetric stretch being observed at the frequency of 2457.33 Hz, shown in Figure 5. As this stretch is symmetric, it would not affect the dipole position in the molecule, so it is predicted that no significant peaks of absorption would be observed in the experimental spectrum.
N2 Charge Analysis
Due to the fact that N2 is diatomic and composed of two, equally electronegative nitrogen atoms, it is expected that the relative charge on each atom will be 0, since the electron density is shared equally over the whole molecule. This expectation is also confirmed by the values determined by the Gaussian software, with each atom having a relative charge of 0.
Optimised H2 Molecule
A hydrogen molecule was also optimised using the B3 LYP method, with a comparably lower stabilisation being reported for the bond. A summary for the molecule can again be seen in the table below. The bond length obtained for this atom is very close to the literature values obtained by D. J. Tozer et al.[3]. A value of 0.743 Å obtained from the Gaussian calculation is very comparable to the experimental value of 0.741 Å.
| Information | Values |
|---|---|
| Molecule | H2 |
| Calculation Method | B3LYP |
| Basis Set | 6-31G(d.p) |
| Final Energy (au) | -1.17853936 |
| RMS Gradient (au) | 1.7 x 10⁻⁷ |
| Molecule Point Group | D∞H |
| H-H Bond Length (Å) | 0.74279 |
The force and displacement values for the molecule at equilibrium are also reported in the following table.
| Convergence Parameters | Value (au) | Threshold (au) |
|---|---|---|
| Maximum Force | 0.000000 | 0.000450 |
| RMS Force | 0.000000 | 0.000300 |
| Maximum Displacement | 0.000000 | 0.001800 |
| RMS Displacement | 0.000001 | 0.001200 |
The interactive diagram for the optimised H2 molecule is shown below in Figure 6.
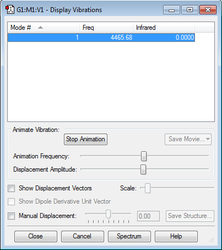
Figure 6 - Interactive Diagram of Optimised Hydrogen Molecule |
The original optimisation .LOG file can be seen here
H2 Molecular Vibrations
Similar to the N2 molecule, H2 is linear and will therefore follow the 3N-5 rule. As a result, only one vibrational mode is expected. Since this vibrational mode is symmetric, there will again be no change in the dipole position, and, like diatomic nitrogen, there would be no expected peaks in the IR spectrum of H2. A summary of the vibrational mode can be seen in Figure 7.
H2 Charge Analysis
As the hydrogen molecule is linear and diatomic, with the atoms being equally electronegative, an equal charge distribution is expected. As a result, a relative charge of 0 is predicted on each atom. Once again, this observation is backed up by the Gaussian calculation, confirming an equal charge distribution in the molecule
Predicting Reaction Energy for Haber-Bosch Process
The Haber-Bosch process is a fundamental industrial reaction which yields gaseous ammonia for use in fertiliser chemicals in the agriculture industry, among many other applications. The overall equation for the reaction can be seen below:
N2 + 3H2 → 2NH3
From the above molecular optimisations, the overall energy change for this reaction can be calculated by subtracting the energy of the reactants from that of the products. The respective energies are summarised in the table below, with the overall energy change for reaction being determined as -146.48 KJ/mol to two decimal places. Due to the fact that this calculation only involves individual molecules and does not include intermolecular interactions (among many other factors), this value cannot be compared with experimental data. Despite the disparity with literature values, this does show that the gaseous ammonia formed is more stable than the reactants, since the forward reaction is favourable and the product is lower in energy than the reactants (shown by the negative energy change value).
| Species | Energy (au) |
|---|---|
| NH3 | -56.55776873 |
| 2NH3 | -113.11553746 |
| N2 | -109.52412868 |
| H2 | -1.17853936 |
| 3H2 | -3.53561808 |
| E(Products - Reactants) | -0.00557907 |
Further Molecular Optimisations - CH4
Optimised CH4 Molecule
Following the same optimisation procedure as the above molecules, a summary of the Gaussian calculation for a CH4 molecule can be seen in the following table. Once again, the Gaussian values calculated are close to those of the literature provided by H. Li et al.[4], with a bond length of 1.092 Å comparing well to the literature value of 1.093 Å. The determined bond angle of 109.5° is the same as the experimental value reported.
| Information | Values |
|---|---|
| Molecule | CH4 |
| Calculation Method | B3LYP |
| Basis Set | 6-31G(d.p) |
| Final Energy (au) | -40.52401404 |
| RMS Gradient (au) | 0.00003263 |
| Molecule Point Group | TD |
| C-H Bond Length (Å) | 1.09197 |
| H-C-H Bond Angle (°) | 109.47122 |
The convergence parameters are also shown below, with values well below the threshold, although it should be noted that these are significantly higher than the convergence values for the other molecules.
| Convergence Parameters | Value | Threshold |
|---|---|---|
| Maximum Force | 0.000063 | 0.000450 |
| RMS Force | 0.000034 | 0.000300 |
| Maximum Displacement | 0.000179 | 0.001800 |
| RMS Displacement | 0.000095 | 0.001200 |
The interactive diagram for the optimised CH4 molecule can be seen below in Figure 8.
Figure 8 - Interactive Diagram of Optimised Methane |
The original optimisation .LOG file can be seen here
CH4 Molecular Vibrations
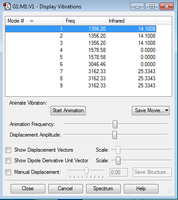
The non-linear nature of CH4 means it follows the same 3N-6 rule as the NH3 molecule above. The expected number of vibrations from this rule is 9, which is also observed in the Gaussian visualisations. The number and frequency of vibrational modes are shown in Figure 9. As can be seen from the lower frequency values, there are 5 'bending' vibrational modes for CH4. Modes 1, 2, and 3 are all degenerate, while the same can be said for modes 4 and 5.
There are also 4 'stretching' frequencies present, with vibrational modes 7, 8, and 9 once again being degenerate. This gives a total of 4 unique vibrational modes in the CH4 molecule. Vibrational mode 6 is a highly symmetrical stretch, so does not change the molecule dipole and therefore produces no absorption in the IR spectrum. Modes 4 and 5 also do not change the dipole in the molecule, meaning only 2 absorptions are expected in the experimental spectrum of pure methane.
CH4 Charge Analysis
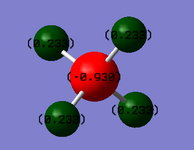
The relative charges on the atoms in a methane molecule can be seen in Figure 10, with the carbon atom having a slight negative charge compared to the hydrogen atoms, which are all very slightly positively charged. This could be explained by the slightly higher electronegativity of the carbon atom compared to the hydrogen atoms, meaning the electrons are pulled slightly towards the centre of the molecule.
Example Molecular Orbitals in CH4
A summary of the five occupied molecular orbitals in the methane molecule can be seen in Figures 11 to 16. The lowest energy MO (Figure 11) is that of the two electrons in the 1s orbital of carbon. Since these are held very close to the carbon atom and do not contribute to the bonding molecular orbitals, they are very low in energy and are therefore the most stable. The 2nd most stable MO (and therefore 2nd lowest in energy) is formed from the overlap of the 2s electrons in carbon with the 1s electrons in the hydrogen atoms (Figure 113). Since these orbitals are also fairly stable, the resultant molecular orbital formed is slightly lower in energy than the 3rd, 4th, and 5th occupied molecular orbitals, although it is still much higher in energy than the 1s molecular orbital.
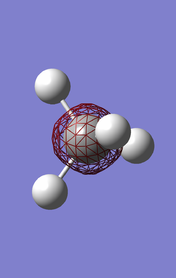


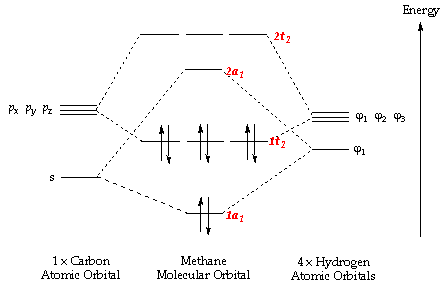


The last three molecular orbitals (Figures 14-16) are all degenerate in energy and are formed from the overlap of the electrons in the three carbon 2p orbitals with the hydrogen 1s orbitals. The three orbitals differ in geometry based on the distinct geometries of the 2px, 2py, and 2pz orbitals, as well as the different phases of the 1s orbitals in the hydrogen atoms, affecting the overlap and the molecular orbitals produced. The energies for these orbitals are also the highest, due to the higher energy of the p orbitals which form the molecular orbitals. This means they are therefore classified as the HOMO (Highest Occupied Molecular Orbital) of methane. The LUMO (Lowest Unoccupied Molecular Orbital) is the anti-bonding orbital formed from the overlap of the carbon 2s orbital with the 1s orbital in the hydrogen atoms. A molecular orbital diagram displaying all of the bonding and anti-bonding orbitals is shown in Figure 12.
References
- ↑ 1. Pakiari AH, Nazari F. The study of relationship between chemical geometry and electronic configuration, non-Walsh type B Part II. J Mol Struct THEOCHEM. 2005;717(1-3):189–97.
- ↑ 1. Chattopadhyay S, Chaudhuri RK, Mahapatra US. Application of improved virtual orbital based multireference methods to N2, LiF, and C4H6 systems. J Chem Phys. 2008;129(24).
- ↑ The Journal of Chemical Physics 105, 9200 (1996); doi: 10.1063/1.472753
- ↑ 1. Li H-Y, Pu M, Ji Y-Q, Xu Z-F, Feng W-L. Theoretical study on the reaction path and rate constants of the hydrogen atom abstraction reaction of CH2O with CH3/OH. J Chem Phys [Internet]. 2004;307(1):35–43. Available from: http://www.sciencedirect.com/science/article/pii/S0301010404003787
- ↑ http://www.ch.ic.ac.uk/vchemlib/course/mo_theory/

