Rep:Mod:ArronDeacy
BH3

BH3 Optimisation 3-21G
Log file for the 3-21g optimisation of the BH3 molecule:Media:Arron_Deacy_BH3_OPT_321G.LOG
- File Type: .log
- Calculation type: FOPT
- Calculation method: RB3LYP
- Basis set: 3-21G
- Final Energy: -26.46226433 au
- Gradient: 0.00004507 au
- Dipole moment: 0.00 Debye
- Point Group: D3h
- Calculation time: 12 seconds
- Bond Length: 1.20 Å *lit: 1.19001 Å [1]
- Bond Angle: 120°
Item               Value     Threshold  Converged?
 Maximum Force            0.000090     0.000450     YES
 RMS     Force            0.000059     0.000300     YES
 Maximum Displacement     0.000352     0.001800     YES
 RMS     Displacement     0.000230     0.001200     YES
 Predicted change in Energy=-4.580958D-08
 Optimization completed.
    -- Stationary point found.
BH3 Optimisation 6-31G(d,p)
Log file for the 6-31g optimisation of BH3: Media:ArronDeacy_BH3_OPT_631G.LOG
- File Type: .log
- Calculation Type: FOPT
- Calculation Method: RB3LYP
- Basis Set: 6-31G(d,p)
- Final Energy: -26.61532363 au
- Gradient: 0.00000296 au
- Dipole Moment: 0.00 Debye
- Point Group: D3h
- Calculation time: 7.0 seconds
- Bond length: 1.20 Å
- Lit: 1.19001 Å [1]
- Bond Angle: 120°
As we can see from the Bond length data our new Optimisation has moved closer to the experimental value obtained via electron diffraction.
Item               Value     Threshold  Converged?
 Maximum Force            0.000006     0.000450     YES
 RMS     Force            0.000004     0.000300     YES
 Maximum Displacement     0.000023     0.001800     YES
 RMS     Displacement     0.000015     0.001200     YES
 Predicted change in Energy=-2.008834D-10
 Optimization completed.
    -- Stationary point found.
BH3 Frequency Analysis
Log file of the Frequency analysis of BH3: Media:ARRONDEACY_BH3_FREQ.LOG
- File Type: .log
- Calculation Type: FREQ
- Calculation Method: RB3LYP
- Basis Set: 6-31G(d,p)
- Total Energy: -26.61532363
- Gradient: 0.00000291 au
- Dipole moment: 0.00 Debye
- Point group: D3h
- Calculation time: 9.0 Seconds
- Bond length: 1.20 Å
- Lit: 1.19001 Å [1]
- Bond Angle: 120°
 Low frequencies --- -0.9432 -0.8611 -0.0055 5.7455 11.7246 11.7625
 Low frequencies --- 1162.9963 1213.1826 1213.1853

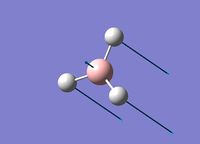
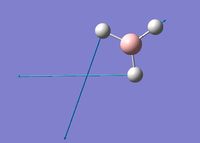
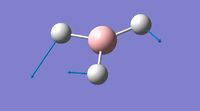
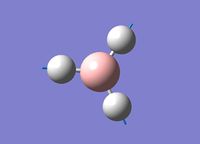
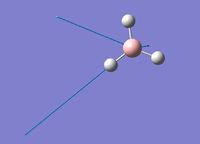
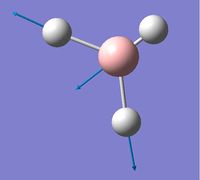
- From the IR Spectrum of BH3 we can see that there are 3 observable peaks, however there were 6 vibrational modes. We can clearly see the a2" peak at 1163.00 cm-1, counting to one mode vibration which is observed. The e' bending vibrational modes are degenerate, and so are indistinguishable and so one peak at 1213.18 cm-1 is observed. The a2" vibrational mode is a symmetric stretch and does not show a change in dipole and so is IR inactive. The Final peak observed at 2715.45 cm-1 are for the e' vibrational modes which are also degenerage and so are also indistinguishable.
BH3 Molecular Orbitals
Log File for the MO analysis of BH3: Media:ArronDeacyBH3 MO 2.LOG
https://spectradspace.lib.imperial.ac.uk:8443/dspace/handle/10042/25264
- File Type: .log
- Calculation Type: SP
- Calculation method: RB3LYP
- Basis Set: 6-31G(d,p)
- Total Energy: -26.61532363
- Gradient: - au
- Dipole Moment: 0.00 Debye
- Point Group: D3
- Calculation Time: 31.9 Seconds

- As we can see in the MO Diagram of BH3 above, the LCAO's are complimented well by the real MO's. The Real MO's are advantageous in the respect that it gives us a real interpretation of the molecular orbitals and gives us a good view of how the orbitals overlap, this also shows us a picture of the wavefucntions for each molecular orbital. However the LCAO's gives us a good way of describing real molecular orbitals as we can easily see which atomic orbitals are involved in bonding and also which symmetry it has. We can also tell from LCAO's which molecular orbitals contribute more electron density by the sizes of the atomic orbitals. Qualitative MO Theory is very useful as it gives us a good starting point to understand how atomic orbitals mix to create molecular orbitals. Also it gives us a good base to be able to understand the real MO's that come out from solving the Schrodinger equation quantitatively. Once LCAO's is fully understood is it more advantageous to use a computational method to solve the Schrodinger equation as it is quicker, more accurate, gives information of the molecular orbitals relative energies and can also be carried out on larger molecules which can be too complicated to work out by hand.
GaBr3
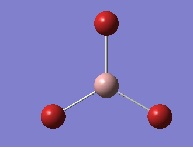
GaBr3 Optimisation LANL2DZ
Log file for the LANL2DZ optimisation of GaBr3: Media:GaBr3.log
https://spectradspace.lib.imperial.ac.uk:8443/dspace/handle/10042/25202
- File Type:.log
- Calculation Type: FOPT
- Calculation Method: RB3LYP
- Basis Set: LANL2DZ
- Total Energy: -41.70082783 au
- Gradient: 0.000000016 au
- Dipole Moment: 0.00 Debye
- Point Group: D3h
- Calculation time: 33.4 Seconds
- Bond length: 2.350 Å lit: 2.239±0.007 Å [2]
- Bond angle: 120.0 *lit: 119.1±0.1 [2]
Item               Value     Threshold  Converged?
 Maximum Force            0.000000     0.000450     YES
 RMS     Force            0.000000     0.000300     YES
 Maximum Displacement     0.000003     0.001800     YES
 RMS     Displacement     0.000002     0.001200     YES
 Predicted change in Energy=-1.282687D-12
 Optimization completed.
    -- Stationary point found.
GaBr3 Frequency Analysis
Log file of the Frequency Analysis of GaBr3: Media:ARRONDEACYGaBr3FREQ.log
https://spectradspace.lib.imperial.ac.uk:8443/dspace/handle/10042/25255
- File Type: .log
- Calculation Type: FREQ
- Calculation Method: RB3LYP
- Basis Set: LANL2DZ
- Total Energy: -41.70082783
- Gradient: 0.00000011 au
- Dipole Moment: 0.00 Debye
- Point group: D3h
- Calculation Time: 16.5 Seconds
- Bond Length: 2.350 Å *lit: 2.249±0.005 Å[2]
- Bond Angle: 120 *lit: 119.1±0.1°[2]
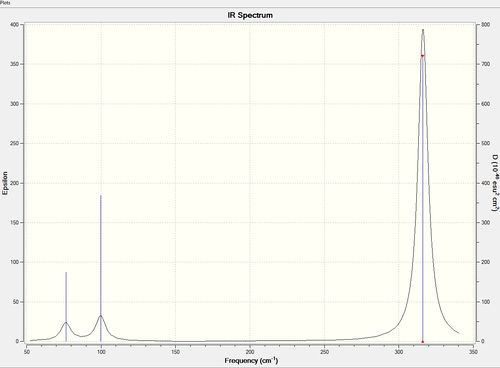
 Low frequencies --- -0.5252 -0.5247 -0.0024 -0.0010 0.0235 1.2010
Low frequencies --- 76.3744 76.3753 99.6982
| no. | Form of Vibration | Frequency | Intensity | Symmetry of D3h points group |
|---|---|---|---|---|
| 1 | 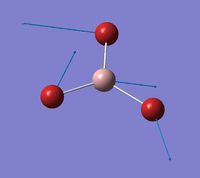 |
76 | 3 | E' |
| 2 | 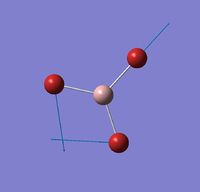 |
76 | 3 | E' |
| 3 | 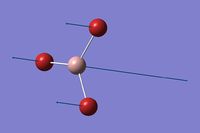 |
99 | 9 | A2" |
| 4 |  |
197 | 0 | A1' |
| 5 |  |
316 | 57 | E' |
| 6 |  |
316 | 57 | E' |
BBr3

BBr3 Optimisation GEN
Log file for Gen Optimisation of BBr3:Media:ArronDeacy_LOG_BBr3.log
https://spectradspace.lib.imperial.ac.uk:8443/dspace/handle/10042/25227
- File Type:.log
- Calculation Type: FOPT
- Calculation Method: RB3LYP
- Basis Set: Gen
- Total Energy: -64.43645296 au
- Gradient: 0.00000382
- Dipole: 0.00 Debye
- Point Group: D3h
- Calculation Time: 34.2 Seconds
- Bond Length: 1.934 Å *lit: 1.918 Å [3]
- Bond Angle: 120 *lit: 120.0(15)[3]
Item               Value     Threshold  Converged?
 Maximum Force            0.000008     0.000450     YES
 RMS     Force            0.000005     0.000300     YES
 Maximum Displacement     0.000036     0.001800     YES
 RMS     Displacement     0.000023     0.001200     YES
 Predicted change in Energy=-4.027688D-10
 Optimization completed.
    -- Stationary point found.
NH3
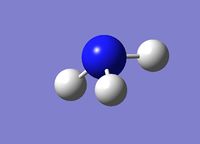
NH3 Optimisation 6-31G(d,p)
Log file for the Optimisation of NH3 molecule:Media:NH3 OPT ARRON.LOG
Optimisation: https://spectradspace.lib.imperial.ac.uk:8443/dspace/handle/10042/25285
- File Type: .log
- Calculation Type: FOPT
- Calculation Method: RB3LYP
- Basis Set: 6-31G(d,p)
- Total Energy: -56.55776856
- Gradient: 0.00000885
- Dipole Moment: 1.8464 Debye
- Point Group: C1
- Calculation Time: 13 Seconds
- Bond Length: 1.01797 Å
- Bond Angle: 105.741
The symmetry of NH3 is known to be C3v, but as the optimisation was contrained to "nosymm" the point group was calculated as C1
Item               Value     Threshold  Converged?
 Maximum Force            0.000024     0.000450     YES
 RMS     Force            0.000012     0.000300     YES
 Maximum Displacement     0.000079     0.001800     YES
 RMS     Displacement     0.000053     0.001200     YES
 Predicted change in Energy=-1.629715D-09
 Optimization completed.
    -- Stationary point found.
NH3 Frequency Analysis
Log file for the Frequency of NH3 Molecule:Media:NH3 FREQ ARRON.log
Frequency Analysis:https://spectradspace.lib.imperial.ac.uk:8443/dspace/handle/10042/25281
- File Type: .log
- Calculation Type: FREQ
- Calculation Method: RB3LYP
- Basis Set: 6-31G(d,p)
- Total Energy: -56.55776856
- Gradient: 0.00000888
- Dipole Moment: 1.8464 Debye
- Point Group: C1
- Calculation time: 49.4 Seconds
- Bond length: 1.01797 Å
- Bond Angle: 105.741°
 Low frequencies --- -30.7764 -0.0016 -0.0014 -0.0011 20.3142 28.2484
Low frequencies --- 1089.5557 1694.1237 1694.1868
NH3 Population Analysis
Log file for the Population Analysis of NH3 Molecule:Media:NH3 POP ARRON.log
Population Analysis:https://spectradspace.lib.imperial.ac.uk:8443/dspace/handle/10042/25284
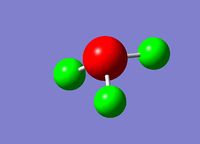
- Charge Range: -1.125 to +0.375
- Charge on Nitrogen: -1.125
- Charge on each Hydrogen: +0.375
NH3BH3
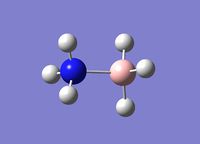
NH3BH3 Optimisation 6-31G(dp)
Log file for the Optimisation of NH3BH3:Media:NH3BH3 OPT ARRON.log
Optimisation:https://spectradspace.lib.imperial.ac.uk:8443/dspace/handle/10042/25289
- File Type: .log
- Calculation Type: FOPT
- Calculation Method: RB3LYP
- Basis Set: 6-31G(d,p)
- Total Energy: -83.22468999 au
- Gradient: 0.00006050 au
- Debye: 5.5650 Debye
- Point Group: C1
- Caculation Time: 1 Minute 34.7 Seconds
- N-B Bond Length: 1.66808 Å
-1.04714   0.00000   0.00003   0.00007   0.00010  -1.04704
         Item               Value     Threshold  Converged?
 Maximum Force            0.000128     0.000450     YES
 RMS     Force            0.000057     0.000300     YES
 Maximum Displacement     0.000631     0.001800     YES
 RMS     Displacement     0.000304     0.001200     YES
 Predicted change in Energy=-1.626464D-07
 Optimization completed.
    -- Stationary point found.
NH3BH3 Frequency analysis
Log file for the Frequency analysis of NH3BH3:Media:NH3BH3 FREQ ARRON.log
Frequency:https://spectradspace.lib.imperial.ac.uk:8443/dspace/handle/10042/25290
- File Type: .log
- Calculation Type: FREQ
- Calculation Method: RB3LYP
- Basis Set: 6-31G(d,p)
- Total Energy: -83.33468980 au
- RMS Gradient - au
- Dipole Moment: 5.57 Debye
- Point Group: C1
 Low frequencies --- -0.0014 -0.0007 -0.0007 17.8653 22.5681 40.7538
Low frequencies --- 266.1825 632.3177 639.1301
Comparisons
Comparison of BH3, BBr3 and GaBr3 bond lengths
| B-H | B-Br | Ga-Br | |
|---|---|---|---|
| Bond lengths (Å) | 1.19 | 1.93 | 2.35 |
When observing a change in bond length due to a change in the ligand the bond lengths of B-H and B-Br are compared. From the data computed from Guassian and the data found in the literature it is clear that an increase in the size of ligand also increases the bond length from 1.19 Å to 1.93 Å. This can explain this by considering several factors. Firstly, both Hydrogen and Bromine are X type ligands. They donate one electron into the central atom as both only require one further electron to complete its outer shell, and so form a single sigma bond. Bromine has a lot more electrons than compared with Hydrogen, thus the electron-electron repulsions between the boron and bromine is much greater than between Boron and Hydrogen and so the bond length increase. When comparing the molecules, Bromine is a lot larger than Hydrogen and so due to the small size of Boron in comparison to Bromine, there is a further repulsion between the bromine atoms and hence extend the length of the bond. We would expect that the change in bond lengths to be proportional to the increase in covalent radii from Hydrogen to Bromine, this corresponds to approximately 0.9 Å, however the computational bond lengths show a change of 0.74 Å. This value suggests there is further attractions between the Bromine and the Boron. This can be explained by an increase in bond order as the lone pair of electrons in the bromine bonds to an empty P-orbital orthogonal to the initial B-Br sigma bond.
When comparing the change in the size of central atom we compare the bond lengths of B-Br and Ga-Br. Both Boron and Gallium are in group 13 and have a valence electron in the P-orbital. From the data computed from Guassian which is complimented by literature, it is clear the increase in the size of central atom also increases the bond lengths. The increase in size of the atom from boron to Gallium reduce the effect of the Bromines repelling each other, and so should reduce the bond length in that respect. However due to there being an more electrons in the Gallium atom adds to the electron-electron replusions between central atom and ligand, increasing the bond length. Due to Gallium being larger than Boron this also has the effect of weaker bonding between the central atom and ligand due to less orbital overlap.
A bond can be described as the level of interaction between two of more species. Its strength is the energy found when solving the Schrodinger equation in which the Hamitonian operator takes into consideration the interations between nuclei-nuclei, electron-electron and electron-nuclei. There are various types of bonds conventionally used by chemists, both intramolecular and intermolecular. Covalent bonds consider the electrostatic attraction between a pair of nuclei and electrons. Conventionally a covalent bond is represented by a line. However ionic bonding is the electrostatic attraction between charged ions and conventionally we do not draw a 'line' to represent a bond. This is one example where a line is not drawn to represent a bond. Therefore although gaussview may not draw a bond, this does not mean there is no interaction between the species. Other types of bonding which does not use 'lines' to represent interactions are; metallic bonding, dipole-dipole interations, Hydrogen bonding and Van der waals forces. There may be a case where gaussview has indicated typical covalent bonding, however it does not indicate 'thought space' bonding, which can be confirmed by the molecular orbital diagrams.
Comparison of BH3 and GaBr3 Frequency Data
| BH3 | GaBr3 | ||||
|---|---|---|---|---|---|
| Frequency | Symmetry | Intensity | Frequency | Symmetry | Intensity |
| 1163 | (A2") | 93 | 76 | (E') | 3 |
| 1213 | (E') | 14 | 76 | (E') | 3 |
| 1213 | (E') | 14 | 100 | (A2") | 9 |
| 2582 | (A1') | 0 | 197 | (A1') | 0 |
| 2715 | (E') | 126 | 316 | (E') | 57 |
| 2715 | (E') | 126 | 316 | (E') | 57 |
The frequency of a vibration is governed by the equation: . Where K is the force constant and μ is the reduced mass. As Gallium and Bromine is both larger than Boron and Hydrogen, the overlap between the two atoms is less in comparison and so the force constant (K) for this bond is less. The reduced mass for GaBr3 is also a lot larger than for the reduced mass of BH3 due to the masses both being larger. Both of these factors contribute to reducing the term '(K/μ)1/2' and hence reduce the value of the frequency (ω). From the table above it is clear to see that the modes of vibration for BH3 and GaBr3 have changed. When looking at the Frequency Analysis for BH3 and GBr3 we can see that there is a a"2 vibration level, which lies below the e' level in BH3. However when looking at the GaBr3 this is not the case, the a"2 frequency is observed higher in frequency than compared to the e'. In the a"2 vibrational transition for both molecules, the symmetry of the molecule changes from D3h to C2v. In this oscillation the substituents move closer together. When comparing this oscillation mode, the Hydrogens oscillate with little repulsions from the surrounding hydrogens and so this vibration is low in energy, however in the GBr3 case, the Bromines move close together and due to steric replusions between the bromines the C3v point group is of much higher energy, leading to a slower rate of oscilation. As the frequency is inversly proportional to the rate of oscilation the frequency is increased.
The IR spectra of BH3 and GaBr3 generated by gaussian show 3 peaks from a possible 6 vibrational modes. In both molecules the 4th vibrational mode (a1') is symmetric and hence IR inactive and so is not observed. The e' symmetry modes are degenerate and so overlap and become indistinguishable, hence 3 distinguishable peaks. The 3 peaks observed are also ordered in relatively the same positions in the spectra with the e' and a2" pair and the higher energy pair; a1' and e'. The pair of lower Energy are both bending vibrations and the pair of higher energy is a stretching vibration. stretching vibrations require more energy than the bending vibrations.
The lowest real normal mode is the lowest molecular vibrations, in the case of BH3 it is 1163 cm-1 The same basis set must be used for the optimisation and frequency analysis for a molecule so the correct minima is found in the potential energy surface created by the basis set optimisation. Each molecule must undergo the same basis set optimisation and frequency analysis to be able to compare the results to one another. using alternate basis set may plot a different potential surface and hence the numbers we get out will be set under the same conditions and hence incomparable. The purpose of carrying out a frequency analysis is to find the minima which was produced in the optimisation. If the energy after the frequency analysis is the same as the energy after optimisation, it means we have a minimum for the same molecule and its geometry. The top row of the low frequencies represent the frequency at which the center of mass translates and rotates and hence are small values, the closer to zero the better. The second row of low frequencies represent the lowest frequencies for the 3N-6 modes of freedom.
Comparison of Energies; NH3, BH3 and NH3BH3
| Molecule | Energy (au) |
|---|---|
| NH3 | -56.55776856 |
| BH3 | -26.61532363 |
| NH3BH3 | -83.22468999 |
Difference in Energy is -0.05159777 au (-135.47kjmol-1)
The Dissociation Energy is equal to +135.47kjmol-1

