Rep:Mod:A monkey, a panda and a leprechaun walk into a bar...
Kandeeban Gopalakrishnan CID:00602999
Introduction
This computational module will focus on two different chemical reactions; the Cope Rearrangement and the Diels-Alder cyclo-addition. This module will involve undergoing calculations in order to determine the energy of the optimised reactants, products and (most importantly) the energy of the transition state in each reaction. As these transition states are extremely hard to observe experimentally due to rapid decomposition, computational chemistry is used frequently by chemists in order to determine the structure, reaction path and energy of such transition states.
Cope Rearrangement
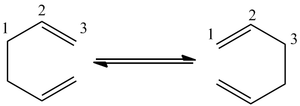
This section of the module will involve the discussion of the Cope Rearrangement[1] involving 1,5-hexadiene. This rearrangement is an example of a concerted pericyclic reaction([3,3]-sigmatropic rearrangement) and furthermore, it is known that this rearrangement proceeds via a transition state. This rearrangement is shown below (Table 1):
 |
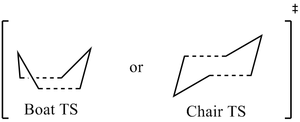 |
As shown in Table 1, it is possible that either a Boat or chair transition state can be formed. After optimisation of the reactants and products, the energies of the transition states will be calculated and compared in order to determine the stability of both transition states relative to each other; thus, this will enable us to determine which reaction path is the most favourable.
 |
 |
 |
Conformers
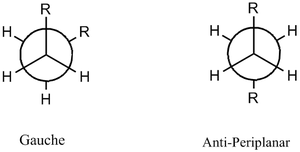
It is evident from examining the structure of 1,5-hexadiene that there are two possible conformations: gauche conformer and the antiperiplanar conformer. Different conformations arise as the orientation of the double bonds with respect to the central carbon atoms can have different distinct orientations. Due to this, six different gauche conformers and four antiperiplanar conformers were drawn on Gaussian and analysed (see table 3); the optimisation of these reactants and products will discussed below. It should be noted that due to the very favourable antiperiplanar interactions [σ(C-H)/σ*(C-H)] and absence of the Pauli (bond-bond) repulsions, the calculations should confirm that the formation of the more stable antiperiplanar conformers is dominant compared to the formation of the Gauche conformers. Furthermore, in the anti-conformation, steric clashing of the large R groups is avoided (however, this clashing does occur in the Gauche conformers).
Once all the structures were drawn on Gaussview (6 structures exhibit Gauche-linkage while 4 structures exhibit Anti-linkage), they were optimised using the Hartree-Foch (HF) method and the 3-21g basis set. Before we move onto the results section, firstly we must understand why this method/basis set was used and what impact a change in either of these parameters would have[2]. Different methods and basis set will result in different computational calculation times and with that, the accuracy of data will also vary. A basis set is a set of mathematically expressed wave-functions that accurately illustrates the molecular orbitals within a molecule. In this module, both the 3-21g and 6-31g (split valence) basis sets will be used. These particular basis sets use multiple basis functions for each s and p orbital, thus giving a good approximation of the molecular orbitals. Due to the simplicity of the 3-21g basis set (compared to other basis sets), calculation times are much faster compared to most of the other basis sets.
A viable option that can also be undergone is the use of polarised basis sets as they take into consideration extra orbitals present in larger atoms i.e. empty d-orbitals in carbon and oxygen atoms. In addition to this, as learned from Module 2, such basis sets allow for a better fit in terms of orbital size rather than a change in shape of the orbital in question. However, due to the limited time available for students (and the longer computational times needed to run calculations using the 6-31g/6-31g* basis sets), nearly all the calculations were run using the 3-21g basis sets (which gave moderately accurate results). The table below shows the energies of each of the 10 conformers:
| Calculation Type | OPT | OPT | OPT | OPT | OPT | OPT |
| Calculation Method | RHF | RHF | RHF | RHF | RHF | RHF |
| Basis Set | 3-21G | 3-21G | 3-21G | 3-21G | 3-21G | 3-21G |
| Total Energy (a.u.) | -231.6877 | -231.6917 | -231.6927 | -231.6915 | -231.6896 | -231.6892 |
| Point Group | C2 | C2 | C1 | C2 | C1 | C1 |
| DOI | DOI:10042/to-13800 | DOI:10042/to-13801 | DOI:10042/to-13802 | DOI:10042/to-13803 | DOI:10042/to-13804 | DOI:10042/to-13805 |
|
|
||||
| Calculation Type | FOPT | FOPT | FOPT | FOPT |
| Calculation Method | RHF | RHF | RHF | RHF |
| Basis Set | 3-21G | 3-21G | 3-21G | 3-21G |
| Total Energy (a.u.) | -231.6926 | -231.6925 | -231.6891 | -231.6910 |
| Point Group | C2 | Ci | C2h | C1 |
| DOI | DOI:10042/to-13796 | DOI:10042/to-13797 | DOI:10042/to-13798 | DOI:10042/to-13799 |
From looking at the table above, it can be seen that Gauche 3, Anti-1 and Anti-2 conformers are lower in energy compared to the other conformers. Such factors that influence this include σ/σ* interactions, Pauli (bond-bond) repulsion and Hydrogen atom interactions[3]. These factors will be discussed in more detail later on in this section (see below).
Frequency Analysis of Anti 2 Conformer
 |
|
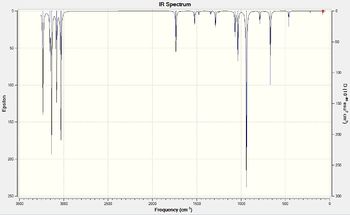
The 1,5-hexadiene was optimised ('frequency and optimisation calculation) using the HF method/3-21g basis set. By looking at the frequencies obtained for this optimisation, the absence of imaginary frequencies (i.e. only positive frequencies can be seen) confirms that an energy minimum has been achieved.
Comparison of Geometrical Properties between different Methods/Basis sets
| HF/3-21G | B3LYP/6-31G(d) | Lit value [4] | |
| Energy/ Hartrees | -231.6925 | -234.6117 | - |
| C1=C2 (Å) | 1.316 | 1.334 | 1.341 |
| C2-C3(Å) | 1.509 | 1.504 | 1.507 |
| C3-C4 (Å) | 1.553 | 1.548 | 1.537 |
| C-H Average Length (Å) | 1.079 | 1.096 | 1.099 |
| C1=C2-C3 (°) | 124.8 | 125.3 | 122.5 |
| H-C1=C2 (°) | 121.8 | 121.7 | 120.4 |
| H-C2-C3 (°) | 115.5 | 115.7 | 118.4 |
| H-C3-H (°) | 107.7 | 106.7 | 107.1 |
| C2-C3-C4 (°) | 111.4 | 112.7 | 111.0 |
From looking at the data above, it can be seen that the values obtained from the DFT method (using the 6-31g(d) basis set) and the HF method (using the 3-21g basis set) produce values that are very similar to each other. However, upon comparison to literature data, you see that the DFT method gives slightly more accurate results to that from the HF method.
Discussion
From analysing the data, it can be seen that the lowest energy conformer does not arise from an antiperiplanar conformer but instead, it arises from a Gauche conformer (in this case: Gauche 3 ~ -231.6927 a.u). Furthermore, not only can the unusual stability of Gauche 3 conformer can be attributed to the highly stabilising Van der Waal interactions that occur between H-H bonds, it can be explained in terms of π-orbital interactions. Although the σ(C-H)/σ*(C-H) interaction in the antiperiplanar conformers causes them to have a lower total energy than most of the Gauche conformers, in the case of Gauche 3 there is sufficient π-orbital interactions ( i.e. interaction between both sets of π double bonds – this is illustrated below - see table 7) resulting in the stabilisation of this particular conformer. This can be seen by the red lobes (from both alkene bonds) joining together in the HOMO.
 |
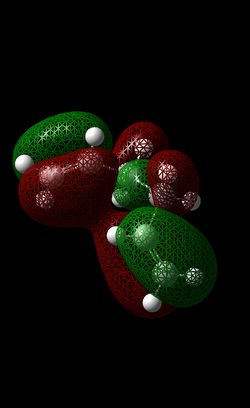 |
This interaction is absent in the anti-conformers as both double bonds are orientated as far apart from each other. The stabilisation of the anti-conformer can also be attributed to the π interaction between the vinyl proton[5] and the alkene moiety (this can be seen in the molecular orbital shown below).
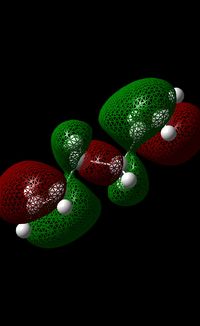
As a result, it may be concluded that the π-orbital interactions may have a slightly stronger stabilising effect than the σ(C-H)/σ*
(C-H) interactions. It must be noted the Anti-1 and Anti-2 conformers are both very low in energy i.e. the energy difference between these conformers and Gauche 3 is very minimal – almost negligible. One reason why the Anti-1 and Anti-2 conformers are this low in energy could be because they too experiences some alkene (through-space) interaction, albeit, to a smaller extent compared to that occurring in the Gauche 3 conformer.
As discussed before, the Anti-2 conformer was re-optimised using a slightly more accurate basis set (6-31g basis set/DFT- B3LYP method). This increase in accuracy is only partly due to the fact that this basis set takes into account electron correlation i.e. a large amount of correlation energy lost is recovered, hence, errors present in the HF method is reduced significantly [6]. As such, the energy value obtained from calculations using either basis set cannot be compared together. Instead, using literature geometry values (i.e. bond lengths and bond angles), one can assess the extent of accuracy of both basis sets used. Although both basis sets produce a set of data that is in agreement with the corresponding literature values (see below for the data), it can be seen that the results obtained from the calculation using the 6-31g basis set yields results that are slightly closer to the literature values.
Due to the absence of imaginary frequencies, it can be confirmed that during the optimisation of the Anti-2 conformer (using both the HF method/3-21g basis set and the 6-31g basis set/DFT- B3LYP method), an energy minimum was found in both cases.
Thermochemical Analysis
- At 298K
Sum of electronic and zero-point Energies=           -234.46921
Sum of electronic and thermal Energies=              -234.46186
Sum of electronic and thermal Enthalpies=            -234.46091
Sum of electronic and thermal Free Energies=         -234.50082
- At 0.0001K
Sum of electronic and zero-point Energies=           -234.46881
Sum of electronic and thermal Energies=              -234.46881
Sum of electronic and thermal Enthalpies=            -234.46881
Sum of electronic and thermal Free Energies=         -234.46881
After obtaining the electronic, zero-point and thermal energies (at 298K), a new input file was created as demonstrated on the Module 3 instruction page. After setting the temperature to 0.0001K (0K is impossible to attain therefore this causes problems for the Gaussian program), the calculations were run and the results are tabulated below. The value obtained for each ‘sum of energy terms’ at 0K was -234.4688 Hartrees. The first term provides us with information regarding the zero-point (vibrational) energy – this term does not fluctuate much between 0K and 298K. Intrinsically, a much higher temperature is needed in order for this term to change greatly. The second term couples the vibrational, rotational and translational terms together but excludes the electronic partition function. The third term takes into account the enthalpic contribution with respect to RT. Last of all, the fourth term illustrates the entropic and enthalpic contribution; hence, it shows us the Gibbs free energy. The only term that fluctuates to a large extent as temperature increases from 0K to 298K is the fourth term (Gibbs free energy term) which demonstrates the large temperature dependence of this term (in comparison to the other three terms that do not deviate much upon such a large change in temperature).
Transition state
Optimisation of allyl fragment
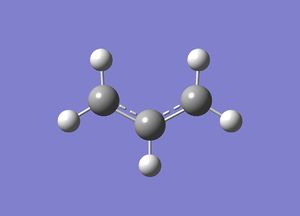
In this section of the Module, the transition states of the Cope Rearrangement (see below) will be analysed. An allyl fragment was drawn on Gaussian and soon after, the fragment was optimised using the HF method and 3-21g basis set (see below for the summary of this optimisation):
Optimisation of chair structure
*TS(Berny) Method
 |
 |
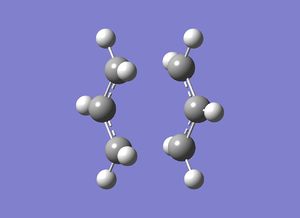
For this optimisation, two allyl fragments were pasted onto the same slide in Gaussian. In addition to this, both fragments were carefully aligned. After this ‘guess-structure’ was prepared, the TS-Berny method was used in the first attempt to optimise the fragments (Opt=NoEigen was added into the ‘additional keywords’ section – in the case of multiple imaginary frequencies popping up, this enables the calculation to continue running) using HF method/3-21G basis set. This involved computing the force constant matrix; the objective of this calculation is to attain a force constant of zero. This optimisation results in an energy minimum to be achieved. Going back to the guess-structure, if this guess is very inaccurate, it will lead to the TS-Berny method becoming unsuccessful.
Following the optimisation and frequency calculation, an imaginary frequency of -818cm-1 was obtained; this vibrational mode adequately illustrates the Cope rearrangement i.e. it shows the concerted (sigma) bond breaking/formation in this rearrangement.
*Frozen Method
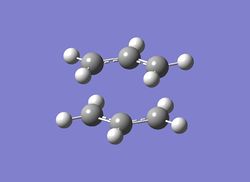 |
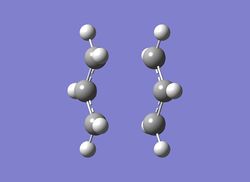 |
 |
The second method involved changing the orientation of the allyl fragments (with respect to each other), whereby the corresponding terminal carbons of both fragments had a bond distance of 2.2Å (this was achieved using Redundant Coordinate Editor). A frequency and optimisation calculation was undergone (Opt=ModRedundant was used) using the same basis set and method as in the first method (HF method/3-21G basis set). In this method, the force constant was calculated once. Yet again, an imaginary frequency of 818cm-1 was obtained. The force constants for this particular vibrational mode are due to the negative second derivative (of the PES). This causes a maximum to occur along this surface, thus indicating the presence of a transition state (this is also the same for the imaginary frequency obtained in the first method).
As both methods yielded the same imaginary frequency and gave nearly-identical total energy (and geometry) of the transition state, it is reasonable to say that either method can be used (i.e. neither method is clearly better than the other). One observation that needs to be noted down is that the bond length between the corresponding terminal carbon atom of both fragments is now 2.02Å as opposed to the value of 2.2Å set at the start of the calculation.
In order to see comparisons between geometry and energies obtained from the different methods, please refer to the 'Discussions' section below.
Optimisation of Boat structure
*QST2 Method
In order to try and obtain the Boat transition state, the QST2 Method was used (using HF method/3-21g(d) basis set). By following the instructions page, the reactant molecule and the product molecule were made and then placed together in the same window. By using the QST2 method, it would allow for the program to interpolate between the reactant and product molecule; this will eventually lead to the transition state. However, doing a frequency and optimisation calculation proved unsuccessful in this case (see below for the failed transition state structure). On first inspection, the molecule closely resembled the chair transition state structure. After looking at the summary of this optimisation, it could be seen that the RMS gradient plot showed that the plot did not attain a gradient of zero, confirming that the optimisation was unsuccessful. Upon changing the angles of the central carbon atoms (C2-C3-C4 and C3-C4-C5 were manually changed to 100o while the C2-C3-C4-C5 dihedral angle was then set to 0o). After undergoing the same calculation, a boat transition state was achieved. In addition to this, an imaginary frequency was attained (-840cm-1), thus confirming that the transition state had been achieved. Once again, this is due to the negative second derivative of the potential energy surface. The presence of the maximum (saddle point) indicates the transition state.
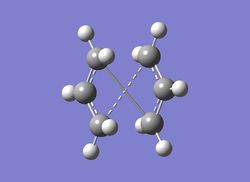 |
 |
 |
 |
In addition to the optimisation of the Chair and Boat structure using the HF method, more calculations were run using the DFT Method (using the 6-31g(d) basis set). For the chair structure, the TS Berny optimisation method was favoured over the Frozen method while for the Boat structure, the QST2 optimisation method was chosen. Results are displayed in the Discussion section.
IRC ANALYSIS
Intrinsic Reaction Coordinate (IRC)
The reaction mechanism of the formation of both the chair and the boat conformers can be deduced. In each of the cases below, two calculations were run, one where the force constant was calculated once and another where the force constant was calculated always. Once the optimised Transition State had been found and a subsequent IRC calculation was completed for this Transition State, it was possible to obtain an accurate structure for the product. While this method can be used to determine the dominant product of the Cope Rearrangement, it is not compulsory to run an IRC calculation for the Boat structure as the reactant and the product structure are known to us.
As you can see below for the chair structure, the IRC calculation with 'force constant only once' and another was run using 'force constant always' (both sets of calculations were run using n=50 steps and then n=100 steps). It should be noted that by allowing the force constant to be computed in at every step (force constant always) allows for more reliable results to be obtained.
Chair
- TS-Berny Optimisation Method (n=50)
 |
 |
 |
 |
In this section, two IRC calculation was undergone. This involved performing both calculations at n=50 steps, however, one calculation involved the force constant being computed once (at the beginning) while the other calculation involved the force constant to be computed at each stage. As you can see, no minimum was achieved using the 'force constant only once' option. The gradient of the RMS Gradient plot never flattens (or achieves a gradient of zero). However, in the other calculation, one can see that a zero gradient is achieved indicating that an optimised TS structure was successfully obtained using the HF method/33-21g basis set. From looking at the structure provided from this IRC calculation, it is evident that the product formed (via the chair TS) resembles the Gauche 2 conformer. This shows us that the Gauche 2 conformer and the chair TS will have a very similar structure.
- TS-Berny Optimisation Method (n=100)
 |
 |
 |
 |
In addition to the previous calculation, the IRC calculation was run again as before with the sole exception that the both experimental runs were undergone using n=100 steps. It can be seen that there is no difference in the RMS Gradient plots compared to the plots obtained previously as only a maximum of 27 steps occurs here.
The electronic energy of the Chair TS (-231.692 Hartrees)for all the chair IRC calculations are nearly-identical to the electronic energy of the Gauche 2 conformer.
Boat
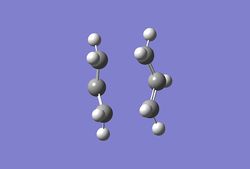
- QST2 Optimisation Method (HF/3-21g Theory used) n=50
 |
 |
 |
 |
After running an IRC using the same method stated above (with the force constant being computed only once) no minimum was observed on the RMS Gradient plot. Once again, it confirms that no TS structure was observed. A second calculation was run where the force constant was computed at every step, resulting in the RMS gradient plot obtaining a gradient of zero. It is evident that the product formed (via the Boat TS) resembles the Gauche 3 conformer (thus implying that the Boat TS too will resemble the Gauche 3 conformer). The electronic energy (Boat TS) of -231.693 Hartrees is almost identical to that of Gauche 3 (-231.693 Hartrees as well).
Geometry Analysis
| Chair Structure | Chair HF optimisation (3-21g) | Chair DFT optimisation (6-31g(d)) | Boat Structure | Boat HF optimisation (3-21g) | Boat DFT optimisation (6-31g(d)) |
| (c-c) Bond length (Å) | 1.38 | 1.40 | (c-c) Bond length (Å) | 1.38 | 1.41 |
| Chair Fragment separation distance (Å) | 2.14 | 2.21 | Chair Fragment separation distance (Å) | 2.02 | 1.98 |
| Chair C-C Angle(o) | 122.7 | 122.3 | Chair C-C Angle(o) | 120.4 | 119.9 |
| Chair C-C Dihedral Angle(o) | 64.8 | 64.2 | Chair C-C Angle(o) | 68.4 | 65.3 |
As you can see, the values from both methods (for the Chair structure: DOI:10042/to-13819 ) are concordant to each other. The biggest difference (although it is a relatively small difference) is the dihedral bond angles which has a difference of 0.4o. In the case of the Boat structure(DOI:10042/to-13820 ), the same situation occurs i.e. the results between both methods are nearly-identical to each other.
Thermochemical data
| HF/3-21G | B3LYP/6-31G(d) | |||||
|---|---|---|---|---|---|---|
| Electronic energy | Sum of zero-point and electronic energies | Sum of thermal and electronic energies | Electronic energy | Sum of zero-point and electronic energies | Sum of thermal and electronic energies | |
| 0 K | 298.15 K | 0 K | 298.15 K | |||
| Chair TS | -231.6193 | -231.4667 | -231.4613 | -234.5570 | -234.4149 | -234.4090 |
| Boat TS | -231.6028 | -231.4509 | -231.4453 | -234.5431 | -234.4023 | -234.3960 |
| Reactant (anti2) | -231.6925 | -231.5396 | -231.5326 | -234.6117 | -234.4692 | -234.4619 |
NB: 1 hartree = 627.51 kcal/mol
| HF/3-21G | HF/3-21G | B3LYP/6-31G* | B3LYP/6-31G* | Expt. | |
| 0 K | 298.15 K | 0 K | 298.15 K | 0 K | |
| ΔE (Chair) | 45.70 | 44.69 | 34.06 | 33.17 | 33.5 ± 0.5 |
| ΔE (Boat) | 55.60 | 54.76 | 41.97 | 41.31 | 44.7 ± 2.0 |
Using the output file of the Frequency and Optimisation calculation of the transition-state, the activation energy for the Cope Rearrangement can be obtained for the transition states. In addition to this, the structures were optimised (Frequency and Optimisation) using the DFT/B3LYP method and the 6-31g (d) basis set. After results of both calculations were tabulated, the activation energy of the boat and chair structures was compared to see which structure was more stable. Once again, it must be noted that for the optimisation of the chair TS structure and the boat TS structure, TS-Berny method and the QST2 method were used respectively. Furthermore, the activation energies of these structures were also compared to the already-optimised anti-2 conformer. In both calculations, the Chair TS structure is ~-10kcal/mol (difference in zero-point energy) more stable than the Boat TS structure (this difference in Activation energy allows the formation of chair T structure to dominate). As such, it is reasonable to assume that the 6-membered Transition state of the Cope Rearrangement exists in the Chair conformation. In addition to this, the Anti-2 reactant (that was used to form the Boat conformer after heavy modification) is much lower in energy (~50kcal/mol) compared to either the Boat or Chair conformer. When comparing the Anti-2 reactant to the Boat TS structure, we see an increase in energy (which is common for a transition state structure). This is because the reactant molecule must overcome repulsive interaction between various atoms as they come closer together. Furthermore, more energy is needed to separate atoms once the initial [1, 1] C –C bond is broken. This results in the potential energy curve to increase when moving from the reactant to the Transition state structure.
Diels-Alder
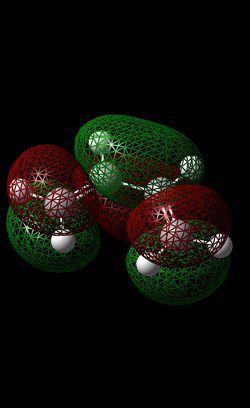
Diels Alder introduction In this section of the module, we will be focussing on two different Diels-Alder reactions. Firstly, a brief introduction should be made regarding this type of reaction. Generally, a diene and a dienophile are reacted together to form a (substituted) cyclohexene molecule. This reaction is constituted as a pericyclic reaction[7] where bonds are simultaneously formed (in this case, two sigma bonds and one Pi bond is formed). In this reaction, there are two possible transition states that can form in this reaction; the endo (kinetically favoured) and the exo (thermodynamically favoured) transition state. The lower energy of the endo-TS (compared to that of the exo TS) is due to secondary orbital overlap due to the correct alignment (p-orbital) of the HOMO and LUMO of the diene and dienophile respectively. This interaction will be shown (by MO analysis) later on in this section.
| LUMO |  |
 |
| HOMO |  |
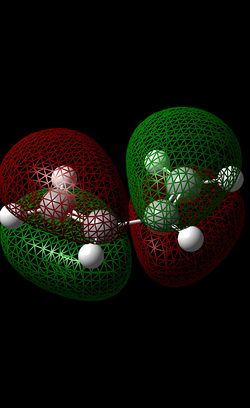 |
In this reaction, the ethene is the dienophille while the butadiene is the dienophile. The cyclo-addition of these two reactants forms a cyclohexene product. In order to obtain the MO’s for the reactants, each reactant was optimised (‘pop=full’ was inputted into the additional keywords section) using the AM1 method (semi-empirical method) – this is shown by the RMS Gradient plot reaching a gradient of zero, suggesting a minimum on the potential energy surface was attained. From looking at the HOMO AND LUMO of both reactant molecules, it is evident that there is some symmetry present. In terms of the ethene, the LUMO displays symmetry on the σv (i.e plane of the planar ethene) but there is no symmetry displayed in the HOMO of Ethene. In terms of Butadiene, the HOMO exhibits symmetry (σv) while the LUMO orbital is asymmetric.
Transition state of the Ethene/Butadiene cycloaddition reaction
As stated in the script, the optimised structures of cis-butadiene and ethane were modified, whereby the ‘frozen coordinates’ option was chosen to allow the distance between both reactants to be 2.2Å. The molecules were then optimised using the TS-Berny method in order to obtain the optimised transition-state structure for the cyclo-addition reaction. In order to maximise the Pi interaction between the ethene and the cis-butadiene, an envelope-structured transition state is formed. Upon the completion of the ‘optimisation and frequency’ calculation, the output file was opened and the vibrational modes were analysed to confirm whether the correct transition-state structure was achieved. The imaginary peak present at -956cm-1 indicates that the calculation yielded a transition state. In order to provide a comparison (of various properties of the optimised TS structure) between different methods and basis sets, this process was repeated again using the TS-Berny optimisation method (frozen coordinates) using the DFT-B3LYP method/6-31g basis set. Again, there was an imaginary frequency present at 956cm-1 which confirmed the generation of a Transition state. See below for the animation of the imaginary frequency and the lowest real frequency (of the DFT method - as all methods generated the same corresponding frequencies, only the DFT set are shown).
 |
 |
After optimisation using the AM1 Method (described earlier), the MO's of the Transition state was analysed. In terms of electron density distribution, it is evident that there is no degree of symmetry imparted (on the σv plane) in the HOMO of the Transition state. This occurs as Cis-butadiene's HOMO and the LUMO of ethene overlap with each other (it should be noted that before overlap, these two orbitals displayed no symmetry on the σv plane). In contrast, it is clear that there is symmetry present in the σv plane (on the σv plane) of the LUMO. This arises as the HOMO of ethene and LUMO of cis-butadiene (both incidentally display symmetry about the σv plane) overlap, resulting in the formation of the symmetric LUMO orbital. Overall, this suggests that the nucleophile is indeed cis-butadiene while ethene as the electron acceptor (electrophile) i.e. electron density from the HOMO of butadiene is donated into the into ethene's low-lying π* LUMO.
| AM1 Method | DFT Method | Literature value (DFT)[8] | |
| Fragment seperation distance (Å) | 2.12 | 2.27 | 2.27 |
| Diene bond (c-c) (Å) | 1.37 | 1.39 | 1.39 |
| Ethene bond (c-c) (Å) | 1.38 | 1.38 | 1.38 |
| Lowest Real Frequency (cm-1) | 147 | 147 | - |
| Imaginary Frequency (cm-1) | -956 | -956 | - |
 |
 |
 |
The geometrical data obtained for each method (DFT and HF) are similar to each other. One thing to note down is that the DFT results are identical to that obtained from literature. Overall, the average C-C bond length obtained was 1.38 Å. This lies in between the ideal distance of a C=C bond (1.34Å)[10] or that of a single C-C bond (1.58Å), suggesting that the structure is in transition. This is also evident in the bond angles: Instead of obtaining ideal bond angle between 3 sp3 carbon atoms (109o ) or the ideal bond angle between two sp2 and a sp3 atom (120o), the bond angles obtained are directly in between these two values, again suggesting that the structure is in between that of the product or the reactants. Furthermore, the imaginary frequency obtained (at -956cm-1)confirms that a minimum was reacted in the optimisation and frequency calculation - i.e. a transition state was obtained.

||
In order to confirm the nature of the transition state, an IRC calculation was undergone. The previously optimised structure (DFT method - 6.31g(d)) was opened in Gaussian and the IRC optimisation method was choosen. A minimum can be seen and furthermore, the RMS gradient obtained is near-zero.
Regioselective Diels Alder Reaction between Maleic Anhydride and Cis-Butadiene
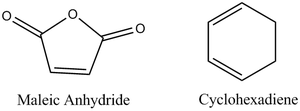
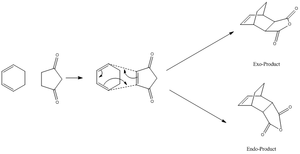
Previously, we have looked at the basic concept of a Diels Alder reaction; this was illustrated using the two simple molecules: cis-butadiene (nucleophile) and ethene (electrophile). We shall now see an example of a Diels-Alder reaction that exhibits regioselectivity. Such a reaction includes the [4+2] cycloaddition of maleic ahydride with cyclohexa-1,3-diene, affording two different products - an endo-product and an Exo product. It is known that the endo-product is the thermodynamic product[11] in this reaction as it is of lower energy than the exo product. The objective of this exercise is to confirm this finding using computational methods and, in particular, analyse and comment on the secondary orbital interactions present in either molecule. In this exercise, the DFT (B3LYP/6-31g method) will be used to obtain an optimised TS structure for the Endo- and the Exo-Transition state. The use of AM1 method will not be used as the accuracy of the DFT model is higher than that of the AM1 method (as justified in the earlier Diels-Alder reaction - see above). Furthermore, in order for this method to work effectively, one has to provide the program with a fairly accurate guess structure i.e. a lot of computational time (and cost) to obtain such an accurate structure. Due to time-constraints, the DFT method (6-31g(d) basis set) will be used for such calculations.
The reaction scheme of this cycloaddition reaction is shown below:
 |
 |
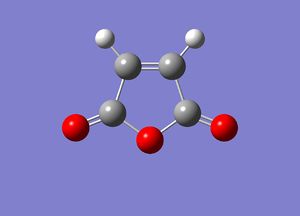
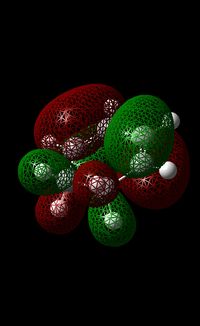
As mentioned previously, the DFT method (using B3LYP method/6-31G(d) basis set) was used due to the greater accuracy of the calculation compared to one undertaken using the AM1 mention (due to the consideration of electron correlation). Furthermore, the use of this calculation was further justified by the fact that by using the AM1 Method, the guess structure would have to be modified continuously until a suitable structure is obtained. The HOMO and LUMO of maleic anhydride and cyclohexa-1,3-diene can be seen in the table below.
 |
 |
| LUMO | 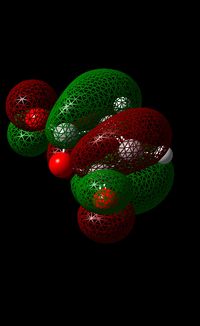 |
 |
| HOMO | 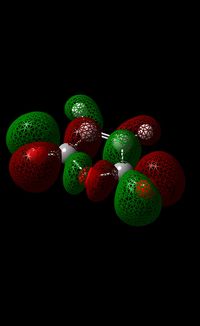 |
 |
In the case of maleic anhydride, the HOMO is symmetrical and in addition to this, it also confirms that the bonding nature of the orbitals present around the 5-membered ring.
Looking at the LUMO, it can be seen that this orbital has an anti-bonding nature which contrasts that of the HOMO. The orbital is anti-symmetric and by looking at the image of the LUMO (see below), one can see that the carbon atoms that are part of the alkene bond have a node present in between them , illustrating some anti-bonding nature. This is also seen with the carbonyl bonds.
In the case of cyclohexa-1,3-diene, the LUMO of the molecule clearly shows symmetry. However, there is strong anti-bonding character in this orbital. This is shown by the many nodes present in the molecule. For each alkene bond, the Carbon atoms of each alkene have a different coloured node, showing such anti-bonding character. For each singly bonded C-C bond, they overlap thus forming bonding interactions. Overall, the anti-bonding character seems to outweigh the bonding character.
In the HOMO of cyclohexa-1,3-diene, there is a lack of symmetry present in this orbital. The single C-C bond (where both Carbon atoms are sp3 hybridised) and the C-C bond located directly opposite of this bond exhibit bonding interactions. Apart from these two interactions, the rest of the interactions in this molecule seem to be anti-bonding. In comparison to the LUMO, the anti-bonding character in this orbital also looks to be outweighing the bonding character.
It should come to know surprise that the HOMO-LUMO gap is quite high (compared to the cyclohexan-1,3-diene). A simple explanation could be that the oxygen atoms present in the molecule may cause this; the electronegativity of Oxygen causes the LUMO to be very low-lying meaning that electron density can move into this orbital much more easily from the HOMO of the diene. As such, the maleic anhydride acts as the electrophile while the cyclohexa-1,3-diene is the nucleophile in this cycloaddition reaction. The large amount of stabilisation that arises (results in large splitting) is due to the very similar energies of the HOMO (of the cyclohexa-1,3-diene) and the LUMO of the maleic anhydride, making this orbital overlap (and electron density movement) very favourable.
Vibrational Frequency Analysis
After the individual optimisation of the reactants using the DFT method (see above), the reactants were then placed in the same window (in Gaussian) then orientated in a specific manner (depending on the exo- or endo-product). After this was achieved, further optimisation of the reactants using the TS-Berny method was undergone in order to obtain the optimised structures (endo or exo) of the Transition state.
| Endo TS (DFT Method) | Exo TS (DFT Method) | |
| Lowest Real Frequency | 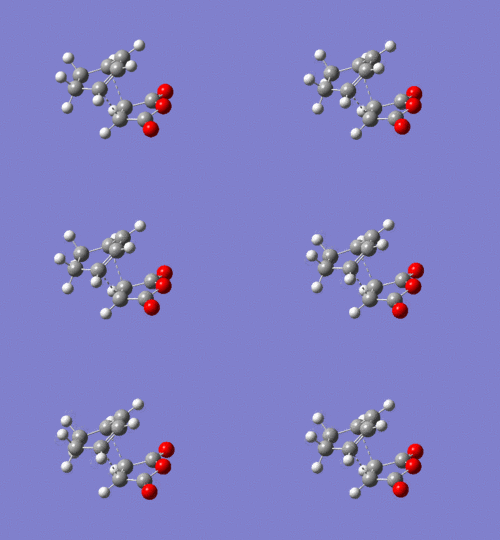 |
 |
| Imaginary Frequency |  |
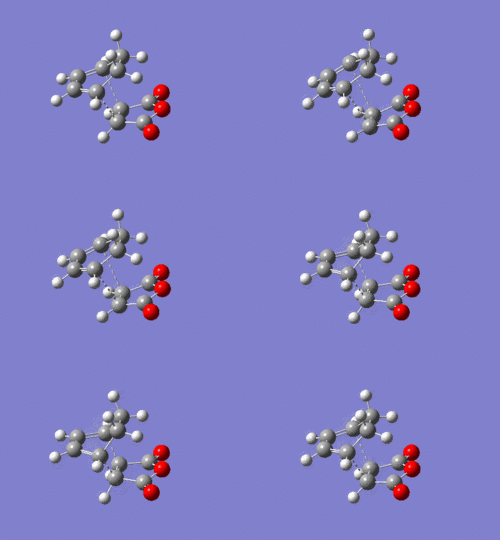 |
After re-optimisation of the reactants using the TS-Berny Method ('Optimisation and Frequency' calculation), the vibrational modes were analysed to see whether an imaginary frequency was attained. An imaginary frequency of -448cm -1 was obtained for the exo TS while an imaginary frequency of -447cm-1 was obtained for the endo TS (stretches are shown above), thus proving that the optimised structures obtained are in fact transition states of this reaction.
Geometrical and Total Energy Analysis
| Endo TS (DFT Method) | Exo TS (DFT Method) | |
| Fragment separation distance (Å) | 2.29 | 2.27 |
| (Former) Diene bond (c-c) (Å) | 1.40 | 1.40 |
| (Former) Ethene bond (c-c) (Å) | 1.39 | 1.39 |
| C-C Length (Å) | 1.48 | 1.48 |
| Lowest Real Frequency (cm-1) | 60 | 53 |
| Imaginary Frequency (cm-1) | -447 | -448 |
The values obtained for each Transition state pretty much mirror their counterpart. This means the most important piece of information that defines the energy levels of the exo and endo transition state is the position of the -(C=O)-O-(C=O)- fragment with respect to the rest of the molecule. In the exo TS, the through space interaction distance between the -(C=O)-O-(C=O)- fragment and the -CH2-CH2- bridge of the cyclohexadiene is slightly longer (0.1Å) than the endo TS; one would think that the lower amount of steric repulsion in the exo TS would favour the formation of this entity (vDw distance is 3.2Å so steric repulsion does indeed occur). However, the secondary orbital interactions formed between the -(C=O)-O-(C=O)- fragment and the cyclohexadiene molecule (lower through-space distance between both entities followed by the right orientation of these groups) overrides the initial steric repulsion factor; hence, the endo structure is favoured.
| Endo TS (DFT Method) | Exo TS (DFT Method) | |
| Electronic Energy (Hartrees) | -612.6834 | -612.6793 |
From the energies listed above, it shows that the Endo TS is lower in energy than the Exo TS by 0.0041 Hartrees i.e. 2.57kcalMol-1. Due to the lower energy of the Endo TS (lower activation energy barrier), it shows that the Endo Product is the Kinetic Product of this regioselective Diels Alder reaction.
MO
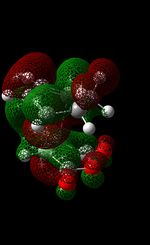
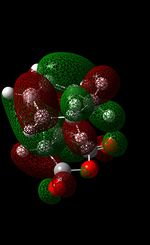
The MO's of both Transition States will be analysed in order to determine why one product dominates over the other for this reaction. In this case, endo-product formation dominates.
| Molecular Orbitals | Endo TS | Exo TS
|
|---|---|---|
| LUMO+1 | 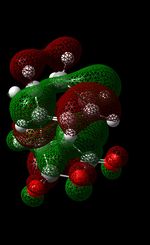 |
|
| LUMO | 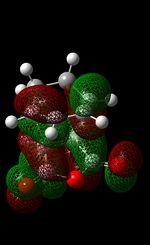 |

|
| HOMO | 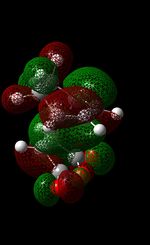 |
|
| HOMO-1 | 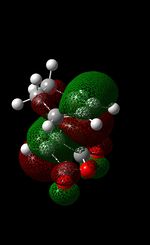 |
|
EXO TS
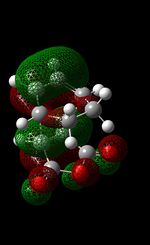
In the case of the Exo Transition State, the orbital overlap between the HOMO of the cyclohexa-1,3-diene (asymmetric MO) and the LUMO of the maleic anhydride (asymmetric MO) results in the formation of the asymmetric HOMO of the exo-TS. In addition to this, it is also evident that the LUMO of the exo-TS is asymmetrical. From looking at the table above, you can see that there are nodes all around the 5-membered ring. This is indicated by nearly all the nodes being out-of-phase with each other, which indicates the anti-bonding character of this orbital (as the low lying LUMO orbital allows for electron density to be donated easily into this orbital). The other orbital that should be reviewed here (for comparison purposes) is the HOMO - 1 orbital. This orbital displays a large degree of symmetry and furthermore, in sharp contrast to the HOMO, this orbital is formed from the overlap of the HOMO of maleic anhydride and the LUMO of cyclohexa-1,3-diene.
ENDO TS
The formation of the HOMO and LUMO for the endo-product is the same as that of the exo-product (see above) therefore discussion here will be minimum. All that needs to be noted is that both the HOMO and LUMO are asymmetrical. On looking at the HOMO -1 orbital (symmetrical orbital which is generated by the overlap of maleic anhydride's HOMO and the LUMO of the diene), there are in-phase interactions between the alkene bond and the carbonyl bond - this is evident in terms of the red lobes (from each bond) that are very close to each other. This may be evidence of the secondary orbital effect; this effect explains why the endo TS (lower energy) is favoured over the exo-TS(higher energy). Due the specific alignment of the p orbitals on the diene with the p-orbitals on the maleic hydrous in endo-formation, it allows for the non-bonding (frontier) orbitals to interact with each other, thus lowering the energy of the TS. Even though there is greater steric clashing in the endo TS (as groups are being pushed closer together) compared to the exo-TS, it is believed that the secondary orbital overlap effect dominates steric factors. This ultimately leads to the endo-TS to be slightly more stable. This secondary orbital overlap is not seen in the exo-TS.
Conclusion
In this module, computational chemistry has been used to calculate and illustrate the structure of Transition States in various reactions, a feat that is extremely hard to achieve in 'wet experiments' due to the rapid formation/decomposition of such structures. In addition to determining such structures, we have also used Gaussian to predict the major and minor product when a reaction is faced with regioslectivity. Once again, Gaussian shows us why it has become an important tool for chemists in the present age and why it will become even more relied upon in the days ahead.
references
- ↑ The Cope Rearrangement. MINDO/3 Studies of the Rearrangements of 1,5-Hexadiene and Bicyclo[2.2.0]hexane. M. J. S. Dewar, G. P. Ford, M. L. McKee, H. S. Rzepa and L. E. Wade, J. Am. Chem. Soc. , 1977, 99 , 5069-5073.
- ↑ Foresman,J; Frish, E; Exploring Chemistry With Electronic Structure Methods, Second Edition
- ↑ Henry Rzepa, 2nd Year Module, Conformational Analysis
- ↑ G. Schultz, J. Mol. Struct, 1995, 346,60-69
- ↑ Gung, W; Zhu, Z; J. Am. Chem. Soc.,1995, 117
- ↑ Basis Sets and Performance (Lecture 3), Andrew S. Ichimura, California Institute of Technology, Pasadena, CA, January 5-16, 2004
- ↑ Henry Rzepa, 2nd Year Module, Pericyclic Reactions
- ↑ Goldstein,E; Beno,B; J. Am. Chem. Soc., 1996, 118
- ↑ Goldstein,E; Beno,B; J. Am. Chem. Soc., 1996, 118
- ↑ http://www.science.uwaterloo.ca/~cchieh/cact/c120/bondel.html
- ↑ Clayden, Greeves, Warren and Wothers,Organic Chemistry, Oxford Press 2001
