Rep:Mod:AS12713MGO
Introduction
This experiment involves using a simple model of atomic interactions to calculate the energy and vibrations of a crystal of magnesium oxide (MgO). These vibrational energy levels will then be used to compute the free energy of the crystal and to predict how the material expands when heated via the harmonic and quasi-harmonic approximations. In the final stage of the experiment the crystal will be expanded using a technique called molecular dynamics. In all cases the thermal expansion coefficient will be calculated and the results compared.
Thermal expansion is the tendency of matter to change in shape, area and volume in relation to a change in temperature, via heat transfer. This occurs due to the increase in potential energy as the temperature increases, therefore resulting in a greater average separation between the molecules. The thermal expansion coefficient of a material is the degree of expansion divided by the change in temperature at constant pressure.
The thermal expansion of the MgO lattice was observed using the quasi-harmonic approximation and using molecular dynamics. The quasi-harmonic approximation is a phonon-based model used to describe volume-depended thermal effects. This is due to the quasi-harmonic approximation being an extension from the harmonic approximation but which contain an additional anharmonic factor. The harmonic phonon model states that all interatomic forces are purely harmonic, but this type of model cannot account for thermal expansion since the equilibrium distance between the atoms is independent of temperature. Therefore, in the quasi-harmonic approximation the intermolecular distance changes with temperature and this change is represented by thermal expansion. Also, this model is based on phonons which are lattice vibrations that's have particle-like properties. In this model, these particle-like vibrations occur in 1D, where the vibrational amplitude of a molecule is proportional to the energy. [1] The free energy is computed as a sum over the vibrational modes of the infinite crystal (i.e. over all the bands and k-labels).
Molecular dynamics is a technique for allowing a system to evolve in time according to Newton's Second Law (F = ma, where F is the force, m is the mass and a is the acceleration). [2] The atoms and molecules are allowed to interact for a fixed period of time and the trajectories are determined by numerically solving Newton's Laws of motion for a system of interacting particles. Numerical methods bypasses the problem of it being impossible to determine the properties of complex systems containing many particles analytically. The ergodic hypothesis states that all accessible microstates are equally probable over a long period of time. Therefore, systems that follow this hypothesis can be used to determine the macroscopic thermodynamic properties of the system in which the time averages correspond to ensemble averages. Thus, this model computes the trajectories for the atoms and outputs time averages.
The software used in this experiment is RedHat Linux, DLVisualize (DLV) and General Utility Lattice Program (GULP). RedHat Linux is an operating system which provides an excellent environment for numerical solutions, such as those used in this experiment. GULP is a program used for performing a variety of types of simulation on materials using various boundary conditions, for example 0D, 1D, 2D or 3D. The focus of this code is to provide analytical solutions through lattice and molecular dynamics, enabling the alteration of properties such as lattice constants. DLV is a general purpose graphical user interface used for the modelling and studying of various crystal structures under changing environments, which in this experiment involves temperature.
Calculating the Internal Energy of an MgO Crystal

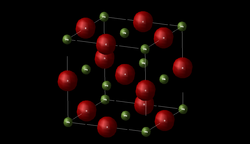
Magnesium oxide consists of a lattice of Mg2+ ions and O2- ions held together by ionic bonding. In order to describe a crystal structure it is necessary to specify a box called the unit cell which is repeated in order to create the periodic lattice. The crystal structure of MgO can be described using a primitive unit cell, as shown by Figure 1. This primitive unit cell contains two atoms. The cell vectors of this cell is shown below in Table 1. The LogFile for this can be found here
| 0.00000 | 2.10597 | 2.10597 |
|---|---|---|
| 2.10597 | 0.00000 | 2.10597 |
| 2.10597 | 2.10597 | 0.00000 |
The LogFile shows that the primitive unit cell of MgO is a rhombohedron of side 2.9783 Å (a=b=c) and internal angle of 60 degrees (α=β=γ). The same lattice can also be described by a crystallographic (conventional) cell, as shown by Figure 2, which is a cube (face centred cubic) with a lattice constant of 4.212 Å (a=b=c) and internal angle of 90 degrees (α=β=γ). This correlates very well with literature results which suggests that the lattice constant is 4.211 Å. [3] This conventional cell contains 8 atoms (4 Mg atoms and 4 O atoms). The primitive cell of MgO is the smallest cell that can be used to generate the crystal whereas the conventional cell has 4 times the volume but is a cube and better reflects the true symmetry of MgO, thus most crystallographic studies refer to the conventional cell. The LogFile also reports the total energy due to the inter-atomic forces, taking into account both short range repulsions and electrostatic interactions, by summing over the infinite lattice. The total lattice energy per primitive unit cell at 0K is -41.07531759 eV. This represents the binding energy of the crystal which is the energy required to pull all of the ions of the crystal to infinite separation.
Calculating the Phonon Modes of MgO
The phonon (vibrational) modes of MgO were computed and represented by dispersion curves and by the density of states (DOS).
Computing the Phonon Dispersion Curves
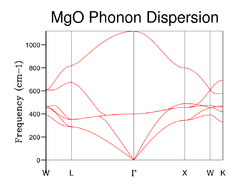
The phonon dispersion curve of MgO is shown by Figure 3, in which the phonons are computed at 50 points along the conventional path in k-space. There are an infinite number of vibrations within an infinite lattice structure and every possible vibration of the crystal can be labelled with a k-vector which is related to the direction and wavelength of the vibration. The special points along the conventional path in k-space are represented by the letters W, L, G, W, X , K which reflect the symmetry. The total number of vibrations can be calculated by summing over k, which is done by using GULP to give the phonon graph in this computation.
The graph in Figure 3 shows that the vibrational frequency (phonon modes) change with different k values. From the graph, it can be observed that there are 6 different phonon modes with each axis (x, y and z) representing 2 phonons in the simulation. These two phonons arise from the fact that the primitive unit cell of MgO contains two atoms. Each axis has two different types of phonons corresponding to an optical and acoustic branch which represent both in-phase and out-of-phase lattice vibrations. Therefore, in this case the acoustic branch represents a phonon pair moving in the same direction (in-phase vibration) while an optical branch represents a phonon pair moving in different directions (out-of-phase vibration). These two branches form in a dispersion curve as a result of the various vibrational modes present.
The Phonon Density of States
The density of states summarises the dispersion curves and is an average over all k-points yielding the number of vibrational modes at each frequency (the density of modes). Summing over all of the states, as labelled by their k-point, at a particular frequency produces the phonon density of states energy level diagram as shown below.
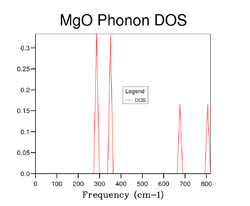
A phonon density of states (DOS) diagram of MgO using a 1x1x1 grid is shown in Figure 4. This DOS diagram uses data from the phonon dispersion curve shown in Figure 3, and in this particular case is can be seen that there are 4 distinct peaks which represents k-point L (at this point k = 1/2, 1/2, 1/2). However, in looking at Figure 3, it would be expected that the DOS diagram shown in Figure 4 would have 6 peaks. Instead, only 4 peaks are observed because the bands become degenerate at 288 cm-1 and 352 cm-1. Therefore, the relative intensities at cm-1 and 352 cm-1 are double those that are found at 676 cm-1 and 819 cm-1. Hence the peaks appear in a approximate 2:2:1:1 ratio reflecting k-point L.
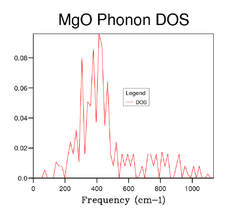
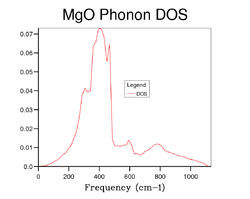
As the grid size increases the DOS diagram becomes more complex because a larger number of peaks are produced resulting from the increases in sample point in k-space. In other words, as the grid size increases more and more of the possible vibrations are sampled and more feature appear. Figures 5, 6 7 and 8 shows the effect of computing the DOS at larger grid sizes. From these figures, it can be deduced that optimal grid size is the 15x15x15 grid which gives the best result in terms of accuracy and CPU time (there is an increase in CPU time as the grid size increases). Any grid size smaller than 15x15x15 has areas on the DOS diagram where the curve cuts the x-axis because the number of k-points sampled in reciprocal space is insufficient. However, above this grid size the smoothness of the DOS diagram increases due to the further increase in sample points. It can also be observed that as the grid size becomes progressively larger, the DOS plot starts to resemble a smooth continuum of frequencies rather than a set of discrete vibrational modes. Furthermore, from Figure 7 and Figure 8 it can be seen that there is little difference between the DOS diagrams which in turn suggests that the number of k-points sampled is sufficient for the computation.
The phonon DOS and phonon dispersion curve can be related through the number of k-points in a given change of frequency and in a given change of k in the phonon dispersion diagram. The phonon DOS is inversely proportional to the gradient of the phonon dispersion curve. Therefore, the frequency peaks in the phonon DOS correspond to the regions of the phonon dispersion curve where the bands have a gradient of zero (i.e. flat). Thus, from this the greatest number of states is found within the flattest regions of the phonon dispersion curve.[4]
Computing the Free Energy using the Quasi-Harmonic Approximation
| Grid Size | Helmholtz Free Energy / eV | Accuracy |
| 1x1x1 | -40.93030 | 0.1 eV |
| 2x2x2 | -40.92661 | 0.1 eV |
| 3x3x3 | -40.92643 | 1 meV |
| 4x4x4 | -40.92645 | 0.5 meV |
| 8x8x8 | -40.92648 | 0.5 meV |
| 16x16x16 | -40.92648 | 0.1 meV |
| 32x32x32 | -40.92648 | N/A |
The free energy was computed by using the quasi-harmonic approximation as a sum over the vibrational modes of the infinite crystal (i.e. over all bands and k-labels). The results of this computation are shown in Table 2. The main relationship is that as the grid size increases the degree of accuracy increases, which is the same relationship observed for the phonon DOS diagrams shown above. However, a larger grid size increases the CPU time due to the greater number of sampling points involved in the computation. From Table 2 another relationship can also be seen which is that as the grid size increases the free energy, in general, decreases ever so slightly. This is because there is an increase in the number of microstates , which in turn results in a lower free energy as shown by the equations and (where S is the entropy, k is the Boltzmann constant, W is the number of microstates, A is the Helmholtz free energy, U is the internal energy and T is the temperature). Furthermore, the free energy for the 32x32x32 grid is -40.92648 eV which does not agree well with the literature value of 6.23 eV.[5] This is because the model used in this computation of the free energy has been over-simplified in terms of the anharmonic behaviour of the system, which becomes much more apparent at higher temperatures.
Optimal Grid Size for CaO, Faujasite and Lithium
Table 2 shows that the optimal grid size for MgO is 16x16x16 when taking into account both the accuracy and CPU time. This optimal grid size for MgO can be discussed in relation to other similar oxides, zeolites and metals. In comparing these structure it should be noted that larger unit cells in real space correspond to smaller cells in reciprocal space. Therefore, for a calculation on CaO the optimal grid size would be 16x16x16 due to the very similar crystal structures of CaO and MgO. This is explained well by literature in which CaO has a lattice constant of 4.800 Å [6] and MgO has a lattice constant of 4.211 Å. [3] However, Faujasite has a very large unit cell (smaller cell size in reciprocal space) with a larger lattice constant at around 24.5 Å. [7] Therefore, in this case a smaller grid size than MgO would be required in order to obtain a similar sampling in k-space and thus account for the large difference in lattice constants. On the other hand, metals such as lithium have a lattice constant of 3.51 Å [8] which is a smaller lattice constant than MgO. Thus, lithium has a larger cell size in reciprocal space and so a larger grid size than MgO would be required in order to obtain similar sampling in k-space. However, in contrast to the MgO structure (which contains a lattice of Mg2+ and O2- ions), lithium contains a lattice of Li+ ions held together by a sea of delocalised electrons. Therefore, in the lithium structure there are less Coulombic forces when compared to MgO. This coupled with the fact the Lithium is highly symmetrical means that less symmetry labels are needed and thus less k-points are required to achieve the computational results.
The Thermal Expansion of MgO
The structure of MgO was optimised with respect to the free energy at a number of different temperatures. The free energy was then computed within the quasi-harmonic approximation. Additionally, the thermal expansion of MgO was computed using molecular dynamics and the results compared with that from the quasi-harmonic approximation. In both cases, the coefficient of thermal expansion was calculated.
The coefficient of thermal expansion describes how the size an object changes with temperature. More specifically, it measures the fractional change in size per degree change in temperature at constant pressure. There are many types of defined coefficients, for example linear, area and volumetric. The type to use depends on the particular application and the dimensions required. In this case, the volumetric thermal expansion coefficient was used, the equation of which is shown below.
- where αV is the volumetric thermal expansion coefficient, V is the (initial) volume, ∂V is the partial derivative of volume, ∂T is the partial derivative of temperature (at constant pressure)
Therefore, from this it can be said that the higher the expansion coefficient the greater the thermal expansion. Additionally, since MgO is an isotropic solid one would expect that the volumetric thermal expansion coefficient is low, resulting from the strong ionic bonding present.
Quasi-Harmonic Approximation
 |

|
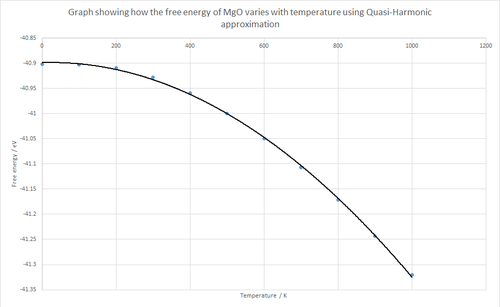
Figures 9 and 10 above show the effect of temperature on the free energy and lattice constant for MgO. As can be seen from the graphs, both curves are quadratic and smooth. The free energy quadratic has a negative coefficient while the lattice constant quadratic has a positive coefficient. The free energy quadratic is negative in accordance with the equation which suggests that the free energy is proportional to the negative of the temperature (when H and S are constant). In other words, the free energy decreases as the temperature increases. Additionally, the entropy term in the equation term is related to the temperature since a higher temperature results in a higher entropy and thus a larger gradient is seen at high temperatures, as supported by Figure 9.
In contrast, Figure 10 shows that the lattice constant increases as the temperature increases. This suggests that the cell dimensions of the primitive lattice increases with temperature. This behaviour of the system can be explained by the fact that at higher temperatures the amplitude of vibrations increases. This in turn results in an increase in the average distance between the atoms in the lattice and since the lattice constant is defined by the position of the atoms, it holds true that this parameter increases. Thus, thermal expansion is seen.
The volumetric thermal expansion coefficient for MgO was calculated using the quasi-harmonic approximation, as shown below in the calculations. Over the full range of temperature (0-1000K) a value of 2.25 x 10⁻⁵ K-1 was obtained and from 0-300K a value of 9.47 x 10⁻⁶ K-1 was obtained. The literature value of 10.4 x 10⁻⁶ K-1 [9]agrees with the 0-300K value obtained. From Figure 9 it can be seen that the plot is approximately linear from 0-300K but then becomes truncated as temperatures increase over 300K. In accordance with the Gibbs equation above, it can be observed that there should indeed be a linear relationship between the free energy and temperature. Thus, the volumetric thermal expansion value obtained at 0-300K agrees much better than at 0-1000K. This large difference in values between the two temperature ranges may be due to limitations with the GULP program because the model may be over-simplified in terms of the anharmonicity.
In this calculation, the main approximation is to do with the anharmonic contributions to the harmonic approximation. In this model, the phonon frequencies are volume dependent which is a simplified way to compute anharmonicity. This in turn means that at higher temperatures the anharmonic factor increases. Other approximations include the Born-Oppenheimer Approximation which assumes that the motion of atomic nuclei and electron in a molecule can be separated. These approximations thus limit the precision and validity of the model used at higher temperatures.
The physical origin of thermal expansion arises from the fact that as the temperature increases the amplitude of atomic vibrations increases. A higher vibrational amplitude means that the average atomic distance in a cell increases, hence resulting in expansion. Additionally, as the temperature approaches the melting point of MgO the quasi-harmonic approximation breaks down since this approximation only takes into account linear motion. Therefore, the quasi-harmonic model prevents movement of free ions, which is present in molten MgO and hence this model is not appropriate for MgO near the melting point. Furthermore, as the temperature approaches the melting point the phonon modes become less representative of the actual motion of the ions since at higher temperatures the quasi-harmonic approximation tends to neglect phonon interactions.
For a diatomic molecule with an exactly harmonic potential, the bond length would not be expected in increase with temperature because the potential is symmetric and hence the average distance between atoms is constant. However, in the quasi-harmonic model for a solid the bond length increases with temperature (thermal expansion) due to the additional anharmonic factor included where bond dissociation is possible.
Molecular Dynamics
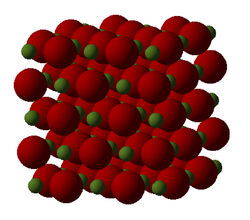
In order to compute the thermal expansion of MgO using molecular dynamics an MgO supercell was required in place of the primate unit cell that was used in previous calculations. The 64 atom (32 MgO unit) supercell was therefore used and can be seen in Figure 12. In theory, an even larger supercell would give rise to more accurate results but this would also result in a larger CPU time.
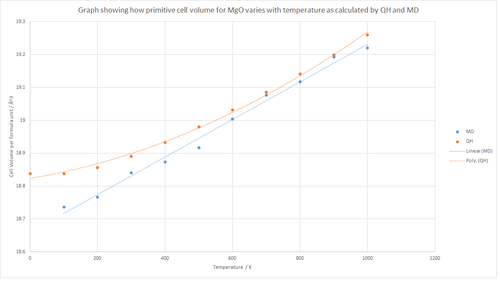
Figure 11 shows the results of the calculations performed using quasi-harmonic approximation and molecular dynamics. The graph shows that in general the cell volume increases with temperature for both plots, which is in agreement with the thermal expansion theory described above. The volumetric thermal expansion coefficient value of 2.0370 x 10⁻⁵ K-1 was obtained using molecular dynamics from 100-1000K as shown by the calculation below. This is relatively similar to value obtained using the quasi- harmonic approximation from 0-1000K. However, there are a couple of important features that can be seen from the graph in Figure 11. Firstly, it can be seen that the results from molecular dynamics are less consistent with the linear trend line, with results deviating from this line across many temperatures. Furthermore, the graph shows that the results from the quasi-harmonic approximation generally produced a larger cell volume when compared to molecular dynamics. However, this difference in cell volume becomes smaller at higher temperatures.
The molecular dynamics model produced results that were consistent with a linear trend whereas the quasi-harmonic model results were consistent with a polynomial trend. This difference is based on the fact that the quasi-harmonic model is based on the harmonic model, which has a quadratic curve. At higher temperatures, the molecular dynamics computation produces results that are similar to the quasi-harmonic function.
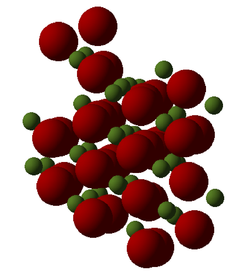
The irregular molecular dynamics results can be reduced by using a larger model than the one used in this calculation due to the larger sample size and hence gives rise to more accurate data. The molecular dynamics model allows the molecules to move in 3 dimensions which results in thermal expansion alongside creating a more irregular structure when compared to the quasi-harmonic model in which the molecules move in 1 dimension. This in turn suggest that at very high temperatures the molecular dynamic model will produce a larger cell volume in comparison to the quasi-harmonic model. The deformation of the structure can be seen in Figure 13, in which thermal expansion has changed the geometry of the cell.
Conclusion
In this computational experiment both the quasi-harmonic and molecular dynamic models were used to study the thermal expansion of an MgO crystal. Both these models correctly predict the thermal expansion of MgO and it was found that results are relatively accurate at low temperatures, but at high temperatures the accuracy drops. The quasi-harmonic approximation fails to accurately describe the thermal expansion of MgO at high temperature because this model is simplified by approximations in order to make the computation and calculations easier. The major approximation in this case was to do with the anharmonic factor. Therefore, in order to improve this particular model less approximations should be used which provides a better inclusion of the anharmonic behaviour of the system. On the other hand, the molecular dynamics model also does not accurately describe the thermal expansion of MgO at high temperatures. This model can be improved by using a larger MgO supercell (larger than the 64 atom cell used above) which would provide a better accuracy at higher temperatures due to a greater number of sample points being involved in the calculations. However, even though the accuracy was limited at higher temperatures, the approximations used in this experiment were suffice to enable the thermal expansion of MgO to be studied within a reasonable time frame. This included investigating the relationship between temperature and various properties of MgO, such as cell volume and free energy. Additionally, it was found that as the temperature reaches the melting point of MgO, both these models break down as MgO is no longer a solid and indeed becomes molten.
References
- ↑ M. Dove, Introduction to Lattice Dynamics, Cambridge University Press, Cambridge, 2005
- ↑ M. Browne. Schaum's outline of theory and problems of physics for engineering and science, McGraw-Hill Companies, 1999, 58
- ↑ 3.0 3.1 U. Rössler and R. Blachnik, Magnesium Oxide Crystal Structure, Lattice Parameters, Thermal Expansion, In: II-VI and I-VII compounds; semimagnetic compounds, Springer, Berlin, 1999, 1-6
- ↑ C. Kittel, Introduction to Solid State Physics, Wiley, 1996, 216
- ↑ Y. Rao, Stoichiometry and Thermodynamics of Metallurgical Processes, Cambridge University Press, Cambridge, 1985, 345
- ↑ U. Rössler and R. Blachnik, Calcium Oxide Crystal Structure, Lattice Parameters, Thermal Expansion, In: II-VI and I-VII compounds; semimagnetic compounds, Springer, Berlin, 1999, 1-3
- ↑ J. Weitkamp and L. Puppe, Catalysis and Zeolites, Springer Berlin Heidelberg, Berlin, 1999, 311
- ↑ M. Nadler and C. Kempfer, Anal. Chem., 1959, 31, 2109
- ↑ M. Durand, The Coefficient of Thermal Expansion of Magnesium Oxide, J. Appl. Phys, 1936, 7, 297
Calculations
Coefficient of Thermal Expansion for MgO using Quasi-Harmonic Approximation from 0-300K
Coefficient of Thermal Expansion for MgO using Quasi-Harmonic Approximation from 0-1000K
Coefficient of Thermal Expansion for MgO using Molecular Dynamics from 100-1000K

