Rep:Mod:AMM450
Optimisation of NH3
Calculated Data From Gaussian for NH3
Calculation Method: RB3LYP
Basis Set: 6-31G(d,p)
E(RB3LYP): -56.55776873 a.u.
RMS Gradient Norm: 0.00000485 a.u.
Point Group: C3v
N-H Bond Length: 1.01798 Å
(Literature Bond Length: 1.012 Å 2)
H-N-H Bond Angle: 105.741°
(Literature Bond Angle: 106.67° 2)
Output Calculation File from Gaussian for NH3
 Item                     Value        Threshold  Converged?
 Maximum Force            0.000004     0.000450     YES
 RMS     Force            0.000004     0.000300     YES
 Maximum Displacement     0.000072     0.001800     YES
 RMS     Displacement     0.000035     0.001200     YES
 Predicted change in Energy= -5.986274D-10
 Optimization completed.
    -- Stationary point found.
 ----------------------------
                           !   Optimized Parameters   !
                           ! (Angstroms and Degrees)  !
 --------------------------                            --------------------------
 ! Name  Definition              Value          Derivative Info.                !
 --------------------------------------------------------------------------------
 ! R1    R(1,2)                  1.018          -DE/DX =    0.0                 !
 ! R2    R(1,3)                  1.018          -DE/DX =    0.0                 !
 ! R3    R(1,4)                  1.018          -DE/DX =    0.0                 !
 ! A1    A(2,1,3)              105.7412         -DE/DX =    0.0                 !
 ! A2    A(2,1,4)              105.7412         -DE/DX =    0.0                 !
 ! A3    A(3,1,4)              105.7412         -DE/DX =    0.0                 !
 ! D1    D(2,1,4,3)           -111.8571         -DE/DX =    0.0                 !
 --------------------------------------------------------------------------------
Full Output File: Media:01235100_NH3_OPT2.LOG
NH3 |
Frequency Analysis of NH3
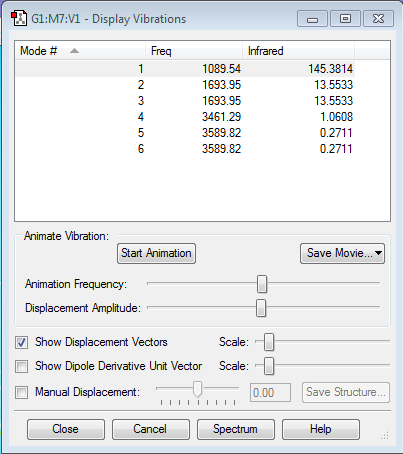
Frequency Analysis 1
How many modes do you expect from the 3N-6 rule? There are four atoms in NH3, therefore N = 4. Hence, six modes are expected.
Which modes are degenerate (ie have the same energy)? From the frequency analysis 1, 2 and 3 are degenerate and 5 and 6 also have the same energy.
Which modes are "bending" vibrations and which are "bond stretch" vibrations? From the Gaussview vibrations animation, the bending vibrations are determined to be 1,2 and 3 and the bond stretches 4,5 and 6 from frequency analysis 1.
Which mode is highly symmetric? From frequency analysis 1, the fourth mode of vibration is the most symmetric as the three bonds stretch and retract at the same frequency and to the same extent.
One mode is known as the "umbrella" mode, which one is this? The first mode of vibration in frequency analysis 1 is the umbrella mode as the hydrogen atoms bending up and down with respect to the nitrogen atom, represent an umbrella continuously closing and opening.
How many bands would you expect to see in an experimental spectrum of gaseous ammonia? In an experimental spectrum, three distinct bands are expected: one for each mode of vibration. However, overtones and rotational energy levels features of the molecule could be observed as well, as seen in the literature IR spectrum of gaseous ammonia shown in Figure 1 1.
Figure 1: Literature IR spectrum of gaseous ammonia
Charge Distribution in NH3
The relative charge on the N atom was calculated to be -1.125, while a charge of +0.375 was calculated for each H atom. This result is in accordance with theoretical expectations since nitrogen is more electronegative than hydrogen, hence a partial negative charge forms on it.
Optimisation of N2
Calculated Data From Gaussian for N2
Calculation Method: RB3LYP
Basis Set: 6-31G(d,p)
E(RB3LYP): -109.52412868 a.u.
RMS Gradient Norm: 0.00000060 a.u.
Point Group: D∞h
N-N Bond Length: 1.10550 Å
(Literature Bond Length: 1.098 Å 3)
N-N Bond Angle: 180°
Output Calculation File from Gaussian for N2
Item                      Value        Threshold  Converged?
 Maximum Force            0.000001     0.000450     YES
 RMS     Force            0.000001     0.000300     YES
 Maximum Displacement     0.000000     0.001800     YES
 RMS     Displacement     0.000000     0.001200     YES
 Predicted change in Energy=-3.401079D-13
 Optimization completed.
 -- Stationary point found.
                           ----------------------------
                           !   Optimized Parameters   !
                           ! (Angstroms and Degrees)  !
 --------------------------                            --------------------------
 ! Name  Definition              Value          Derivative Info.                !
 --------------------------------------------------------------------------------
 ! R1    R(1,2)                  1.1055         -DE/DX =    0.0                 !
 --------------------------------------------------------------------------------
Full Output File: Media:01235100_N2_OPT.LOG
N2 |
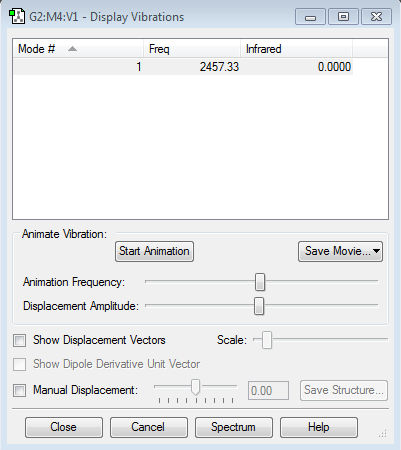
Frequency Analysis of N2
Frequency Analysis 2
From the frequency analysis 2, it can be seen that there are no IR peaks for the calculated frequency. There are no IR peaks because there is no changing dipole moment in a nitrogen molecule, hence N2 is infrared inactive.
Optimisation of H2
Calculated Data From Gaussian for H2
Calculation Method: RB3LYP
Basis Set: 6-31G(d,p)
E(RB3LYP): -1.17853936 a.u.
RMS Gradient Norm: 0.00000017 a.u.
Point Group: D∞h
H-H Bond Length: 0.74279 Å
(Literature Bond Length: 0.741 Å 3)
H-H Bond Angle: 180°
Output Calculation File from Gaussian for H2
 Item                     Value        Threshold  Converged?
 Maximum Force            0.000000     0.000450     YES
 RMS     Force            0.000000     0.000300     YES
 Maximum Displacement     0.000000     0.001800     YES
 RMS     Displacement     0.000001     0.001200     YES
 Predicted change in Energy= -1.164080D-13
 Optimization completed.
  -- Stationary point found.
                           ----------------------------
                           !   Optimized Parameters   !
                           ! (Angstroms and Degrees)  !
 --------------------------                            --------------------------
 ! Name  Definition              Value          Derivative Info.                !
 --------------------------------------------------------------------------------
 ! R1    R(1,2)                  0.7428         -DE/DX =    0.0                 !
 --------------------------------------------------------------------------------
Full Output File: Media:01235100_H2_OPT.LOG
H2 |
Frequency Analysis of H2
Frequency Analysis 3
Since, diatomic hydrogen is a homonuclear molecule, there is no changing dipole moment. Therefore, H2 is IR inactive as seen from frequency analysis 3.
Reaction Energy of the Haber-Bosch Process
In the Haber-Bosch process, the following reaction takes place, as seen in Equation 1:
N2 + 3H2 -> 2NH3 (Equation 1)
The following values for energies were retrieved from the Gaussian calculations using the RB3LYP calculation method:
E(NH3)= -56.55776873 a.u.
2xE(NH3)= -113.1155375 a.u.
E(N2)= -109.52412868 a.u.
E(H2)= -1.17853936 a.u.
3*E(H2)= -3.53561808 a.u.
ΔE=2*E(NH3)-[E(N2)+3*E(H2)]= -0.05579074 a.u. = -146.48 kJmol-1
In order to convert the energy change from a.u. to kJmol-1, a conversion factor of 2625.5 kJmol-1a.u.-1 was used. Since the reaction is exothermic, the products are more stable than the reactants.
Optimisation of CN-
Calculated Data From Gaussian for CN-
Calculation Method: RB3LYP
Basis Set: 6-31G(d,p)
E(RB3LYP): -92.82453153 a.u.
RMS Gradient Norm: 0.00000704 a.u.
Point Group: C∞v
C≡N Bond Length: 1.18409 Å
(Literature Bond Length: 1.177 ± 0.004 Å)
Bond Angle: 180°
Output Calculation File from Gaussian for CN-
Item               Value     Threshold  Converged?
 Maximum Force            0.000012     0.000450     YES
 RMS     Force            0.000012     0.000300     YES
 Maximum Displacement     0.000005     0.001800     YES
 RMS     Displacement     0.000008     0.001200     YES
 Predicted change in Energy= -6.650393D-11
 Optimization completed.
  -- Stationary point found.
                           ----------------------------
                           !   Optimized Parameters   !
                           ! (Angstroms and Degrees)  !
 --------------------------                            --------------------------
 ! Name  Definition              Value          Derivative Info.                !
 --------------------------------------------------------------------------------
 ! R1    R(1,2)                  1.1841         -DE/DX =    0.0                 !
 --------------------------------------------------------------------------------
Full Output File: Media:01235100_CN-_OPT2.LOG
CN- |
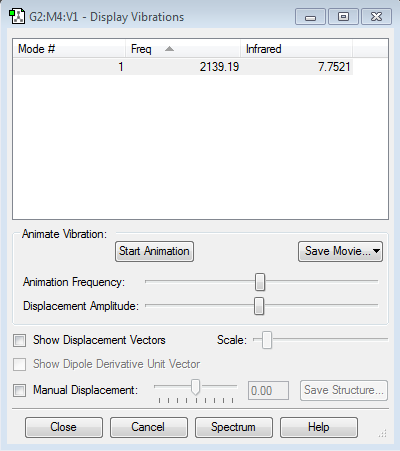
Frequency Analysis of CN-
Frequency Analysis 4
From the frequency analysis 4, one absorption band results. This outcome from the optimisation is in accordance with the '3N - 5' rule for modes of vibrations for diatomic molecules, where N=2.
Charge Distribution in CN-
The charge distribution analysis resulted in the nitrogen atom being more partially negative than the carbon atom, with calculated charges of -0.754 and -0.246 respectively, given that nitrogen is more electronegative than carbon.
Notable Molecular Orbitals of CN-
Figure 2: 1σ non-bonding molecular orbital
Figure 2 shows the lowest occupied molecular orbital. This orbital does not participate in bonding because of its low energy compared to the other molecular orbitals. The atomic orbitals that make up this molecular orbital are the 1s orbitals of carbon and nitrogen. There is more electron density on the nitrogen atom as nitrogen is more electronegative than carbon.
Figure 3: 2σ bonding molecular orbital
In figure 3, the 2σ bonding molecular orbital is shown. The atomic orbitals that overlap in phase to produce this molecular orbital are the 2s orbitals of both carbon and nitrogen. However, the shape produced is different from the homogeneous orbital that was expected. This could be due to some p character present in the molecular orbital, hence forming an sp orbital.
Figure 4: 1π bonding molecular orbital
Figure 4 represents one of the two 1 π bonding MO, formed by the sideways in phase overlap of two 2p atomic orbitals. The two π molecular orbitals are degenerate and lie in the HOMO/LUMO region. Moreover, the difference between the two degenerate MOs is just the orientation around the bond; they are perpendicular to each other as a nodal plane is present along the bond.
Figure 5: 1π anti-bonding molecular orbital
However, if the two 2p orbitals overlap sideways and with lobes out of phase, the two π anti-bonding molecular orbitals are formed. In fact, Figure 5 represents the anti-bonding orbital produced by the same 2p atomic orbitals that formed the π bonding orbital in Figure 4. The two degenerate anti-bonding orbitals are greater in energy than their bonding orbitals and they are also the lowest unoccupied molecular orbitals. There is less electron density on the nitrogen atom because, in anti-bonding orbitals, the least electronegative atom in the bond has the most electron density around it.
Figure 6: 3σ bonding molecular orbital
The highest occupied molecular orbital is represented in Figure 6. This bonding orbital is produced from the head-to-head overlap of 2p orbitals from nitrogen and carbon. The shape of the molecular orbital produced has some degree of p character.
References and Bibliography
1 A.L. Smith, The Coblentz Society Desk Book of Infrared Spectra, The Coblentz Society, Kirkwood, MO, 1982.
2 G. Herzberg, Molecular Spectra and Molecular Structure III. Electronic Spectra and Electronic Structure of Polyatomic Molecules, Van Nostrand Reinhold Co., New York, 1966
3 Huber, K.P.; Herzberg, G., Molecular Spectra and Molecular Structure IV. Constants of Diatomic Molecules, Van Nostrand Reinhold Co., New York, 1979.


