Rep:Mod:AM01389684
BH3
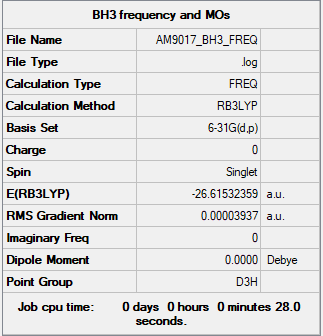
         Item               Value     Threshold  Converged?
 Maximum Force            0.000079     0.000450     YES
 RMS     Force            0.000039     0.000300     YES
 Maximum Displacement     0.000310     0.001800     YES
 RMS     Displacement     0.000155     0.001200     YES

 Low frequencies ---   -0.3314   -0.1556   -0.0055   31.8788   33.4729   33.4746
 Low frequencies --- 1163.3106 1213.3942 1213.3969
BH3 Molecule |
| Wavenumbers(cm-1) | Intensity(arbitrary units) | Symmetry | IR Active? | Type |
|---|---|---|---|---|
| 1163 | 93 | A2 | Yes | Out of plane bend |
| 1213 | 14 | E' | Yes | In plane bend |
| 1213 | 14 | E' | Yes | In plane bend |
| 2581 | 0 | A'1 | No | Symmetric stretch |
| 2714 | 126 | E' | Yes | Asymmetric stretch |
| 2714 | 126 | E' | Yes | Asymmetric stretch |
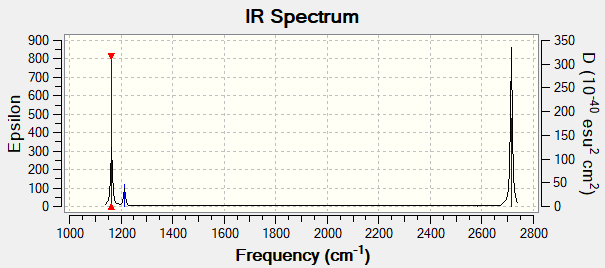
The table shows 6 vibrations however the IR spectrum only shows 3 peaks. This is because the vibrations at 1213 and 2714 cm-1 have degenerate vibrations (same energy) and therefore will still only produce one peak per set of degenerate vibrations. The vibration at 2581-1 shows no peak as it has 0 intensity due to the fact that it is a symmetric stretch and therefore has no change in dipole moment and so will not be IR active.
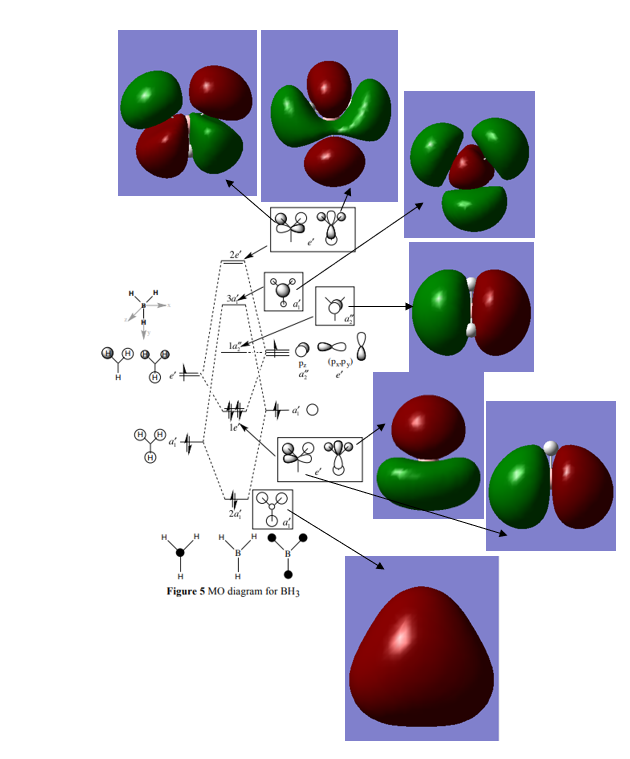
MO Diagram of BH3 with real orbitals
The picture shows the real orbitals to be more diffuse than the LCAOs therefore the electron density will cover more space than the LCAOs. This can be seen well in the 2e' orbitals for example.[1]
Ng611 (talk) 20:36, 29 May 2019 (BST) This is not really a significant difference. There are other more significant ones. Can you identify them?
NH3
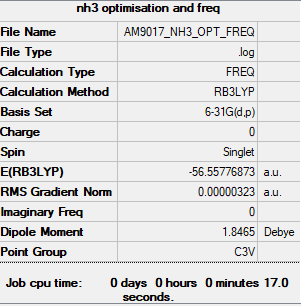
         Item               Value     Threshold  Converged?
 Maximum Force            0.000006     0.000450     YES
 RMS     Force            0.000004     0.000300     YES
 Maximum Displacement     0.000014     0.001800     YES
 RMS     Displacement     0.000009     0.001200     YES

Low frequencies ---   -0.0128   -0.0019    0.0007    7.1034    8.1048    8.1051
Low frequencies --- 1089.3834 1693.9368 1693.9368
NH3 Molecule |
NH3BH3
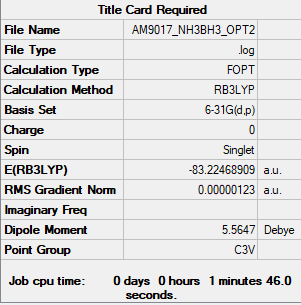
Item               Value     Threshold  Converged?
 Maximum Force            0.000031     0.000450     YES
 RMS     Force            0.000008     0.000300     YES
 Maximum Displacement     0.000165     0.001800     YES
 RMS     Displacement     0.000086     0.001200     YES

Low frequencies ---   -0.1323   -0.0803   -0.0074   13.3999   13.4163   15.3144
Low frequencies ---  263.5208  633.1197  639.2499
NH3BH3 Molecule |
E(NH3) = -56.55777au
E(BH3) = -26.61532au
E(NH3BH3) = -83.22469au
ΔE=E(NH3BH3)-[E(NH3)+E(BH3)]
ΔE= -83.22469 - (-56.55777 - 26.61532)
ΔE= -0.05160au = -135KJ/mol. This value represents the formation of a B-N dative bond. This a relatively weak bond as when compared to a B-N covalent bond (389 KJ/mol) the value is much lower.[2]
Ng611 (talk) 20:36, 29 May 2019 (BST) Good!
NI3
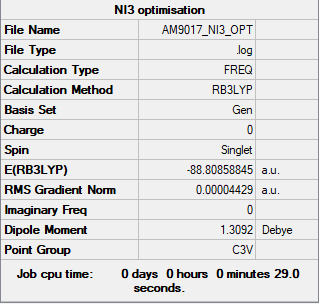
         Item               Value     Threshold  Converged?
 Maximum Force            0.000102     0.000450     YES
 RMS     Force            0.000075     0.000300     YES
 Maximum Displacement     0.000858     0.001800     YES
 RMS     Displacement     0.000629     0.001200     YES

Low frequencies ---  -12.3847  -12.3783   -5.6131   -0.0040    0.0194    0.0711
Low frequencies ---  100.9307  100.9314  147.2333
Frequency file: Media:AM9017 NI3 OPT.LOG
NI3 Molecule |
The optimised N-I bond length was found to be 2.184Å.
[N(CH3)4)]+
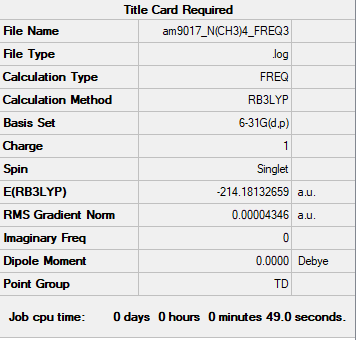
Item               Value     Threshold  Converged?
 Maximum Force            0.000084     0.000450     YES
 RMS     Force            0.000043     0.000300     YES
 Maximum Displacement     0.000835     0.001800     YES
 RMS     Displacement     0.000477     0.001200     YES

Low frequencies ---   -0.0012   -0.0011   -0.0007   34.5465   34.5465   34.5465
Low frequencies ---  216.8630  316.1656  316.1656
Media:AM9017 N(CH3)4 FREQ3.LOG
[N(CH3)4]+ Molecule |
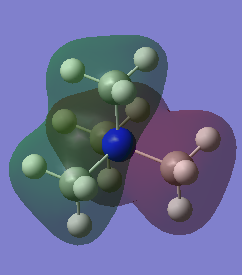
Charge Distributions
| Atom | Charge Distribution(Coulombs) |
|---|---|
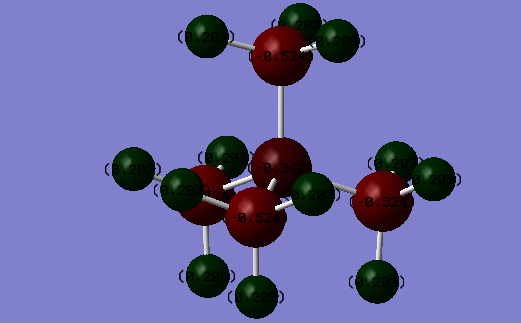
| Hydrogen | 0.203 |
| Carbon | -0.524 |
| Nitrogen | -0.342 |
| Atom | Charge Distribution(Coulombs) |
|---|---|
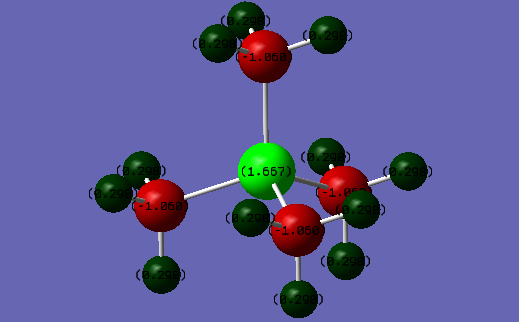
| Hydrogen | 0.298 |
| Carbon | -1.060 |
| Phosphorous | 1.667 |
These two pictures show the charge distributions of [N(CH3)4)]+ and [P(CH3)4)]+ respectively. Carbon has an electronegativity of 2.55[3], which is higher than the phosphorous electronegativity of 2.19. The phosphorous atom is also larger and so the charge density will decrease which can stabilise a positive charge better than carbon. Therefore in the C-P bond, the carbon atom will have a more negative charge. However, nitrogen has an electronegativity of 3.04 which is higher than the carbon electronegativity but carbon has a more negative charge than nitrogen. This is because nitrogen forms 3 covalent bonds but since it only has 5 valence electrons the fourth bond will be a dative bond and so nitrogen will have a formal positive charge. Therefore the nitrogen will have a more positive charge than expected, if we were to just look at the electronegativities. The carbon atom in [N(CH3)4)]+ has a more positive charge than in [P(CH3)4)]+. This is because the formal positive charge is spread over the nitrogen and carbon atoms(instead of being located just on the nitrogen atom, as depicted in a traditional picture), especially since carbon has a lower electronegativity than nitrogen and so can stabilise a positive charge better. There is not much difference in the charge distributions of the hydrogen atoms of each molecule due to the fact that as the distance from the central atom increases, the effects of electronegativity will decrease.
Ng611 (talk) 20:38, 29 May 2019 (BST) Consider also the effect of molecular symmetry. Otherwise, good analysis.
A flaw of these pictures is that it shows the charges to be localised on each atom however in reality the charges are spread over the molecule. This can be seen by MO diagrams.
MO diagrams
| LCAO Diagram | MO | Description |
|---|---|---|
MO8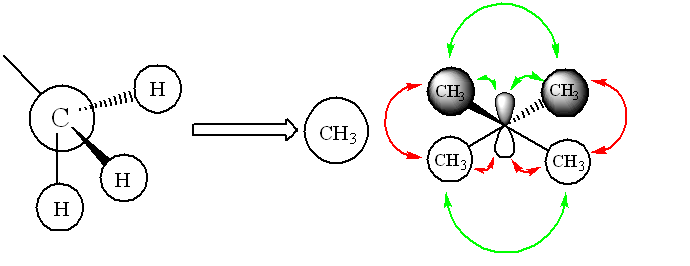 |
 |
This ligand FO is comprised of in phase Hydrogen and Carbon s orbitals overlapping. The MO is then comprised of two in phase and two out of phase ligands FO which interact with the same phase lobes of the Nitrogen atom respectively. The only node is on the p orbital of the nitrogen atom and so is over a bonding orbital.
Ng611 (talk) 20:40, 29 May 2019 (BST) Your s-type FOs/p-orbital interaction is mislabelled here. |
MO10 |
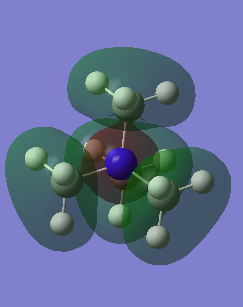 |
This is a bonding orbital. The only nodes are on the p orbitals on the carbon atoms. The p orbitals are orientated to be in phase with the nitrogen s orbital and so there are no nodes along the bonds.
Ng611 (talk) 20:41, 29 May 2019 (BST) This is actually antibonding, although the small 'nub' of electron density seems to suggest otherwise. You FOs are actually s-type. |
MO18 |
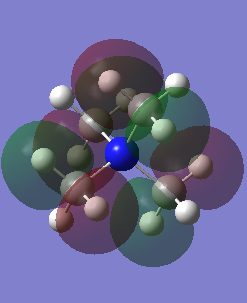 |
This is a non-bonding orbital. The nodes are on the p orbitals on the carbon atoms. The ligand orbitals here do not interact with the nitrogen atom. |
[P(CH3)4)]+
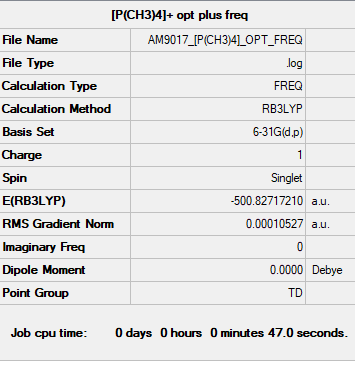
Item               Value     Threshold  Converged?
 Maximum Force            0.000177     0.000450     YES
 RMS     Force            0.000105     0.000300     YES
 Maximum Displacement     0.001509     0.001800     YES
 RMS     Displacement     0.000874     0.001200     YES

Low frequencies ---   -0.0024   -0.0023   -0.0009   50.5667   50.5667   50.5667
Low frequencies ---  185.8154  210.8026  210.8026
Media:AM9017 -P(CH3)4- OPT FREQ.LOG
[P(CH3)4]+ Molecule |
Bibliography
- ↑ Prof. Hunt, P (2018), Lecture 4 Tutorial Problem Model Answers, Imperial College London.
- ↑ 1.Lange, N. & Dean, J. Lange's handbook of chemistry. (McGraw-Hill, 1979).
- ↑ Little, E. J., & Jones, M. M. (1960). A complete table of electronegativities. Journal of Chemical Education, 37(5), 231. https://doi.org/10.1021/ed037p231

