Rep:Mod:AKFMGO
Introduction
Aims of the Simulation
This computational simulation seeks to describe the thermal expansion of an MgO lattice, which depends on the energies and the harmonic vibrations between the neighbouring ions. In addition, a comparison between the quasi-harmonic approximation and molecular dynamics calculations will be made, based on the different approaches in calculating the free energy of MgO. thermal expansion is described by the thermal expansion coefficient, shown below:

Representing the Lattice and Programming Tools
MgO is a body-centered cubic lattice that has the same structure as NaCl, with a space group Fm3m. In order to approximate the thermodynamic properties of an infinite lattice, the conventional cells and the primitive cells serve as equivalent basic unit for calculation, as shown below:
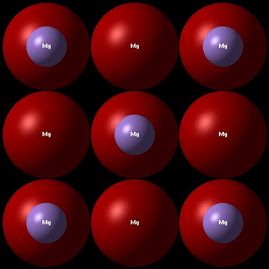
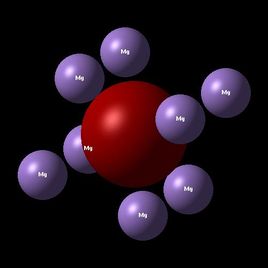
In the conventional cell, the lattice parameter across three dimensions are all equivalent and that the angles between each parameter are 90 degrees. The primitive cell of MgO lattice has parameters half of the lengths of the diagonals of the conventional cell. Furthermore, MgO is described by the primitive cell as containing a single MgO unit, or the asymmetric unit. MgO conventional unit cell contains a total of 8 atoms:
Number of atoms in the corners: 8 (shared between 8 cells) = 1 net atom
Number of atoms at the edges: 12 (shared between 4 cells) = 3 net atoms
Number of atoms on the faces: 6 (shared between 2 cells) = 3 net atoms
As a result, the total number of atoms is 8, including the atom at the center of the unit cell.
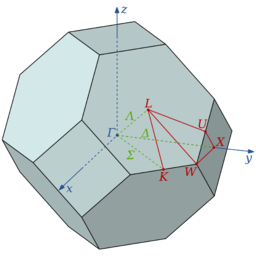
To model the lattice structure, we first define the Brillouin zone (the representative unit cell in the reciprocal space, shown above, a volume that contains all unique k-vectors to represent waves in a periodic structure. It is also noteworthy to mention that a fcc lattice in the real space translates into bcc Brillouin zone in the reciprocal space via Fourier transform. To determine a real space lattice structure, diffraction methods are used, which gives rise to wave-vector to describe wave propagation. Given that the unit of wave vector, k, is the inverse length, a reciprocal space is used. More specifically, k results from the application of Fourier transform on a three-dimensional quantum mechanical harmonic chain of N atoms. And k takes on quantized values with lattice spacing 'a' (in this case, the parameter of the unit cell).At the (0,0,0) point in the reciprocal space, all the cells are in phase and therefore running simulations on a single unit cell would not yield any bands in the dispersion plot.
In order to accurately determine the thermodynamic properties of the unit cell, a shrinking factor is used. A shrinking factor refers to the number of reduction made to the unit cell per dimension (eg. a 1x1 shrinking factor in 2 dimensions slice the unit cell once in the x direction and once in the y direction). As a result, the k points are evaluated points when at the corners of the reduced cells within the unit cell.
The simulations are run on RedHat Linux which is a platform for numerical simulations. By launching the DLVisualize program, the MgO lattice structure can be viewed and that the properties generated based on quantum mechanical codes. One of such programs accessible is GULP (General Utility Lattice Program), a chemistry imaging program, to model the energetic property of MgO lattice. The lattice energy is composed of long and short-range potentials. For a structure with large numbers of constituent ions, the predominant short-range potential description is described by the Buckingham potential, which is a simplification of the Lennard-Jones potential to describe attractions and repulsion between two adjacent ions.
Methodology of Calculations (Describe QH Method + MD method)
Calculations are performed using two methods: the quasi-harmonic approximation and the molecular dynamics Methods. The QH method assumes harmonicity for all thermodynamic properties except volume-dependent ones, such as thermal expansion. And it works under the assumption that harmonicity holds for every lattice parameter and at every temperature. To derive thermodynamic properties, the quasi-harmonic approximation only relies on the static lattice energy and the distribution of phonon frequencies across the Brillouin zone.[1] In this model, the anharmonicity is a weak effect and that the temperature dependence of phonons is only from the dependence on crystal volume.
From importing a MgO model, the structure of the lattice must first be defined: the primitive unit cell is the smallest unit required to build the entire lattice;the conventional cell is a cube that reflects the symmetry of MgO. As such, the methodology of GULP involves the evaluation of interactions of core atoms within the lattice, in particular the short-range potential described by Buckingham potential, as defined below.[2]The term on the right represents an attraction between adjacent ions, while the term on the left represents repulsion. An approximation is made that the shorter-range potentials predominate in an infinite lattice, and to save CPU time, longer range potential is not accounted for.

To simulate the calculations of the system, the forces acting on the atoms within the lattice need to be defined precisely. The Buckingham potential fits the criteria, as it provides a simpler atomistic calculation based on short-range interactions between Mg2+ and O2- ions.[3] For subsequent calculations, the structure must be optimized by choosing a grid size where the energy minimization occurs.Due to the exchange between CPU resources and accuracy, the smallest grid size giving the equilibrium free energy must be derived for future calculations. In order to approximate the free energy of an infinite lattice, the free energy is calculated by the sum of all vibrational modes in the optimal grid size using 50 k-points.
The Molecular Dynamics approach is deterministic and therefore shows the evolution of the system over time using Newtonian laws. Unlike the QH approximation, molecular dynamics simulate the actual vibrational motion of the atoms, by first defining the initial positions based on an ideal case with minimized starting energies and then the velocities are updated. From this, a series of configurations are incorporated into an ensemble (in this exercise, NPT), from which the properties can be averaged. The working principle behind molecular dynamics is the Ergodic hypothesis, which states that if sufficiently large number of configurations are time-averaged, then it is equal to the statistical average of the system. Every configuration is calculated until the average thermodynamic properties become constant, as this indicates complete equilibrium.
Unlike the QH method, there are no quantum effects associated with the atoms in the MD simulation, which looks at entire atoms instead of interatomic entities. As a result, there are no additional assumptions or approximations in the MD method as compared to the QH approximation. One of the most important parameters in MD simulation is the time step, or the time interval, in which each integration step is performed. For the purpose of this experiment, the time step is set at 1.0 femtosecond. In order to sample all frequencies, 1 femtosecond is chosen so that the time step is smaller compared to the period of the highest vibrational frequency.
Computing the Phonon Modes
Phonons are described as a unit of vibrational energy, representing an excitation in an arrangement of atoms in a solid. The operating principle behind the calculation for free energy is that the vibrational frequencies can be converted to energies and therefore produce a energy level diagram and occupancy of each levels based on the density of states.
The energetic levels can be determined using the degree of overlap/repulsion between molecular orbitals or by using the uniformity of vibrational motion along a chain of atoms. In between molecular orbitals with opposite phases, k also represents nodes. When k =0, this corresponds to a chain of molecular orbitals in the same phases and vibrating in an uniform motion to produce a maximum wave front.
Density of States Curve
The DOS curve plots frequencies detected versus the weighting of each frequency detected. Given the difficulties in modelling the energy levels in a large system, the DOS curve is produced by averaging over the Brillouin zone, or the primitive cell defined in the reciprocal space. As a result, the density of states curve represents a method to translate wave frequencies detected in reciprocal space back to real space. The shapes and size of each DOS curve can be predicted using the slopes of the E(k) versus k plots (where greater population of states have a flatter slope on the E(k) versus k plot).
The program defines 50 points to be evaluated while the shrinking factor defines the extent the reciprocal unit cell will be split. Given that the density of states curve is only statistically reliable when all frequencies are sampled, increasing the shrinking factor has the effect of leading to a smoother DOS curve with comprehensive weightings for each of the vibrational mode detectable in the lattice. This trend of increasing features on the DOS curve is shown below, where the number of k points generated varies with the shrinking factor; for an instance, a 2x2x2 grid produces 8 k-points while 4x4x4 samples 64 k-points.
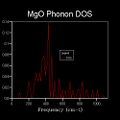
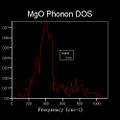
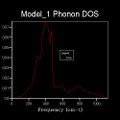
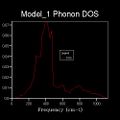
Figure 1: The DOS curves, from left to right: 2x2x2, 4x4x4, 8x8x8, 16x16x16, 17x17x17, 18x18x18. Maximized number of features detected by 16x16x16 grid size.
By comparison between 16x16x16 grid size's DOS curve with the 18x18x18 grid size's DOS curve, the 16x16x16 grid size gives a minimum for reasonable approximation given that all the relevant bands are illustrated. Comparisons with smaller grid sizes produce different weightings given that there is a smaller sample populations and that the plot illustrates more defined peaks given that less frequencies are detected (less number of k points). This can be interpreted as less energetic states detected when the number of sample points (k-points) decrease. The 16x16x16 grid size produces a DOS curve similar to larger grid sizes with the same number of features, which are missing from 15x15x15 DOS curve, making 16x16x16 DOS curve the minimum optimum grid size. As a result, the DOS curve provides a qualitative approach to quickly identify the grid size that mirrors an infinite lattice’s energies but conserve CPU time.
Dispersion Curves
Dispersion describes the relationship between the frequency of a phonon and its wave number. The dispersion curve is generated along a defined path across the unit cell, as to incorporate the sample points (defined further by notation, Npoints in GULP). In addition, the dispersion curve illustrates the difference in energies for two k-points. The vibration mode that lies at the bottom of the curve couples most effectively and is the most symmetric pairing vibration (no nodes along the atomic orbitals).
The dispersion relation is as follows:

As shown above, the dispersion relation accounts for both optical and acoustic branches, where the + sign represents the optical mode and the – sign represents the acoustic modes, a is the lattice spacing between two atoms, and k is the wave vector. The dispersion curve is composed of acoustic and optical branches, which are distributed from 3N modes, where there are always 3 acoustic branches and 3Z-3 optic branches (Z is the number of atoms in a unit cell). The dispersion curve also shows folding patterns based on the length of the Brillouin zone defined (as the distance changes, the energy curve must reflect all energies). Every point along the path is a k-point, where k is a wave-vector that is defined in the reciprocal space. When the shrinking factor equals to one, there is expected to be one k point, which translates into sampling one cell in the real space. As shown in the section above, the path used in the simulation is defined in the Brillouin zone, where a section of the lattice can be isolated. In this calculation, 50 points are chosen along a path defined by W (0.5, 0.25, 0.75), L (0.5,0.5,0.5), G (0,0,0), X (0.5, 0, 0.5), W (0.5,0.25,0.75) and K (0.375, 0.275, 0.75). As summarised earlier, the density of states is related to the dispersion curve in that the DOS curve results from weighting all the vibrational modes excitation that are detected in the sample.
The density of states plot gives the main frequencies detected in the 1x1x1 grid; which in return, can be used to derive the k-point on the phonon dispersion curve.
Figure 2: The Dispersion Curve and DOS curve of 1x1x1 grid size
The 1x1x1 grid size produces six frequencies: 288.49 cm-1 , 288.49 cm-1 , 351.76 cm-1 , 351.76 cm-1 , 676.23 cm-1 and 818.82 cm-1 . Six frequencies resulted from the vibrational modes of MgO in three dimensions, four of which produces two degenerate sets. As a result, the DOS curve illustrates higher intensities for the ~300 cm-1 and ~360 cm-1 peaks. From these frequencies, there are 3 acoustic nodes and 3 optical modes to sample. Matching the frequencies detected on the dispersion curve and the DOS log file, the k-point detected for 1x1x1 grid is (0.5, 0.5, 0.5), one of the point chosen along the path.
Considerations of other species with the same optimum grid size:
Phonon frequencies are evaluated at k-vectors within the Brillouin zone. And based on the GULP program, special points scheme is implemented to define this zone based on a shrinking factor along cell vectors.[4] For systems with high symmetry and lower number of atoms per unit cell, a denser grid size is required to sample enough frequencies to be statistically accurate.
CaO has the same crystal structure as MgO, being a face-centered cubic lattice, with two atoms in the primitive cell. As a result, CaO shares the same space group as MgO, Fm3m, which indicates that the two oxides have the same number of phonon "types" to represent each vibrational mode's excitation. The result of increased grid size is manifested on the DOS curve, as more frequencies can be sampled to illustrate a more comprehensive collection of bands (the difference in energies between certain excitation). Given that the expected vibrational modes are similar for the two lattices, there is no value in increasing the grid size further as it will cost CPU resources. The difference between the two lattices is shown instead on the dispersion curve, where the frequencies of CaO is lower than that of MgO due to an increased in reduced mass and decreased force constant.
Lithium lattice is a body-centered cubic lattice with one atom in the primitive cell, and therefore possesses less variation in the number of non-degenerate vibrational excitation. As a result of having a smaller unit cell, more k-points are required to sample enough phonon modes, and as a result a grid size greater than 16x16x16 is required to gain a comprehensive DOS curve. Furthermore, lithium lattice has high symmetry with space group, Im-3m, indicating that a number of k points will be repetitive, as shown on the dispersion curve below (where 3 acoustic modes of lithium shows convergence).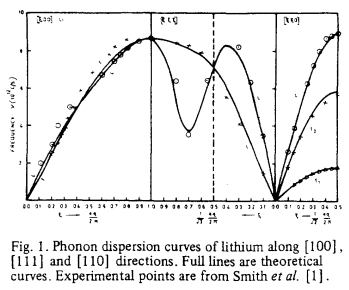
Fajausite is a form of zeolite, or microporous structures, with sodalite cages with hexagonal prisms. The structure has lower symmetry compared to CaO and Lithium metal, given the space group, Fd3m, and the lattice has a total of 48 tetrahedral units within the unit cell, corresponding to 192 atoms. This indicates that there are a total of 3(192) modes, 573 of which are optical modes. Due to the large number of vibrational modes detectable, a less dense grid size would be sufficient to sample along the path to define a DOS curve with the required features. Compared to the other species, faujasite should utilize a grid size smaller than 16x16x16 to conserve CPU resources.
Computing the Free Energy - The Harmonic Approximation
The Harmonic Approximation assumes that the amplitudes of the oscillations are sufficiently small, which becomes invalid when thermal effects are being considered. For this purpose, the quasi-harmonic approximation is used, which treat phonon frequencies as dependent on volume.
Quasi-harmonic approximation assumes quantum mechanical behaviours and sums the vibrational modes of the lattice to produce the free energy. Given that vibrational frequencies can be converted to energy and that the grid size affects the comprehensiveness of frequencies being sampled, as shown earlier, the free energy accuracy is also affected by grid sizes. By increasing the shrinking factor, the Brillouin zone is split and this corresponds to more cells being sampled in the real space. In order to quickly reach the minimal grid size required to model an inifinite grid size, the shrinking factor is increased by a factor of 2 until the free energy value remains constant (at the order of 10-6).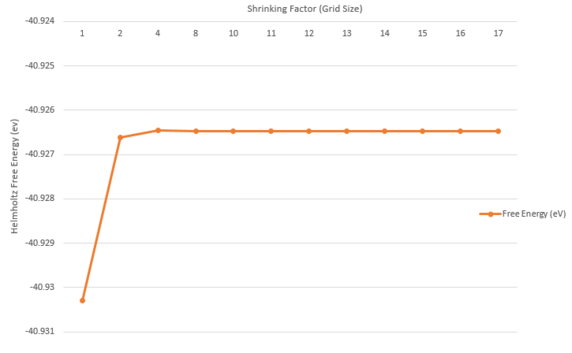
Increasing grid size has the effect of sampling more k-points, and therefore the Free Energy value converges when enough k-points have been accounted for. In the QH approximation method, the free energy is computed as a sum of all the vibrational modes over a finite grid of k-points. As shown on the left, the free energy value converges to -40.9265 eV, which is observed for grid sizes above 13x13x13.
| Free Energy Values Dependence on Grid Sizes | Helmholtz Free Energy (eV) |
|---|---|
| 1x1x1 | -40.930301 |
| 2x2x2 | -40.926609 |
| 4x4x4 | -40.926450 |
| 8x8x8 | -40.926471 |
| 10x10x10 | -40.926478 |
| 11x11x11 | -40.926481 |
| 12x12x12 | -40.926481 |
| 13x13x13 | -40.926482 |
| 14x14x14 | -40.926482 |
| 15x15x15 | -40.926482 |
| 16x16x16 | -40.926482 |
| 17x17x17 | -40.926482 |
Figure 3 (left): Variation of Free Energies with Grid Sizes, Table 1 (right): Tabulated Free Energy Values with Grid Sizes
Comparisons with the previous section reveals that, in fact, the convergence of energetic value to that of an infinite lattice's occur at earlier grid size (as oppose to the optimal grid size for the DOS curve). The purpose of this exercise is to identify the optimal grid size, which would reflect the energy of an infinite lattice (where all the distinct vibrational frequencies that can be sampled will be accounted for), while ensuring that this grid size is sufficiently small to conserve the CPU resources.

The zero point energy is dependent on the sum of Vk,i which is the vibrational frequency at a given k wave-vector. As a result, increasing the density of grid sizes would result in a collection of more frequencies within the lattice, and therefore maximize the zero-point energy, resulting in an increase in Helmholtz free energy. From 12x12x12 grid size to 17x17x17 grid size, the Helmholtz Free Energy has remained constant, and therefore 17x17x17 grid size can be assumed to have converged to the infinite grid value. For calculations accurate to 1 meV, the 2x2x2 yields sufficient accuracy (comparison to 17x17x17 grid size). For calculations accurate to 0.5 meV, the 4x4x4 yields sufficient accuracy as it has a difference of 0.00003 eV compared to the free energy of 17x17x17 grid size. Finally for calculation accurate to 0.1 meV, the 11x11x11 grid size yields sufficient accuracy. Variations of the total free energy are not large from 2x2x2 to 17x17x17 grid size, with the largest magnitude being 102, due to the fact that only vibrational contributions change, while monopole interactions and interatomic potentials are constant moving between grid sizes.
Considerations of other species with the same optimum grid size:
The QH approximation calculates the free energy by investigating the vibrational contributions of the system, as it sums over the k wave-vector across the primitive unit cell. As a result, there is priority to ensure that the DOS curve is as comprehensive as possible. To achieve this while saving calculation time, an optimal grid size should be used, the process of choosing which grid size according to species is identical as in previous discussion. Structures that have large unit cells and lower symmetry (eg. Zeolites) require a less dense grid size to sample enough frequencies so that a comprehensive DOS curve is produced. On the other hand, structures that possess higher symmetry (lithium metal) would require denser grid to ensure that the weightings assigned to the few frequencies are accurate. Given that CaO possesses the same symmetry and unit cell size as MgO, 16x16x16 optimal grid size is applicable.
Thermal Expansion of MgO
The total Helmholtz free energy of the crystal can be computed when all of the vibrational bands and all of the k points are summed over the Brillouin zone. For each pair of atoms, the forces can be characterized by a potential energy function which includes intermolecular forces and electric force. To solve the many-body problems in an infinite lattice, the harmonic potential is assumed and so every MgO units are connected by spring-like bonds. In this part of the simulation, the cell type is primitive and therefore has a rhombohedron shape with a total of one MgO unit (the asymmetric unit).
Given that the equilibrium structure always possesses the lowest free energy, the temperature dependence of the system needs to be calculated at the optimized structure with minimum of the free energy. As determined by the previous section, this is a unit cell with grid size, 16x16x16, which sufficiently provides accurate results while being small enough to conserve CPU time for calculations. Helmholtz Free Energy is expected to decrease with increasing temperature, due to larger entropic contributions, given that: F(T,V) = U(V) + EZP(V) - TS(T,V), where U(V) is the internal energy, EZP is the vibrational zero-point energy, T is temperature (K) and S is the entropy.
Optimizing the structure of MgO with respect to the free energy in intervals of 100K yield the following results on Table 2. To calculate the thermal expansion coefficient, a polynomial curve of 2nd order is fitted to volume variation with temperature. By differentiating the fitted polynomial's equation (V = 0.0027T2 + 0.0119T + 18.807), a differential results: dV/dT = 0.0054T + 0.0119. From the differential equation, it is then possible to solve for dV/dT at specific temperature values. However, this method appears to produce results that are several magnitudes away from the literature values. As a result, calculations on this exercise uses a linear approximation, where it is assumed that thermal expansions in intervals of 100K are perfectly linear and that dV/dT is calculated using the final volumes separated by 100K intervals. This approach also mirrors how the simulation runs in the program, as the subsequent initial cell volume is the final cell volume of the previous temperature run.
| Temperature (K) | Initial Cell Volume (Angs3) | Final Cell Parameter (Angs) | Final Cell Volume (Angs3) | Helmholtz Free Energy (eV) | Thermal Expansion Coefficient (10-6 K) |
|---|---|---|---|---|---|
| 0 | 18.836494 | 2.986563 | 18.836494 | -40.901906 | 0 |
| 100 | 18.836494 | 2.986563 | 18.836494 | -40.902419 | 0 |
| 200 | 18.836494 | 2.987605 | 18.856203 | -40.909377 | 10.460011 |
| 300 | 18.856209 | 2.989391 | 18.890026 | -40.928124 | 17.956096 |
| 400 | 18.890035 | 2.991631 | 18.932509 | -40.958594 | 22.553553 |
| 500 | 18.932493 | 2.994137 | 18.980114 | -40.999435 | 25.272742 |
| 600 | 18.980110 | 2.996822 | 19.031225 | -41.049315 | 27.134022 |
| 700 | 19.031215 | 2.999646 | 19.085061 | -41.107118 | 28.580681 |
| 800 | 19.085057 | 3.002591 | 19.141320 | -41.171891 | 29.867014 |
| 900 | 19.141340 | 3.005638 | 19.199643 | -41.243017 | 30.962758 |
| 1000 | 19.199644 | 3.008787 | 19.260047 | -41.319847 | 32.067528 |
Table 2: Temperature dependence of thermodynamic properties for a lattice cell with 16x16x16 grid size
(Attached gallery attachments: Lattice Parameter versus T, Free Energy versus T and Thermal Expansion Coefficient versus T for 16x16x16 grid size)
Using directly adjacent points for calculating the thermal expansion coefficient has produced steeper increments in volume and therefore thermal expansion coefficient, as compared to finding the difference in volume from a temperature value to 0K. Both variations of lattice constant and free energy with temperatures display a decay curve resembling 2nd order polynomial (R-mean squared value is approximately 0.99). The estimated polynomial equation that describes the lattice parameter variation with temperature is y = 0.0001T2+ 0.0006T+ 2.985. Exponential behavior observed in the variation of free energy results from the entropy term, which states:
Each phonon represents the excitation of a vibrational node. At 0K, there are no phonons present, and therefore the lattice is considered to be static, but still possesses quantum mechanical zero-point vibrations, given that the uncertainty principle requires a system to have a zero-point energy greater than the potential minimum. As temperature increases, more phonons are generated and that the lattice vibrates. A data anomaly is observed at 100K, where no thermal expansion is observed, which may be attributed to the possibility that the energy requirement to generate the lowest energy phonon is not met.
The volume and free energy, based on the equation above, has an inverse relationship and that increasing volume increases the entropic term. Furthermore, the free energy decreases with increasing temperature due to Badger's rule, which states that the vibrational frequency is directly correlated to the strength of bonding between the atoms. As a result, an increase in the volume of the cell will decrease the force constants between the atoms and as a result lowers the vibrational contribution to the free energy. As shown in simulation data, the total free energy comprises of: interatomic potentials, monopole interactions and vibrational contribution, where only the latter changes in the QH calculations.
Quantifying Thermal Expansion
Thermal expansion's physical origin comes from the tendency for materials to change volume in response to temperature influx. Increasing volume results from increased interatomic distances, and therefore significant thermal expansion should be observed for systems with lower bond energy. As a result, the thermal expansion is inherently connected to anharmonicity of the interatomic potential given that a one-dimensional harmonic potential energy curve will show symmetry about the mean bond length (the equilibrium distance between two atoms). For a strictly harmonic crystal, the average equilibrium position vibrating around the minimum must coincide with the original bond length at any temperature, and do not expand.
| Temperature | Experimental α (10-6 K) | Literature
α (10-6 K) |
Percentage Error |
|---|---|---|---|
| 100 | 0.0000 | 2.1000 | - |
| 200 | 10.4600 | 7.3900 | 41.542625% |
| 300 | 17.9560 | 10.400 | 72.653846% |
Table 3: Comparisons between Experimental and Literature thermal expansion coefficients for 16x16x16 grid size.[6]
The calculation is performed consecutively in order from 0K to 1000K, and therefore the initial cell volume of the next temperature value is equal to the final cell volume of the previous temperature. dV, the change in volume is evaluated for each temperature and for 0K and V0 is the initial cell volume at 0K (which is accounted for due to the zero-point energy, as Heisenberg’s uncertainty principle, which states that the quantum-mechanical system cannot have absolutely precise momentum and position). In calculating the thermal expansion coefficients, the main approximations are the linear gradient between two points and that the gradient across 100 K interval is accurate enough to represent the whole curve.
Comparisons with literature values shown that the thermal expansion coefficients generated using the QH approximation is lower. This is due to the main assumption made in the QH method, in which phonons are treated as independent units and that the only non-harmonic effect originate from volume-dependent properties. However, non-harmonic effects beyond the QH method also include phonons' interactions at thermally and electronically excited states, which would have additional decay pathways into lower-energy phonons. This additional anharmonicity will lead to decreased thermal expansion in reality. Increasing percentage error with temperatures as shown on table 3 reflects the fact that phonon-phonon interactions become much more frequent at higher temperature. Another assumption made in the calculations is that the temperature dependence scales linearly with the thermal expansion.
The QH method is a reasonable approximation at low temperatures but fails at higher temperatures including the point of phase transition (which occurs at 3125K), given that the harmonic approximation depends on the lack of vibrational amplitude. In this region, the Buckingham potential which describes most of the energy in the lattice, can no longer describe phonon modes adequately. This is due to the fact that the lattice undergoes a displacive transition, where any electrostatic attraction between Mg2+ and O2- ions ceased and as a result, each ion undergoes translation across the system. In reality, many phonons disappear as the system undergoes aperiodic diffusive motion at higher temperatures, costing translational symmetry as the crystal becomes a liquid.[6] Given that for each volume, the harmonic approximation holds true, at higher temperatures, when the equilibrium bond length increases until there is a loss of symmetry and that the atoms cannot be expected to vibrate as it would in the potential well at lower temperatures, leading to large deviations from empirical observations. In a diatomic molecule with a exactly symmetrical potential curve, changes in the vibrational amplitudes are not expected to change the equilibrium bond distance. However, the quasi-harmonic approximation applies perfectly harmonic behaviour across the temperature range, the equilibrium bond length is always shifted according to temperatures. Contrary to this quasi approximation, a perfectly harmonic potential curve would not change the equilibrium bond distance and therefore no thermal expansion occurs.
It is also noteworthy to investigate the effects of phonon-phonon interactions at higher temperatures, when large thermal energies can excite enough phonons in the lattice, which may dominate and lead to disorder observed in the liquid phase.[7]
Molecular Dynamics Simulations
The MD method differs from QH method in regards to the calculation of the free energy (classical approach) and its deterministic nature. According to Planck's law, quantum behaviours are only observable for entities with very low mass (more discrete energy levels; "quantized" transitions as compared to more continuous energy levels in a larger entity). Complement to this, molecular dynamics simulations utilize Newtonian laws to determine the trajectories and final states of the atoms . In the QH method, the system is described by a primitive cell with a single MgO unit, the asymmetric unit. However, the MD method, which operates on the properties of ensembles, require a large system, as per Ergodic hypothesis (the averages of ensembles resemble time averages if the system is large enough). In this simulation, the system is a super cell that is formed by replicating the conventional cell twice across three dimensions. As a consequence, all volume and energy values are obtained using the average value of the last run, which accounts for the last five data sets and is therefore more constant than the previous averages. The MD method is performed using the NPT ensemble (constant total number of molecules, constant pressure and constant temperature) and that the atoms are given an initial position followed by velocities based on the target temperature. Lastly, the initial volume is set equal to 18.6804 Angs3.
First, a number of configurations are defined using initial velocities and positions and subsequently, the forces in each of these configurations act on the atoms to produce trajectories and changes over time. Unlike the QH approximation, no assumptions are made about the mechanisms and processes in the lattice, and therefore realistic conditions apply.
| Temperature (K) | Final Volume using QH Method (Angs3) | Final Volume using MD Method (Angs3) | Percentage Difference
(Volumes of MD Method and QH Method) |
MD
Method: α (10-5 K-1) |
|---|---|---|---|---|
| 0 | 18.836494 | - | - | - |
| 100 | 18.836494 | 18.730104 | 0.57% | 2.660543 |
| 200 | 18.856203 | 18.774729 | 0.43% | 5.048072 |
| 300 | 18.890026 | 18.825749 | 0.26% | 8.575833 |
| 400 | 18.932509 | 18.863297 | 0.37% | 9.785658 |
| 500 | 18.980114 | 18.955000 | 0.13% | 14.69990 |
| 600 | 19.031225 | 19.008621 | 0.12% | 17.56922 |
| 700 | 19.085061 | 19.069855 | 0.08% | 20.85073 |
| 800 | 19.141320 | 19.138501 | 0.01% | 24.52303 |
| 900 | 19.199643 | 19.166523 | 0.17% | 26.02193 |
| 1000 | 19.260052 | 19.207844 | 0.27% | 28.23280 |
Table 4: A summary of volume variations with temperature, calculated using the QH and MD methods.Conversion is required from the volume reported in the MD log files, which described a conventional lattice (there were 64 atoms, and each conventional lattice fits 8, and therefore 8 conventional cells being sampled, meaning 8x4 = 32 primitive cells in the MD method). 0K produces no data given that there is zero kinetic energy within the system at that condition.
| Temperature (K) | QH Method:
α (10-6 K-1) |
MD
Method: α (10-5 K-1) |
Literature
α (10-6 K) |
|---|---|---|---|
| 100 | 0.0000 | 2.66080 | 2.1000 |
| 200 | 10.460011 | 5.048070 | 7.3900 |
| 300 | 17.956096 | 8.575833 | 10.400 |
Table 5: Comparison between the literature, QH method and MD method derived thermal expansion coefficient.
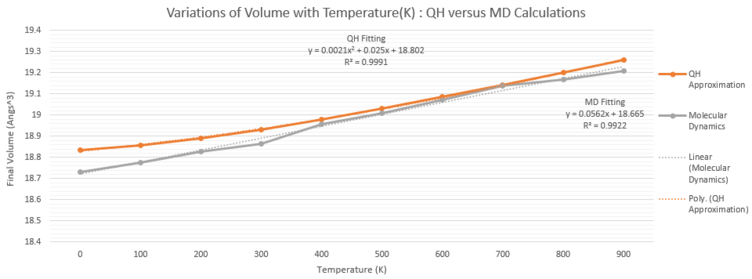
MD Method's and QH Approximation's Results
The free energies of both methods are expected to show opposite relationships with temperature, as QH method utilizes Helmholtz Free Energy, which decreases as the entropic term becomes larger, while the MD method employs the equipartition theorem and that the free energy is equal to 3/2 KBT. The free energy represented in the MD method represents the average contributions from rotational, translational and vibrational freedoms of the atoms within the system. A polynomial fitting of 2nd order fits the QH approximation closely, with R2 value close to 0.99, and in contrast, the MD simulation closely mirrors linear relationship between lattice volume with temperature, with R2 value equal to 0.92. The differences in trends are the result of linear dependence of temperature in the MD model, owing to the equipartition theorem. From the plots, it is also evident that the rate of volume increase is greater for the MD simulation.
In general, both methods have only slight variation in volume for every temperature value, as the percentage differences does not exceed 1% between both sets of data shown on Table 4. In addition, the two curves exhibit linear behaviors, as evidenced by R2 values of the linear fit equal to 0.99. A clear distinction is that the QH method yields consistently higher volume at lower temperatures from 100 K to 600 K. The thermal expansion predicted by the MD method is significantly larger than that of the QH method, with percentage difference ranging from 60% to 90% across the temperature range. This is due to the fact that the QH approximation assumes perfectly harmonic potential at every temperature range, so that while the equilibrium interatomic bond distance increases with temperature. Additionally, it does not consider additional anharmonic effects such as phonon-phonon interactions, which may contribute to volume expansion between MgO units. On the other hand, the MD method observes the entire atomic entities and does not include any limiting approximations, leading to steeper volume increments.
A potential source of error in the MD method may be the mismatch of time allotted to the simulation with the kinetics of the process. If the potential energy surface contains high energetic barriers, then the amount of time required for the system to reach different states is larger (this is described by the Arrhenius equation). As a result, at higher temperatures and time, more weightings are assigned to the most stable states in the averaging process. Furthermore, as the MD simulation runs, it is essential that the temperature becomes adequately stable around the set temperature, such that the equations of motions can be integrated accurately using ~1 femtosecond.
At low temperatures, the differences in the volume between the QH and MD methods result from the fact that zero-point energy is included in QH calculations. Furthermore, the equilibrium lattice distances were shown to be increased by the inclusion of zero-point energy.[8] This explains the small percentage difference in the volumes from both methods as shown on table 4. As temperature increases, the quantum-mechanical zero-point energy has smaller dominance and therefore the two methods results in smaller percentage difference Unlike quasi-harmonic approximation, the MD method is a classical calculation looking at the translational, rotational and vibrational energies of the entire MgO instead of the internuclear bond vibrations.
At high temperatures, the cell volume is expected to increase for both QH and MD method. Furthermore, at the phase transition, a point of discontinuity is expected in volume. However, this effect is expected to be absent from both calculations, as the two calculations have limiting constraints. For the MD method, this can be attributed to the deficiency in the current system size, while the QH approximation fails at this region due to the assumption that harmonicity for at all temperatures.
Volume expansion in the MD method displays phonon-phonon interactions as well as electron-phonon interactions, as molecular dynamics simulation does not include any assumptions about the system. Given that phonons represent a discrete unit of vibrational mechanical energy, increasing heat in the system results in a greater population of phonons in the system, which results in greater instances of phonon-phonon couplings. Similarly, in the case of low temperatures, phonons are not excited thermally and that electron/phonon interactions occur to quench some of the vibration modes. As a result, the volumes given across the temperature range from the MD method is consistently smaller than those of the QH method.
Discussion of MD Method Parameters
MD method results in a large margin of error in the thermal expansion coefficients as compared to the QH method. As discussed, the total time allotted for the simulation is a factor in determining the accuracy, along with the time step, equilibration steps, production steps, sampling steps, trajectory write steps and the system size. In particular, the time step chosen (1 femtosecond) must be small enough to capture the fastest vibrational frequency of the system so that stable dynamics can be executed.[8] Referring back to the dispersion curve, the fastest vibrational frequency is 898.74 cm-1 , which is equivalent to 3.708896 x 10⁻¹⁰ seconds; and as a result, the time step can be confirmed to be sufficiently small to sample the frequencies in the lattice. If a large time step is used, then possible integration errors may occur due to distortion in lattice structures.[8]
The effect of system size also impact the accuracy of the MD simulation, given that the volume fluctuates about an average value following the Gaussian distribution. In addition, the width of the distribution (and hence variations about the average) decreases with increasing system size, ~1/√N. Given that the MD model results in fluctuating thermodynamic values as a result of averaging, a large system size is required for reliable statistical average. Comparing with the QH approximation, the optimization process involves increasing the grid size to sample more points in order to gain a more complete density of states distribution so that the sum of vibrational modes is comprehensive. As stated at the beginning, the degrees of freedom are important for MD method calculations, and as a consequence, increased number of cells would result in a more statistically reliable ensemble average.
From the results above, the QH method is shown to have a smaller margin of error, and therefore it can be assumed that the sample population is sufficiently large. Ruling out the other variables involved in the MD method, the system size can be assumed to be a source of error, as the current MD simulation only involves 64 cells. This is exceedingly smaller than the optimal grid size in the QH method, which samples across 16x16x16 grid size.
Improvements to the MD Method
The free energy calculation was done on an optimal 16x16x16 grid size using the quasi-harmonic approximation. This is the equivalent to sampling across 163 cells in the real space via Fourier transform. In the QH method, each cell is a primitive cell containing two atoms. As a result, converting this to conventional cells, 1024 cells required for the MD method to produce an accurate Free Energy. Given that the MD method focuses on the movements of atoms, increasing the system size can improve the degrees of freedoms for the atoms, which would improve how closely the simulation mirrors reality. The lack of sufficient system size can manifest in large deviations from reality, some of which included the missing 'discontinuity' in the phase transition curve for MgO. In addition, the MD method faces additional limitation in obtaining information at phase transitions, due to hysteresis[10], as the temperature and pressure in the simulation will differ from the bulk system, which again emphasizes the need to maximize the size of samples. In regards to the time step, if molecular dynamics simulation of MD can account for the biggest time step affordable for a stable lattice dynamics, then the accuracy will be maximized given longer sampling time.[9]
Conclusions
Calculations are performed on a MgO lattice using the QH approximation and MD method, in which thermodynamic properties are sampled on an unit cell basis. To determine thermodynamic properties in the QH approximation, the GULP program is used, which first optimised the structure and evaluate phonon frequencies across all k vectors within the Brillouin zone (the volume of which depends on the shrinking factor). GULP then produces a dispersion curve with phonon density of states; the free energy is then calculated by integrating across the Brillouin zone. In order to determine that subsequent calculations are accurate, the minimum grid size that converges to behaviours at infinite grid size must be defined (also as a compromise between accuracy and CPU accuracy). This is achieved by first observing the DOS curves of grid sizes ranging from 2x2x2 to 20x20x20, from which the 16x16x16 grid size exhibits complete features as compared to the largest grid size. This is confirmed quantitatively again with the free-energy minimization process, as 16x16x16 yield a free energy accurate to 10-8 eV with energy value of -40.926482 eV.
Additional research was done on investigating the relationships between the complexity of lattice structures and the density of grid size required for accurate QH approximation. Larger unit cells with lower symmetry would result in a smaller Brillouin zone in the reciprocal space, and as a result, requires lesser dense grid to sample all the optical and acoustic modes. In addition, smaller unit cells with higher symmetry would have many degenerate modes, from which a comprehensive sampling is required to derive the accurate weightings.
In the QH method, the thermal expansion coefficients are calculated in intervals of 100K, justified by the assumption that 100K is an interval small enough to illustrate linearity. As temperature increases, the thermal expansion increases exponentially, following the 2nd order polynomial closely (R2 value equal to 0.99). The MD method yields volumes lower than those of the QH method, with relatively similar values as the largest percentage difference is smaller than 0.6%. Yet, the rate of change in the volumes from the MD method is larger by a factor of 10, as compared to the QH approximation. Differences in the volume between the two methods can be attributed to how each calculation define the free energy. QH approximation sums vibrational modes across the Brillouin zone and therefore accounts for quantum effects by including the zero-point energy in Helmholtz Free Energy. However, the MD method employs equipartition theorem to sum kinetic contributions from rotations, translations and vibrations; all of which will cause the free energy to increase when temperature increase, as E = 3/2KBT. In summary, while the plots of volume expansion derived from QH approximation and MD simulation shows convergence, the reality is that the plots are intersecting instead in this exercise. The curve shapes of MD has greater linearity and focuses on the classical laws, while the curve of QH approximation is polynomial as it accounts for quantum effects; due to this, it is possible to scale MD simulations to model thermal expansion at higher temperatures (at the expense of more CPU time).
Both methods have its flaws in determining the thermal expansion with satisfactory accuracy. Molecular dynamics face limitations at lower temperatures, due to the small time scale (500 femtoseconds) and lack of thermal energies to match the progress’s kinetics. Within the same temperature range, the QH approximation is a reasonable approximation due to lack of extensive anharmonicity to distort interatomic bond distances. With current constraints in the simulation, both methods are unable to reproduce the expected phase transition behaviour given the system size limitation in molecular dynamics while QH approximation underestimates anharmonicity. Recommendable improvements to the molecular dynamics simulation requires fulfilling the Ergodic hypothesis, which can be realized through a) increasing the number of conventional unit cells being sampled and b) increasing the time scale of the simulation by increasing the number of time-runs. Furthermore, more advanced simulations could be developed to investigate the extent of phonon-phonon interactions (the detection of which cannot be done on MD simulation due to quantum effects, as well as QH approximation as it assumed no interactions between elementary particles), as this may allow simulated thermal expansions to closely match those of empirical results.
References
== References ==
- ↑ C.Y Ho, R.E Taylor, Thermal Expansion of Solids, ASM International, 1998, 48-50
- ↑ Julian D, Gale, J. chem. Soc Faraday Trans, 1997, 93, 629-637
- ↑ Timothy S. Bush, Julian D. Gale, C. Richard A. Catlow and Peter D. Battle, J. Mater. Chem., 1994,4, 831-837
- ↑ Julian D. Gale, J. Chem. Soc., Faraday Trans., 1997,93, 629-637
- ↑ Il Nuovo Cimento D, August 1990, Volume 12, Issue 8, pp 1061-1078
- ↑ Madelung O, Rossler U, Schulz M, editors. Magnesium oxide (MgO) Young’s, shear and bulk moduli, Poisson’s ratio, vols. III/17B-22A- 41B. Springer Materials—The Landolt-Bornstein, Database. doi: http://dx.doi.org/10.1007/1081719_210
- ↑ M. Kaviany, Heat Transfer Physics, Cambridge University Press, Edition 1, 2008, 133-136
- ↑ 8.0 8.1 8.2 J.I Choe and B. Kim, Bull. Korean Chem. Soc, 2000, 21, 419-424
- ↑ J.I Choe and B. Kim, Bull. Korean Chem. Soc, 2000, 21, 419-424


