Rep:Mod:AGB1993
Third Year Computational Chemistry Lab: Bonding and Molecular Orbitals in Main Group Compounds
Day 1
BH3 Optimization
Summary:
| File Type: .log |
| Calculation type: FOPT |
| Calculation Method: RB3LYP |
| Basis Set: 3-21G |
| Final Energy: -26.462263 a.u. |
| Gradient: 0.00020672 a.u. |
| Dipole Moment: 0.00 Debye |
| Point Group: D3h |
| Calculation Time: 15 seconds |
Converged Forces
        Item               Value     Threshold  Converged?
Maximum Force            0.000413     0.000450     YES
RMS     Force            0.000271     0.000300     YES
Maximum Displacement     0.001610     0.001800     YES
RMS     Displacement     0.001054     0.001200     YES
A Better Basis Set: 6-31G(d,p)
Summary:
| File Type: .log |
| Calculation type: FOPT |
| Calculation Method: RB3LYP |
| Basis Set: 6-31G(d,p) |
| Charge: 0 |
| Spin: Singlet |
| Final Energy: -26.615324 a.u. |
| RMS Gradient Norm: 0.00000235 a.u. |
| Dipole Moment: 0.00 Debye |
| Point Group: D3h |
| Calculation Time: 4.0 seconds |
Converged Forces
        Item               Value     Threshold  Converged?
Maximum Force            0.000005     0.000450     YES
RMS     Force            0.000003     0.000300     YES
Maximum Displacement     0.000019     0.001800     YES
RMS     Displacement     0.000012     0.001200     YES
Optimised B-H bond distance and Optimised H-B-H bond angle
B-H bond distance: 1.19 Angstrom
H-B-H bond angle: 30.0 Degrees
Comparison of Total Energies for Both Basis Sets
Total Energy (3-21G): -26.462263 a.u.
Total Energy (6-31G(d,p)): -26.615324 a.u.
Day 2
GaBr3 Optimisation
https://spectradspace.lib.imperial.ac.uk:8443/dspace/handle/10042/25215
Summary:
| File Type: .log |
| Calculation Type: FOPT |
| Calculation Method: RB3LYP |
| Basis Set: LANL2DZ |
| Charge: 0 |
| Spin: Singlet |
| Final Energy: -41.700828 a.u. |
| RMS Gradient Norm: 0.00000016 a.u. |
| Dipole Moment: 0.00 Debye |
| Point Group: D3h |
| Calculation Time: 11.6 seconds |
Converged Forces
| Item | Value | Threshold | Converged? |
|---|---|---|---|
| Maximum Force | 0.000000 | 0.000450 | YES |
| RMS Force | 0.000000 | 0.000300 | YES |
| Maximum Displacement | 0.000003 | 0.001800 | YES |
| RMS Displacement | 0.000002 | 0.001200 | YES |
Optimised Ga-Br Bond Distance and Br-Ga-Br Bond Angle
Optimised Ga-Br bond distance: 2.35 angstroms
Optimised Br-Ga-Br bond angle: 30.0 degrees
Comparison of Optimised Ga-Br Bond Distance to Literature
If we compare the obtained Ga-Br bond distance, 2.35 Å, to the literature value of 2.3525 Angstroms[1] we can see that the value obtained computationally is not unreasonable.
Combining Basis Sets and Pseudo Potentials: BBr3 Optimisation
https://spectradspace.lib.imperial.ac.uk:8443/dspace/handle/10042/25228
Summary:
| File Type: .log |
| Calculation Type: FOPT |
| Calculation Method: RB3LYP |
| Basis Set: GEN |
| Charge: 0 |
| Spin: Singlet |
| Final Energy: -64.436453 a.u. |
| RMS Gradient Norm: 0.00000382 a.u. |
| Dipole Moment: 0.00 Debye |
| Point Group: D3h |
| Calculation Time: 17.0 seconds |
Converged Forces
| Item | Value | Threshold | Converged? |
|---|---|---|---|
| Maximum Force | 0.000008 | 0.000450 | YES |
| RMS Force | 0.000005 | 0.000300 | YES |
| Maximum Displacement | 0.000036 | 0.001800 | YES |
| RMS Displacement | 0.000023 | 0.001200 | YES |
Optimised B-Br Bond Distance and Br-B-Br Angle
Optimised B-Br bond distance: 1.93 Angstroms
Optimised Br-B-Br bond angle: 30.0 Degrees
Comparing the Bond Distances for BH3, BBr3 and GaBr3
| Optimised Bond Distance (Å) | |
|---|---|
| BH3 | 1.19 |
| BBr3 | 1.93 |
| GaBr3 | 2.35 |
- For BH3 and BBr3, both central elements are the same, but the ligands change and the bond lengths are 1.19 Å and 1.93 Å respectively. The B-Br bond length is significantly lengthened and is almost double that of the B-H bond length.
- Even though the difference in electronegativity between the boron and bromine atoms is larger than that of the boron and hydrogen atoms, the bromine atom is much larger than the hydrogen atom. This means that the internuclear distance for boron and bromine is much larger than for boron and hydrogen, leading to a longer B-Br bond. So, the size of the ligand, and not the electronegativity difference is the overriding factor.
- On changing the central element from boron to gallium, we see an increase in bond length, by comparing the B-Br (1.19 Å) bond length and Ga-Br (2.35Å) bond length.
- This is again due to the size, which overrides the effects of electronegativity. Gallium and boron are both in group 3 of the periodic table and both have fairly similar electronegativities. However, gallium is a significantly larger atom than boron and this increases the internuclear distance thereby increasing the bond length of Ga-Br compared to B-Br.
Questions
In some structures gaussview does not draw in the bonds where we expect, does this mean there is no bond? Why?
Gaussview has a certain set of criteria that decides whether two atoms are bonded by defining a specific bond lenth, over which the two atoms are not bonded. This does not therefore necessarily mean there is no bond, it just means that the bond may be weakened or stretched.
What is a bond?
A bond is an electrostatic attraction between two opposite charges, the charges being either electrons and nuclei or coming from a dipole. There are two main types of bond: covalent and ionic. In a covalent bond, the electrons are shared between the two atoms and in an ionic bond one atom accepts or donates electrons valence electrons to/from the other atom.
The maximum attraction between two atoms can be defined by the sum of the van der Waals radii for the two atoms concerned. If the distance between the two atoms is shorter than the sum of the van der Waals radii, the forces can become repulsive, and if the distance becomes much longer then the bond will eventually dissociate and there will be no attractive forces between the two atoms.
Day 3
Frequency Analysis of BH3
Summary:
| File Type: .log |
| Calculation Type: FREQ |
| Calculation Method: RB3LYP |
| Basis Set: 6-31G(d,p) |
| Charge: 0 |
| Spin: Singlet |
| Final Energy: -26.615324 a.u. |
| RMS Gradient Norm: 0.00000237 a.u. |
| Dipole Moment: 0.00 Debye |
| Point Group: D3h |
| Calculation Time: 13.0 seconds |
Low Frequencies
| Low Frequencies | -0.9033 | -0.7343 | -0.0054 | -6.7375 | 12.2491 | 12.2824 |
| Low Frequencies | 1163 | 1213 | 1213 | 2582 | 2715 | 2715 |
IR Spectrum of BH3

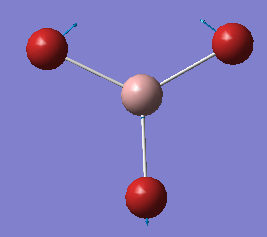
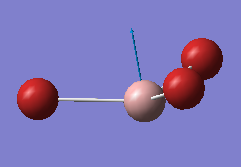
Why are there less than six peaks in the spectrum, when there are obviously six vibrations?
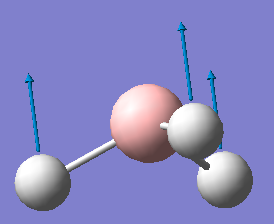
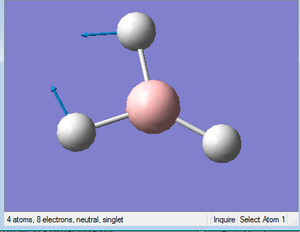
- Vibration number 4 has an intensity of zero meaning that the peak will not show up in the spectrum. This is because the vibration is not IR-active since there is no change in the dipole moment as it vibrates.
- Vibrations 2 and 3 have very similar intensities, the same vibrational frequencies and degenerate symmetry groups meaning that the two vibrations merge into one signal.
- Vibrations 5 and 6 have the same vibrational frequencies, very similar intensities and degenerate symmetry groups meaning that the two vibrations merge into one signal.
- This leaves vibration 1 which has a different symmetry group to the rest of the vibrations, a different frequency and a different intensity meaning it gives rise to its own single peak.
- This all adds up to 3 peaks in total.
GaBr3 Frequency Analysis
https://spectradspace.lib.imperial.ac.uk:8443/dspace/handle/10042/25314
Summary:
| File Type: .log |
| Calculation Type: FREQ |
| Calculation Method: RB3LYP |
| Basis Set: LANL2DZ |
| Charge: 0 |
| Spin: Singlet |
| Final Energy: -41.700828 a.u. |
| RMS Gradient Norm: 0.00000011 a.u. |
| Dipole Moment: 0.00 Debye |
| Point Group: D3h |
| Calculation Time: 10.4 seconds |
Low Frequencies
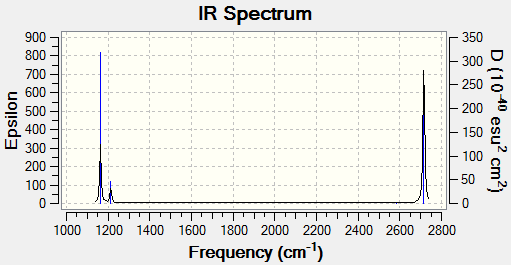
Low frequencies --- -0.5252, -0.5247, -0.0024, -0.0010, 0.0235, 1.2010
Low frequencies --- 76, 76, 100, 197, 316, 316
Lowest Real Normal Mode: 76
IR Spectrum of GaBr3
Comparing the Frequencies
Table of Frequencies For GaBr3 and BH3:
| Molecule | 1 | 2 | 3 | 4 | 5 | 6 |
|---|---|---|---|---|---|---|
| GaBr3 | 76 | 76 | 100 | 197 | 316 | 316 |
| BH3 | 1163 | 1213 | 1213 | 2582 | 2715 | 2715 |
What does the large difference in the value of the frequencies for BH3 compared to GaBr3 indicate?
This indicates the difference in size of the atoms between the two molecules, since vibrational frequency depends on the reduced mass from the equation:

Since it is an inverse relationship, the vibrational frequencies of GaBr3 are smaller, since the ligands and central element are much heavier than for BH3.[2]
Has there been a reordering of modes?
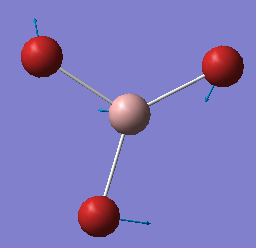
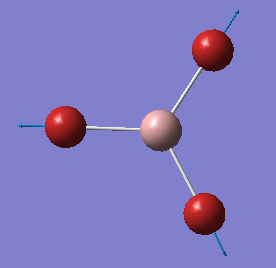
Yes there has been a reordering of modes since the A2" mode has been reordered from the first mode in BH3 to the 3rd mode in GaBr3 which also results in a reordering of the first two E' modes.
How are these spectra similar?
They both have 3 visible peaks.
For both spectra two modes lie fairly closely together, the A2 and E' modes and then the other two modes also lie fairly close together, the A1' and E' modes, but higher in energy. Why is this?
The A2 and E' modes are both bending modes and therefore, for both spectra, the vibrational frequencies for these symmetry groups are similar. The A1' and E' modes are both stretching modes and for both spectra these frequencies are therefore similar. The A1' and E' modes are higher in energy because stretching vibrations generally require more energy than bending vibrations and therefore result in higher frequencies for the A1' and E' modes compared to the A2 and E' modes.
Why must you use the same method and basis set for both the optimisation and frequency analysis calculations?
To ensure that the final energies are the same and therefore that we are dealing with two of the same structures.
What is the purpose of carrying out a frequency analysis?
To ensure that our structures are indeed minimums.
What do the "Low frequencies" represent?
The first low frequencies row represents the motions of the center of mass of the molecule. These are much smaller than the second row which lists the vibrations of the molecule corresponding to each symmetry group.
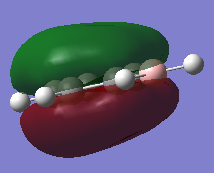
Molecular Orbitals of BH3
https://spectradspace.lib.imperial.ac.uk:8443/dspace/handle/10042/25322
Summary:
| File Type:.chk |
| Calculation Type: SP |
| Calculation Method: RB3LYP |
| Basis Set: 6-31G(D,P) |
| Charge: 0 |
| Spin: Singlet |
| Final Energy: -26.615324 a.u. |
| RMS Gradient Norm: 0.000 a.u. |
| Dipole Moment: 0.00 Debye |
Molecular Orbital Diagram of BH3
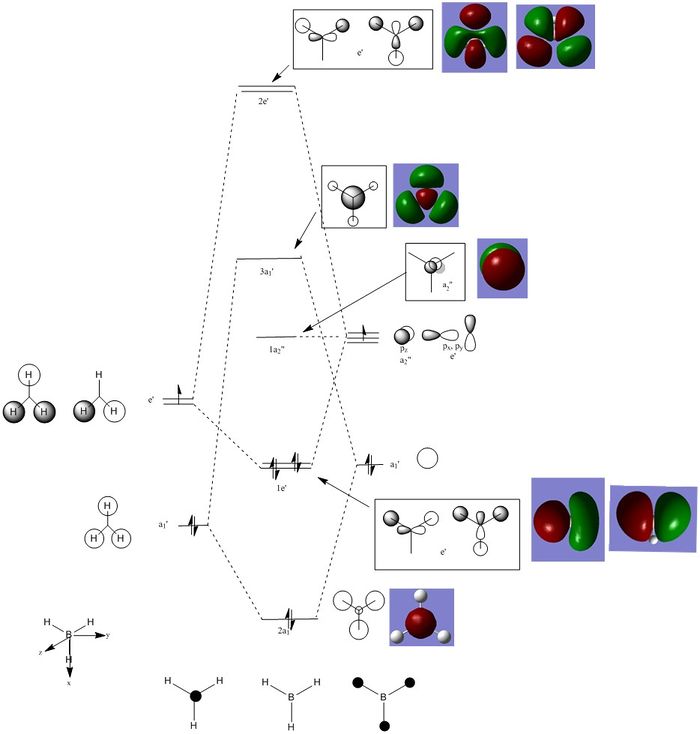
Are there any significant differences between the real and LCAO MOs?
- The s-p overlap in the LCAO compared to the real MOs is different, with the real MO showing the s and p orbitals joined into one new molecular orbital.
- For the 2a1 level, the LCAO shows the s orbitals on the hydrogens and boron to be separate, whereas the real MO shows the completely bonded s orbitals of the hydrogens and boron as one fully bonding MO that is centered at the boron atom.
What does this say about the accuracy and usefulness of qualitative MO theory?
It is very useful as a starting point, however, knowledge of how atomic orbitals interact with each other and form new molecular orbitals is necessary to be able to fully analyse the molecular orbitals of a particular molecule.
NH3 Optimisation
Summary:
| File Type: .log |
| Calculation Type: FOPT |
| Calculation Method: RB3LYP |
| Basis Set: 6-31G(d,p) |
| Charge: 0 |
| Spin: Singlet |
| Final Energy: -56.557769 a.u. |
| RMS Gradient Norm: 0.00000885 a.u. |
| Dipole Moment: 1.85 Debye |
| Point Group: C1 |
| Calculation Time: 10.0 seconds. |
N.B. Even though the point group in the summary says C1, the real point group for NH3 is C3v.
Converged Forces
| Item | Value | Threshold | Converged? |
|---|---|---|---|
| Maximum Force | 0.000024 | 0.000450 | YES |
| RMS Force | 0.000012 | 0.000300 | YES |
| Maximum Displacement | 0.000079 | 0.001800 | YES |
| RMS Displacement | 0.000053 | 0.001200 | YES |
Optimised Bond Distances and Angles
Optimised N-H Bond Distance = 1.02 Angstroms
Optimised H-N-H Bond Angle = 37.1 Degrees
NH3 Frequency Analysis
Summary of further optimisation of NH3 before frequency analysis using keyword: int=ultrafine scf=conver=9
Summary:
| File Type: .log |
| Calculation Type: FOPT |
| Calculation Method: RB3LYP |
| Basis Set: 6-31G(d,p) |
| Charge: 0 |
| Spin: Singlet |
| Final Energy: -56.557769 a.u. |
| RMS Gradient Norm: 0.00000815 a.u. |
| Dipole Moment: 1.85 Debye |
| Point Group: C1 |
| Calculation Time: 6.0 seconds. |
Proof of Convergence
| Item | Value | Threshold | Converged? |
|---|---|---|---|
| Maximum Force | 0.000003 | 0.000450 | YES |
| RMS Force | 0.000001 | 0.000300 | YES |
| Maximum Displacement | 0.000007 | 0.001800 | YES |
| RMS Displacement | 0.000003 | 0.001200 | YES |
Link to Frequency Calculation:
Summary of Frequency Calculation:
| File Type: .log |
| Calculation Type: FREQ |
| Calculation Method: RB3LYP |
| Basis Set: 6-31G(d,p) |
| Charge: 0 |
| Spin: Singlet |
| Final Energy: -56.557769 a.u. |
| RMS Gradient Norm: 0.00000891 a.u. |
| Dipole Moment: 1.84 Debye |
| Point Group: C1 |
| Calculation Time: 8.0 seconds. |
Proof of Minimisation by Low Frequencies
Low frequencies --- -9.2109 -8.1223 -6.2020 0.0006 0.0009 0.0015
Low frequencies --- 1089, 1694, 1694, 3461, 3590, 3590
Molecular Orbitals of NH3
https://spectradspace.lib.imperial.ac.uk:8443/dspace/handle/10042/25340
Summary of MO Analysis
| File Type: .log |
| Calculation Type: SP |
| Calculation Method: RB3LYP |
| Basis Set: 6-31G(d,p) |
| Charge: 0 |
| Spin: Singlet |
| Final Energy: -56.557769 a.u. |
| Dipole Moment: 1.84 Debye |
| Point Group: C1 |
| Calculation Time: 7.5 seconds. |
NH3 NBO Analysis
Charge Distribution
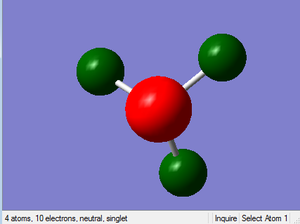
Range: -1.0 to 1.0
Specific NBO charge for nitrogen: -1.125
Specific NBO charge for hydrogen: 0.375
NH3BH3 Optimisation
Link:
Summary:
| File Type: .log |
| Calculation Type: FOPT |
| Calculation Method: UB3LYP |
| Basis Set: 6-31G(d,p) |
| Charge: 0 |
| Spin: Doublet |
| Final Energy: -82.549442 a.u. |
| RMS Gradient Norm: 0.00000051 a.u. |
| Dipole Moment: 5.63 Debye |
| Point Group: C1 |
| Calculation Time: 46.0 seconds. |
Converged Forces:
| Item | Value | Threshold | Converged? |
|---|---|---|---|
| Maximum Force | 0.000002 | 0.000015 | YES |
| RMS Force | 0.000001 | 0.000010 | YES |
| Maximum Displacement | 0.000016 | 0.000060 | YES |
| RMS Displacement | 0.000007 | 0.000040 | YES |
NH3BH3 Frequency Analysis
Link:
Summary:
| File Type: .log |
| Calculation Type: FREQ |
| Calculation Method: UB3LYP |
| Basis Set: 6-31G(d,p) |
| Charge: 0 |
| Spin: Doublet |
| Final Energy: -82.549442 a.u. |
| RMS Gradient Norm: 0.00000054 a.u. |
| Dipole Moment: 5.63 Debye |
| Point Group: C1 |
| Calculation Time: 39.0 seconds. |
Converged Forces:
| Item | Value | Threshold | Converged? |
|---|---|---|---|
| Maximum Force | 0.000002 | 0.000450 | YES |
| RMS Force | 0.000001 | 0.000300 | YES |
| Maximum Displacement | 0.000015 | 0.001800 | YES |
| RMS Displacement | 0.000008 | 0.001200 | YES |
Proof of Minimum by Low Frequencies:
Low frequencies --- -8.8480, 0.0004, 0.0008, 0.0009, 0.2526, 6.4603
Low frequencies --- 239, 594, 651, 686, 877, 1059
Calculation of Association Energies
| Molecule | Final Energy (a.u.) |
|---|---|
| NH3 | -56.557769 |
| BH3 | -26.615324 |
| NH3BH3 | -82.549442 |
Energy Difference:
ΔE=E(NH3BH3)-[E(NH3)+E(BH3)]
= 0.624 a.u.
Dissociation Energy/Bond Energy:
= 1621.49 kJ/mol
Week 2 - Mini Project - Aromaticity
Week 2 - Benzene
Benzene Optimisation (6-31G Basis Set)
Dspace:
https://spectradspace.lib.imperial.ac.uk:8443/dspace/handle/10042/25474
Summary:
| File Type = .log |
| Calculation Type = FOPT |
| Calculation Method = RB3LYP |
| Basis Set = 6-31G(d,p) |
| Charge = 0 |
| Spin = Singlet |
| E(RB3LYP) = -232.258206 a.u. |
| RMS Gradient Norm = 0.00009550 a.u. |
| Dipole Moment = 0.0001 Debye |
| Point Group = C1 |
| Calculation time: 57.4 seconds. |
Item Table:
 Item Value Threshold Converged?
Maximum Force 0.000212 0.000450 YES
RMS Force 0.000085 0.000300 YES
Maximum Displacement 0.000991 0.001800 YES
RMS Displacement 0.000315 0.001200 YES
Benzene Frequency Analysis
Dspace:
https://spectradspace.lib.imperial.ac.uk:8443/dspace/handle/10042/25564
Summary:
| File Type = .log |
| Calculation Type = FREQ |
| Calculation Method = RB3LYP |
| Basis Set = 6-31G(d,p) |
| Charge = 0 |
| Spin = Singlet |
| E(RB3LYP) = -232.258206 a.u. |
| RMS Gradient Norm = 0.00009558 a.u. |
| Dipole Moment = 0.0001 Debye |
| Point Group = C1 |
| Calculation time = 47.6 seconds. |
Converged Forces:
 Item Value Threshold Converged?
Maximum Force 0.000190 0.000450 YES
RMS Force 0.000093 0.000300 YES
Maximum Displacement 0.000971 0.001800 YES
RMS Displacement 0.000372 0.001200 YES
Low Frequencies and no negative frequencies:
Low frequencies --- -15.5056 -14.4335 -13.9326 -0.0007 -0.0003 0.0007
Low frequencies --- 414.0670, 414.1475, 620.9628, 620.9704, 693.0526, 718.3053, 864.1034, 864.1758, 973.6436, 973.7258, 1012.3706, 1017.8803, 1019.9460, 1066.3449, 1066.4246, 1179.2543, 1202.1725, 1202.2788, 1356.0857, 1380.2376, 1524.3490, 1524.4327, 1653.0250, 1653.1537, 3174.3425, 3183.8169, 3183.9959, 3199.4787, 3199.6573, 3210.1520
Spectrum:

Benzene Population Analysis
https://spectradspace.lib.imperial.ac.uk:8443/dspace/handle/10042/25483
Benzene NBO Analysis
Charge Distribution:
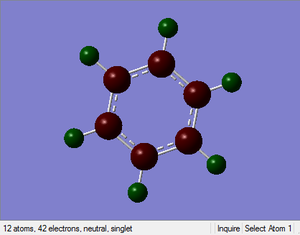
Range: -1.00 to 1.00
Specific NBO Charges:
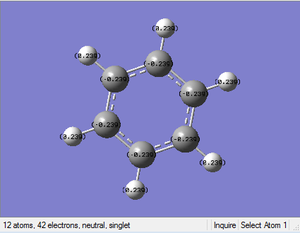
Specific NBO Charge Carbon: -0.239
Specific NBO Charge Hydrogen: +0.239
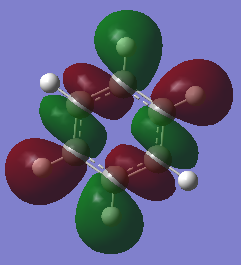
Benzene Molecular Orbital Diagram
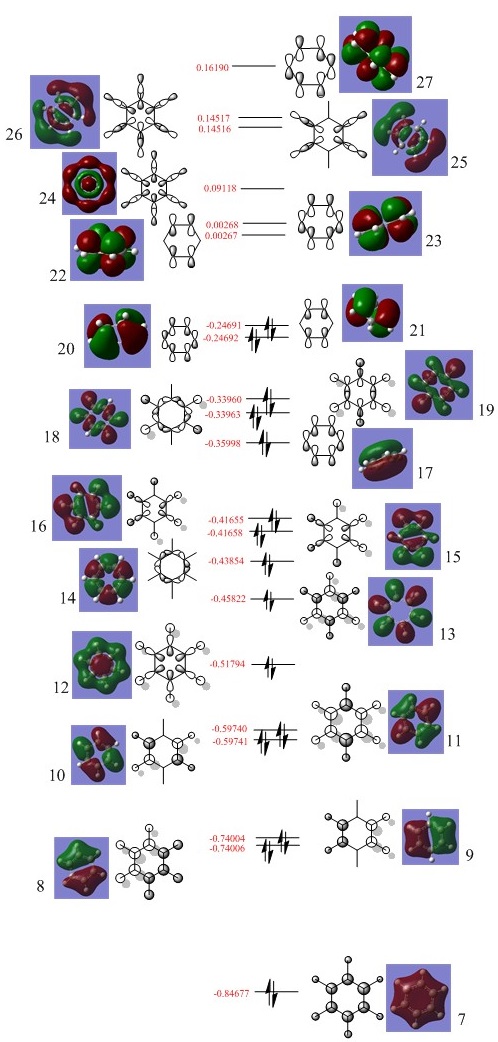
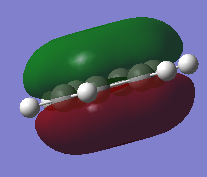
How do these MOs relate to the common conception of aromaticity?
Aromaticity is the idea that, electrons that normally occupy orbitals in pairs, are now delocalised in an electron cloud. In benzene specifically the electrons are delocalised in a cloud above and below the plane of the molecule. LCAO theory shows the electrons occupying very specific locations within s or p orbitals, whereas the MOs computed by Gaussian show a more delocalised and spread out view of the orbitals. In addition, the p orbital overlap that forms a pi bond is difficult to represent using drawn molecular orbitals, but these MOs computed by Gaussian show the pi bonds that form, as the p orbitals lose their typical shape and form a cloud or ring type structure above and below the plane of the molecule. This helps to relate it to the theory of aromaticity.
Week 2 - Boratabenzene
Boratabenzene Optimisation
Dspace:
https://spectradspace.lib.imperial.ac.uk:8443/dspace/handle/10042/25501
Summary:
| File Type = .log |
| Calculation Type = FOPT |
| Calculation Method = RB3LYP |
| Basis Set = 6-31G(d,p) |
| Charge = -1 |
| Spin = Singlet |
| E(RB3LYP) = -219.020530 a.u. |
| RMS Gradient Norm = 0.00015822 a.u. |
| Dipole Moment = 2.8465 Debye |
| Point Group = C1 |
| Calculation time: 28.0 seconds. |
Converged Forces:
 Item Value Threshold Converged?
Maximum Force 0.000159 0.000450 YES
RMS Force 0.000069 0.000300 YES
Maximum Displacement 0.000911 0.001800 YES
RMS Displacement 0.000335 0.001200 YES
Boratabenzene Frequency
Dspace
https://spectradspace.lib.imperial.ac.uk:8443/dspace/handle/10042/25576
Summary
| File Type = .log |
| Calculation Type = FREQ |
| Calculation Method = RB3LYP |
| Basis Set = 6-31G(d,p) |
| Charge = -1 |
| Spin = Singlet |
| E(RB3LYP) = -219.020522 a.u. |
| RMS Gradient Norm = 0.00015676 a.u. |
| Dipole Moment = 2.8467 Debye |
| Point Group = C1 |
| Calculation time: 58.2 seconds. |
Low Frequencies and No Negative Frequencies
Low frequencies --- -6.8488 -0.0001 0.0005 0.0009 3.2602 5.6229
Low frequencies --- 371.2616, 404.4992, 565.1641, 568.3301, 608.0689, 710.7277, 756.6598, 814.9152, 873.5246,906.3515, 917.4298, 950.7178, 951.3335, 960.3054, 1012.1150, 1084.9956, 1175.2468, 1179.7598, 1227.9104, 1333.5285, 1449.2578, 1462.8113, 1564.5869, 1591.5283, 2446.6005, 3027.4802, 3029.5284, 3059.6215, 3060.7453, 3115.0029
Converged Forces
 Item Value Threshold Converged?
Maximum Force 0.000439 0.000450 YES
RMS Force 0.000157 0.000300 YES
Maximum Displacement 0.000855 0.001800 YES
RMS Displacement 0.000392 0.001200 YES
Boratabenzene Population Analysis
Dspace
https://spectradspace.lib.imperial.ac.uk:8443/dspace/handle/10042/25650
Summary:
| File Type = .fch |
| Calculation Type = SP |
| Calculation Method = RB3LYP |
| Basis Set = 6-31G(D,P) |
| Charge = -1 |
| Spin = Singlet |
| Total Energy = -219.020530 a.u. |
| RMS Gradient Norm = 0.00000000 a.u. |
| Dipole Moment = 2.8465 Debye |
Boratabenzene NBO Analysis
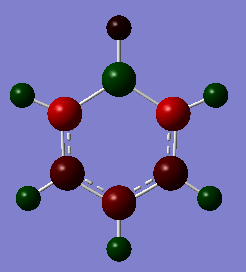
Charge Distribution
Range: -1.00 - 1.00
Specific NBO Charges
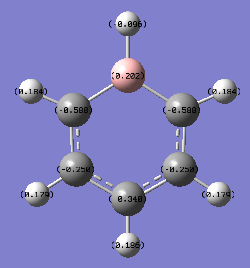
| Atom | Specific NBO Charge |
|---|---|
| Hydrogen para to boron | +0.186 |
| hydrogen meta to boron | +0.179 |
| hydrogen ortho to boron | +0.184 |
| carbon para to boron | -0.340 |
| carbon meta to boron | -0.250 |
| carbon ortho to boron | -0.588 |
| boron | +0.202 |
| hydrogen bonded to boron | -0.096 |
Week 2 - Pyridinium
Pyridinium Optimisation
Dspace
https://spectradspace.lib.imperial.ac.uk:8443/dspace/handle/10042/25657
Summary
| File Type = .log |
| Calculation Type = FOPT |
| Calculation Method = RB3LYP |
| Basis Set = 6-31G(d,p) |
| Charge = 1 |
| Spin = Singlet |
| E(RB3LYP) = -248.668074 a.u. |
| RMS Gradient Norm = 0.00003896 a.u. |
| Dipole Moment = 1.8727 Debye |
| Point Group = C1 |
| Calculation time: 21.2 seconds. |
Converged Forces
 Item Value Threshold Converged?
Maximum Force 0.000064 0.000450 YES
RMS Force 0.000023 0.000300 YES
Maximum Displacement 0.000702 0.001800 YES
RMS Displacement 0.000174 0.001200 YES
Pyridinium Frequency Analysis
Dspace:
https://spectradspace.lib.imperial.ac.uk:8443/dspace/handle/10042/25674
Summary
| File Type = .log |
| Calculation Type = FREQ |
| Calculation Method = RB3LYP |
| Basis Set = 6-31G(d,p) |
| Charge = 1 |
| Spin = Singlet |
| E(RB3LYP) = -248.668061 a.u. |
| RMS Gradient Norm = 0.00003256 a.u. |
| Dipole Moment = 1.8727 Debye |
| Point Group = C1 |
| Calculation time: 36.9 seconds. |
Converged Forces
 Item Value Threshold Converged?
Maximum Force 0.000128 0.000450 YES
RMS Force 0.000033 0.000300 YES
Maximum Displacement 0.000790 0.001800 YES
RMS Displacement 0.000228 0.001200 YES
Low Frequencies and No Negative Frequencies
Low frequencies --- -9.4924, -5.2498, -0.0009, -0.0007, 0.0006, 4.0077
Low frequencies --- 391.9056, 404.3502, 620.1994, 645.1608, 676.7768, 747.7032, 854.2647, 882.7249 991.9079 1005.6392 1022.4651 1047.8035 1052.1362 1082.1541 1087.1614 1199.6044, 1228.7653, 1299.8972, 1374.0760, 1416.0790, 1523.6838, 1580.1828, 1656.6983, 1676.5303, 3223.6622, 3240.2767, 3241.8120, 3252.4512, 3253.8171, 3569.2668
Pyridinium Population Analysis
https://spectradspace.lib.imperial.ac.uk:8443/dspace/handle/10042/25677
Summary:
| File Type = .fch |
| Calculation Type = SP |
| Calculation Method = RB3LYP |
| Basis Set = 6-31G(D,P) |
| Charge = 1 |
| Spin = Singlet |
| Total Energy = -248.668074a.u. |
| RMS Gradient Norm = 0.00000000 a.u. |
| Dipole Moment = 1.8728 Debye |
Pyridinium NBO Analysis
Charge Distribution:

Range: -1.00 to 1.00
Specific NBO Charges:
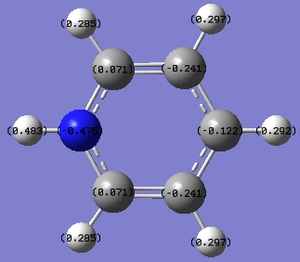
| Atom | Specific NBO Charge |
|---|---|
| hydrogen ortho to nitrogen | +0.285 |
| hydrogen meta to nitrogen | +0.297 |
| hydrogen para to nitrogen | +0.292 |
| carbon ortho to nitrogen | +0.071 |
| carbon meta to nitrogen | -0.241 |
| carbon para to nitrogen | -0.122 |
| nitrogen | -0.476 |
| hydrogen bonded to nitrogen | +0.483 |
Week 2 - Borazine
Borazine Optimisation
Dspace:
https://spectradspace.lib.imperial.ac.uk:8443/dspace/handle/10042/25565
Summary:
| File Type = .log |
| Calculation Type = FOPT |
| Calculation Method = RB3LYP |
| Basis Set = 6-31G(d,p) |
| Charge = 0 |
| Spin = Singlet |
| E(RB3LYP) = -242.684598 a.u. |
| RMS Gradient Norm = 0.00007126 a.u. |
| Dipole Moment = 0.0003 Debye |
| Point Group = C1 |
| Calculation time: 21.2 seconds. |
Converged Forces
Item Value Threshold Converged?
Maximum Force 0.000117 0.000450 YES
RMS Force 0.000036 0.000300 YES
Maximum Displacement 0.000327 0.001800 YES
RMS Displacement 0.000104 0.001200 YES
Borazine Frequency Analysis
Dspace
https://spectradspace.lib.imperial.ac.uk:8443/dspace/handle/10042/25584
Summary
| File Type = .log |
| Calculation Type = FREQ |
| Calculation Method = RB3LYP |
| Basis Set = 6-31G(d,p) |
| Charge = 0 |
| Spin = Singlet |
| E(RB3LYP) = -242.684600 a.u. |
| RMS Gradient Norm = 0.00006962 a.u. |
| Dipole Moment = 0.0002 Debye |
| Point Group = C1 |
| Calculation time: 11 minutes 0.1 seconds. |
Low Frequencies and No Negative Frequencies
Low frequencies --- -3.7898 -0.0004 0.0009 0.0010 0.4352 6.8161
Low frequencies --- 289.6164, 289.6921, 404.1981, 525.0377, 525.0434, 710.0461, 710.1329, 732.3031, 864.4660, 927.4413, 927.4548, 936.8217, 944.4549, 944.5425, 944.9663, 1051.7880, 1080.5904, 1080.6761, 1245.3291, 1314.0322, 1400.0665, 1400.1590, 1492.1887, 1492.2960, 2641.5556, 2641.6181, 2651.5003, 3642.1285, 3643.9256, 3643.9833
Converged Forces
 Item Value Threshold Converged?
Maximum Force 0.000205 0.000450 YES
RMS Force 0.000070 0.000300 YES
Maximum Displacement 0.000369 0.001800 YES
RMS Displacement 0.000133 0.001200 YES
Borazine Population Analysis
https://spectradspace.lib.imperial.ac.uk:8443/dspace/handle/10042/25652
Borazine NBO Analysis
Charge Distribution

Range: -1.00 to 1.00
Specific NBO Charges

| Atom | Specific NBO Charge |
|---|---|
| Nitrogen | -1.102 |
| Boron | +0.747 |
| hydrogen bonded to nitrogen | +0.432 |
| hydrogen bonded to boron | -0.077 |
Week 2 - Comparison of Charge Distributions
| Molecule | 1 | 2 | 3 | 4 | 5 | 6 | 7 | 8 | 9 | 10 | 11 | 12 |
|---|---|---|---|---|---|---|---|---|---|---|---|---|
| Benzene | -0.239 | -0.239 | -0.239 | -0.239 | -0.239 | -0.239 | +0.239 | +0.239 | +0.239 | +0.239 | +0.239 | +0.239 |
| Boratabenzene | +0.202 | -0.588 | -0.250 | -0.340 | -0.250 | -0.588 | -0.096 | +0.184 | +0.179 | +0.186 | +0.179 | +0.184 |
| Pyridinium | -0.476 | +0.071 | -0.241 | -0.122 | -0.241 | +0.071 | +0.483 | +0.285 | +0.297 | +0.292 | +0.297 | +0.285 |
| Borazine | -1.102 | +0.747 | -1.102 | +0.747 | -1.102 | +0.747 | +0.432 | -0.077 | +0.432 | -0.077 | +0.432 | -0.077 |

- The electronegativities of boron, carbon and nitrogen are 2.01, 2.50 and 3.07 respectively[1].
- The benzene framework is made up of only carbons and is negatively charged because carbon is more electronegative than hydrogen.
- If we compare boratabenzene and benzene, the carbons ortho to the boron atom in boratabenzene are more negatively charged than those in benzene because the electron withdrawing effect of boron is not as strong as that of carbon. This makes the whole carbon framework more negatively charged in boratabenzene than in benzene, with the effect being more pronounced in the carbons ortho to the boron and less so in the carbon para to the boron atom. The hydrogen atoms in boratabenzene (excluding the one directly bonded to boron)are more negatively charged than in benzene which is again due to the same effect of the boron atom being less electron withdrawing than carbon, resulting in more electron density on the hydrogens in boratabenzene than in benzene. For the hydrogen atom that is bonded directly to the boron atom, it is much more negatively charged than the corresponding atom in benzene. This is because boron is less electronegative than carbon, leaving more electron density on the hydrogen in boratabenzene. The boron atom itself is more positive than the corresponding carbon atom in benzene because carbon is more electronegative than boron.
- Comparing benzene and pyridinium, the carbon framework of pyridinium is more positive than in benzene because the nitrogen is more electronegative than carbon and withdraws electron density from the carbon framework, making it more positively charged. The carbon framework of pyridinium is also more positively charged than in boratabenzene, because nitrogen is more electronegative than boron. Nitrogen itself is highly negatively charged due to its high electronegativity. The hydrogens are also more positively charged than those in boratabenzene and in benzene, which is again due to the high electronegativity of nitrogen.
- Borazine's framework is made up of both boron and nitrogen. Since nitrogen is more electronegative than boron, the nitrogens are more negatively charged than the boron atoms. The hydrogens bonded to nitrogens are more positively charged than those bonded to boron atoms, since nitrogen withdraws more electron density than boron. The nitrogen atoms in borazine are more negative than the nitrogen atom in pyridinium because, in borazine the nitrogens are bonded to boron atoms, whereas in pyridinium the nitrogen is bonded to two carbon atoms. Since carbon atoms are more electronegative than boron atoms, they withdraw more electron density resulting in a more positive nitrogen atom in pyridinium than in borazine.
Week 2 - Comparison of MOs
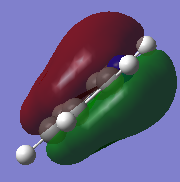
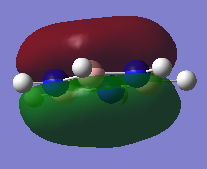
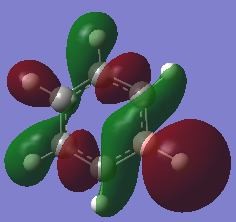
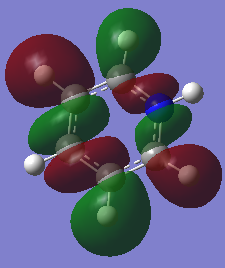
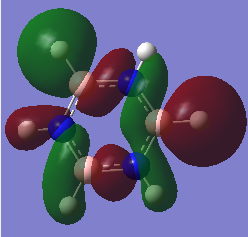
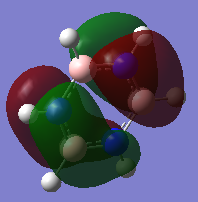
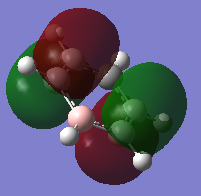
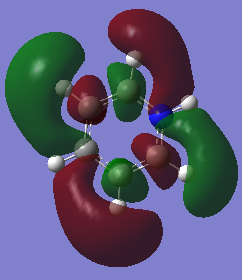
Orbital 17
Orbital 18
Highest Occupied Molecular Orbital
Effect of Substitutions on Full MO Diagram
Boratabenzene
Boratabenzene would have the effect of raising the energies of the MOs in general compared to the benzene MO, since the boron atom substituion makes the energies of the MOs higher because boron is less electronegative than carbon.
Pyridinium
Pyridinium would have the effect lowering the energies of the MOs in general compared to the benzene MO diagram, since nitrogen is more electronegative than carbon.
Borazine
Borazine has boron and nitrogen atoms substituted in place of the carbon framework in benzene. The combined result of the relatively strong electron withdrawing effects of nitrogen atoms and the relatively weak electron withdrawing effects of the boron atoms is that the MO diagram is similar to that of benzene, with regards to the MO energies. The LCAO will differ slightly due to the differing atoms, but the energy levels of the MOs produced from the LCAOs will be similar to that of benzene.
- ↑ Zhang, Yonghe, "American Chemical Society, Electronegativities of Elements in Valence States", '1982, 82, 3888.

