Rep:Mod:8892nt208
Module 2 Inorganic: Nicole Trainor
Introduction
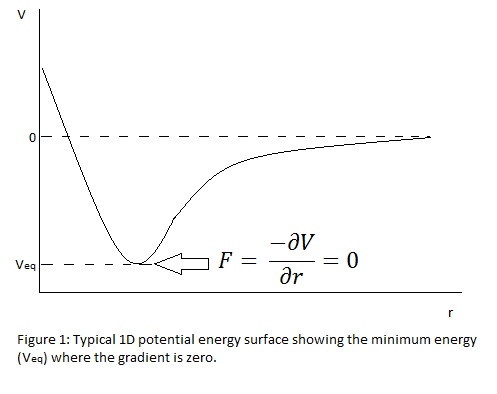
Computational methods of analysis may be applied to a variety of inorganic systems such as small molecules, metal complexes and solid lattices. The results give us insight into the structure, bonding, reactivity and physical properties of these systems to support practical investigations in the laboratory. Before such calculations may be performed, the system parameters must be defined and optimised; for example, the structure is crudely sketched and subjected to density functional calculations which solve Schrodinger's equation for the electronic wavefunctions with fixed nuclei then progressively altering the positions of these nuclei to seek out the minimum energy configuration. The theory is based on the potential energy [V(r)] surface: the minimum energy (most stable state) exists when the forces of the system are at equilibrium. Figure 1 shows this relationship and demonstrates the overall aim of the convergence; each step in the calculation is a change in "r", the nuclear coordinates, along the potential energy surface to the point where the gradient is zero. The model assumes the Born-Oppenheimer approximation in that the nuclei are much larger and so are at rest relative to the speed of electronic movement.
The accuracy of the output relies on the chosen method and minimal basis set. For example, a small molecule consisting of atoms high in the periodic table may only incur small errors for most methods hence a fast, simple method with a small basis set may be sufficient. However it will be seen that for larger atoms, the errors are more important and larger basis sets and more complex quantum mechanical models with longer computing times may be necessary for better accuracy.
After optimisation, a molecule is then ready for further analysis such as frequency, molecular orbital and natural bond orbital calculations: all of which provide deeper understanding of the bonding and reactivity of a compound.
The Optimisation of BH3
A trigonal planar molecule of BH3 was created and each bond length was set to 1.5 Å. Using the B3LYP method and the 3-21G basis set, this was optimised to a structure with all bond angles at 120o and all B-H lengths at 1.19435 Å. A summary of the results is given below in figures 2 and 3. The log file can be accessed at: DOI:10042/to-6528 .
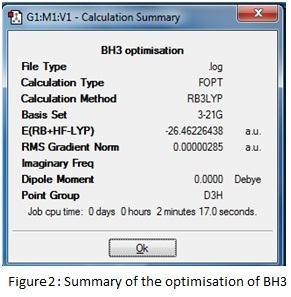
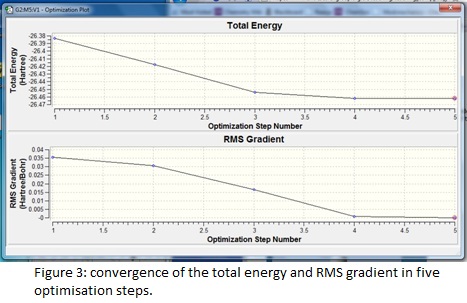
The summary reveals information about the molecule such as the dipole moment and point group as well as recording the details of the calculation; the short time taken reflects the simplicity of the chosen model and the RMS (root mean squared) gradient is much less than 0.001, which indicates the high level of accuracy achieved. The success and speed of the convergence is displayed in the graphs; only five steps were required to find the smallest gradient. This coincides with progressive contraction of the bond lengths which may be illustrated using snapshot images of each step in the calculation- in fact at 1.5 Å, the model cannot detect any bonding interactions between the boron and hydrogen atoms.
Molecular Orbitals of BH3
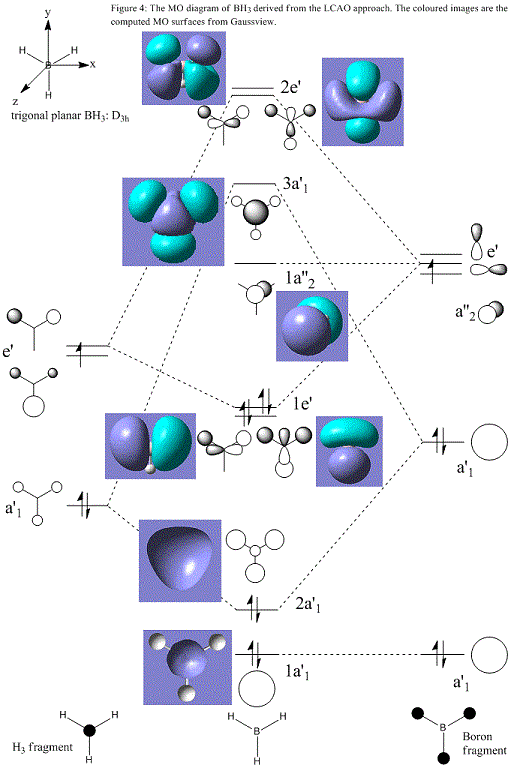
Using the optimised structure, it is possible to estimate the shapes and energies of the molecular orbitals of BH3. Below is the molecular orbital diagram based on the linear combination of boron atomic orbitals and the tri-hydrogen fragment.
Output (see checkpoint file) for the MO analysis: DOI:10042/to-6527
The LCAO method agrees well with the Gaussian calculation in that all of the MOs can be identified by matching regions of positive and negative phase and the positions of the nodes are in concordance. Most importantly, the HOMO can be seen clearly in both cases as one of two degenerate e' bonding orbitals and the LUMO is the empty non-bonding pz orbital. Two comparisons may be drawn between the two approaches: qualitatively the final computed MOs convey an appearance of higher delocalisation whereas in the simpler diagrams this must be imagined as the constructive overlap of in-phase atomic orbitals. Furthermore, the LCAO method requires further calculations in order to accurately predict the relative coefficients of each atomic orbital (i.e. the magnitude of their contribution) in the final MOs. This is exemplified in the more diffuse appearance of the unoccupied computed MOs in relation to the occupied orbitals; LCAO could no predict this. Quantitatively, it is also difficult to rationalise the relative energies and the size of the orbital splitting of the LCAO results; the diagram above shows the anti-bonding 3a'1 orbital to be lower in energy than the anti-bonding 2e' whereas the computational results report 3a'1 to be higher. In addition, numerical evidence of the orbital energies provides a more convincing argument for the lack of interaction of the low-lying boron 1s atomic orbital shown at the bottom of the diagram as non-bonding. This demonstrates that it is useful to sketch an MO diagram such as the one above in order to better understand the formation of the final MOs and as a general reference point but for greater accuracy and quantitative analysis, computational methods must be applied.
Natural Bond Orbitals of BH3

Natural Bond Orbitals are the intermediate of atomic and molecular orbital representations: they may help us to understand the partition of electron density between the nuclei of a 2c-2e bond. Figure 5 shows the BH3 molecule with an electron deficient (green) region at boron and electron rich (red) regions at each of the hydrogens. The output file (see corresponding log file of MO analysis above) reports these charges to be +0.33119 and -0.11040 respectively. The results also state that each B-H bond has 44.49% boron and 55.51% hydrogen contributions to the total electron density, which is in agreement with the approximate charge distribution. For the boron centre, this is comprised of 33% s character and 66% p, meaning that boron contributes to bonding via three sp2 hybridised orbitals. Each hydrogen has 100% s character, which is to be expected given that H atoms only have a 1s AO to contribute. Additional information such as the "lone pair" orbital with 100% p character centred on boron correlates well with the MO analysis in the previous section; this is the empty LUMO formed from the non-bonding pz orbital. The NBO analysis also detects the "core" bonding orbital with 100% s character on boron, which corresponds to the low energy boron 1s AO that could not be combined with the hydrogen fragment.
While LCAO may fail to recognise the effects of mixing interactions between MOs of similar energy and symmetry and computing these MOs may fail to explain their origin, NBO analysis makes it easier to identify these constructions. In the Secondary Order Perturbation Theory section of the results for BH3, there were no reports of significant mixing effects however for many other molecules this may be of high importance.
Vibrational Analysis
The optimised BH3 molecule was also subjected to frequency analysis in order to simulate the vibrational modes and IR spectrum as well as to confirm the success of the optimisation. This is necessary because the optimisation only involves finding points on the potential energy surface where the derivative (i.e. the forces) is zero. This could however be a maximum turning point (such as a transition state) and not the desired minimum energy, hence the second derivative must be determined to confirm the nature of the turning point: this is taken into account by frequency analysis. Each vibrational mode has a potential energy surface with the most stable structure at the minimum and so the curvature of the mode must always be positive. Any negative values (as long as they are not associated with errors at frequencies close to zero) must therefore be discarded and the optimisation must be re-visited.
The results of the frequency analysis may be found at: https://wiki.ch.ic.ac.uk/wiki/images/5/5a/NT208_BH3_FREQ.LOG
The total energy was identical to that of the optimisation, which is to be expected given that the same method and basis set were applied. Most importantly, this also means that no changes in the structure have occurred. BH3 like any other molecule has 3N-6 vibrational degrees of freedom where N denotes the number of atoms. The "-6" states appear in the results as modes very close to zero. These are due to motions about the centre of mass of the molecule and their magnitude is subject to inherent errors in the calculation: the better the approximation, the closer to zero these values will be. The largest "low frequency" was 21.5 cm-1; if a more rigorous method than B3LYP had been employed, this value would have been further minimised. Figure 6 shows the computed IR spectrum:
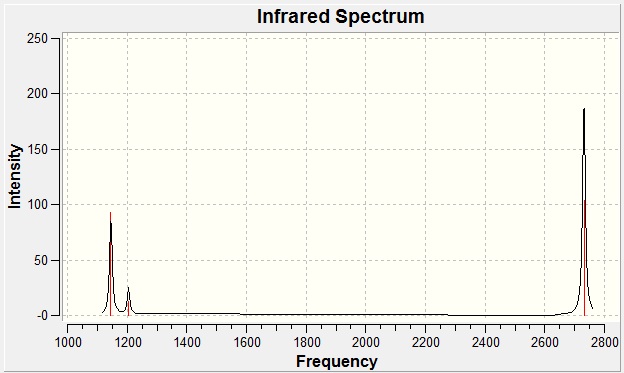 Figure 6
Only three modes are observed and this may be explained using the rules of infrared spectroscopy. For a mode to be "IR active", there must be a change in the dipole moment during the vibrational transition. Hence fully symmetric transitions such as a centrosymmetric bond stretching will be silent and not featured in the spectrum. The table below demonstrates the active modes for BH3
| Wavenumber/cm-1 | 1145.71 | 1204.66 | 1204.66 | 2592.79 | 2731.31 | 2731.31 |
|---|---|---|---|---|---|---|
| Vibration | all bonds stretch and compress simultaneously, boron atom remains stationary | |||||
| Intensity | 92.70 | 12.38 | 12.38 | 0 | 103.84 | 103.83 |
| D3h Symmetry Label | a2 | e' | e' | a1' totally symmetric | e' | e' |
The Optimisation of TlBr3
https://wiki.ch.ic.ac.uk/wiki/images/1/11/TLBR3_OPT_NT208.LOG
