A model of BH3 was constructed using the Gaussview 5 graphical user interface using the trigonal planar boron fragment from the element fragment palette. Each of the B-H bond lengths were extended to 1.5Å. A gaussian input file was prepared, through the Gaussian calculation setup menu, to perform an optimisation, specified by:
# opt b3lyp/3-21g geom=connectivity
The input file was saved as BH3_opt.gjf and submitted to Gaussian.
Once the calculation was complete, the .log file was opened in Gaussview 5 with the read intermediate geometries checkbox ticked. The final set of forces and displacements printed in the output final were checked to ensure the optimisation had converged. A summary of the calculation can be seen in table 1.
Plot of total energyPlot of RMS gradient
Table 1. Summary
BH3 optimisation
File Name
BH3_OPT.out
File Type
.log
Calculation Type
FOPT
Calculation Method
RB3LYP
Basis Set
3-21G
Charge
0
Spin
Singlet
E(RB3LYP)
-26.46226338 a.u.
RMS Gradient Norm
0.00020672 a.u.
Imaginary Freq
-
Dipole Moment
0.0000 Debye
Point Group
D3H
Job cpu time
0 days 0 hours 0 minutes 11.0 seconds.
The path of the optimisation was visualised using the animation, which showed the bond lengths shrinking from the starting structure to the final geometry. Plots of Total energy and RMS gradient norm can be seen below.
The optimisation converged in four steps. Inspection of the optimised geometry revealed B-H bond lengths of 1.19Å (lit. 1.19Å[1]) and H-B-H bond angles of 120.000°.
Frequency analysis
From the B3LYP/3-21G optimised geometry, an input file was prepared, through the Gaussian calculation setup menu to perform a frequency analysis specified by:
The keyword freq[2] requests calculation of the force constants from the second dervatives of the energy. From this, vibrational frequencies and thermochemical corrections may be obtained. Since the second derivative of a function indicates the nature of a stationary point, frequency calculations should only be done on fully optimised geometries, otherwise the results are meaningless. This requires that the same method, including basis set, be used for the optimisation and fequency analysis. If all the force constants and subsequent vibrational frequencies are positive, then the structure has optimised to a minimum. This means that movement along all of the 3N-6 degrees of freedom results in an increase in energy. If there is one negative (or imaginary) frequency, then the structure has optimised to a transition state. This can be thought of as a saddle point on the potential energy surface connecting two local minima, where movement along one degree of freedom results in a decrease in energy but movement in any other degree of freedom sees an increase in energy.
The six low frequencies printed in the output file, shown in table 3, correspond to the three translational and rotational motions of the molecule. They should all be close to zero cm-1 (ideally < 10cm-1[3]) and their magnitude can give an indication of the quality of the optimisation. The rotational frequencies for the B3LYP/3-21G optimised structure are on the large side at around 60cm-1. This is indicative of the low level method used. All of the normal vibrational frequencies are positive, which confirms that the structure has optimised to a minima.
The form and frequency of the normal vibrational modes can be seen in table 4. The vibrations may be visualised using the Jmol applet and Jmol script bottons in the table.
Examination of the predicted IR spectra reveals only three peaks despite there being six vibrational modes. A' is totally symmetric and does not results in a change in dipole moment, unlike the other vibrational modes present for D3h symmetry. This makes the A' stretch at 2598 cm-1 IR inactive, hence why it does not appear on the spectra. The two pairs of E' modes are degenerate, which means each of the component vibrations occur at the same frequency and intensity, appearing as a single peak on the spectra. The outcome is a peak at 1144 cm-1 corresponding to A", a peak at 1204 cm-1 corresponding to the first E' pair and a peak at 2737 cm-1 corresponding to the second E' pair.
For DFT methods, including B3LYP, the default is to calculate second derivatives analytically[2]. This means that the magnitude of the rotational low frequencies may be reduced by specifying tighter optimisation criteria in the input file [3]. For example;
# freq opt=verytight b3lyp/3-21G
Molecular Orbitals
From the formatted checkpoint file of the B3LYP/3-21G optimised structure of BH3, an input file was prepared to perform population analysis, atomic charge assignments and full Natural Bond Orbital analysis, using NBO version 3, specified by:
The calculation was run through Gaussian 09 on the SCAN cluster and took 12.6 seconds. From the formatted checkpoint file, cube files for the first eight molecular orbitals were generated through Gaussview 5.0 and converted to the .jxvl format using the Jmol java app. These can be visualised using the Jmol applet and Jmol script buttons below.
B3LYP/3-21G Molecular Orbitals of BH3
Molecular Orbitals:
The molecular orbital diagram for BH3 can be seen below, constructed from the boron atomic orbitals and the D3h H3 fragment. Snapshots of the B3LYP/3-21G calculated molcecular orbitals can be seen along side the "LCAO" molecular orbitals for comparison. Ordering of the molecular orbitals was assisted by the quantitative relative energies of the B3LYP/3-21G calculated orbitals.
Qualitative molecular orbital theory can be used to gain insight into the relative energies and shapes of molecular orbitals without resorting to quantum mechanical calculations. Comparison of the "LCAO" MOs with the calculated MOs shows that, for simple molecules of high symmetry such as BH3, this qualitative approach gives reasonable predictions.
Natural Bond Orbital analysis
As described above, Natural Bond Orbital analysis, using NBO version 3, was requested on the B3LYP/3-21G optimised geometry of BH3. The full NBO analysis, as printed in the output file, can viewed here.
The NBO charge distribution was visualised using Gaussview 5.0.
The charge distribution shows that there is a build up of electron density on the hydrogens, coupled with a reduction of electron density on the boron. This reflects the Pauling electronegativities of boron and hydrogen at 2.04 and 2.20 respectively.
A model of TlBr3 was constructed in Gaussview 5.0. The trigonal planar thallium fragment was selected and each of the hydrogens were replaced by bromine atom fragments. The point group symmetry was constrained to D3h with a very tight (0.0001) tolerance. A gaussian input file was prepared, through the Gaussian calculation setup menu, to perform an optimisation, specified by: # opt b3lyp/lanl2dz geom=connectivity. The input file was saved as TlBr3_opt.gjf and submitted to Gaussian 09[1].
The final set of forces and displacements printed in the output final were checked to ensure the optimisation had converged. A second input file was prepared, from the output, to perform frequency analysis on the optimised geometry, specified by: # freq b3lyp/lanl2dz. This job was submitted to Gaussian 09 on the SCAN cluster. Summaries of both calculations can be seen in table 6.
Plot of total energyplot of RMS gradient
Table 6. Calculation summaries for optimisation and frequency analysis of TlBr3
Optimisation
Frequency analysis
File Name
TLBR3_OPT
TLBR3_freq_log_57572
File Type
.log
.log
Calculation Type
FOPT
FREQ
Calculation Method
RB3LYP
RB3LYP
Basis Set
LANL2DZ
LANL2DZ
Charge
0
0
Spin
Singlet
Singlet
E(RB3LYP) (a.u.)
-91.21812851
-91.21812851
RMS Gradient Norm (a.u.)
0.0000009
0.00000088
Imaginary Freq
0
Dipole Moment (Debye)
0.0000
0.0000
Point Group
D3H
D3H
Job cpu time (days : hours : minutes : seconds)
0 : 0 : 0 : 15.0
0 : 0 : 0 : 16.9
Plots of total energy and RMS gradient show the optimisation converging in three steps. Inspection of the optimised geometry reveals Tl-Br bond lengths of 2.65Å (lit. 2.52Å in aqueous solution[2]) and Br-Tl-Br bond angles of 120.000°. The 120° bond angles and dipole moment of 0 are as expected for a tigonal planar molecule of D3h symmetry.
The low frequencies printed in the output of the frequency analysis are as follows:
The first six frequencies correspond to the translational and rotational modes of the molecule. As the three rotational modes are often of higher frequency than the translational modes, -0.0026, -0.0004, 0.0015 are most likely translational and -3.4213, 3.9367 and 3.9367 are most likely rotational. These six frequencies are all close to zero (<10cm-1), which is good (compare to the B3LYP/3-21G opt of BH3). The other three frequencies printed in the Low frequencies section are the lowest normal vibrational modes. In this case, the lowest frequency normal vibration is 46.4289cm-1. Negative signs indicate imaginary frequencies. Optimsations that have converged to a minimum will have no imaginary frequencies (ignoring tranlational/rotational modes). A single imaginary frequency means the geometry has optimised to a transitions state.
The calculated vibrational modes can be visualised in the Jmol applet below (table 8). There are no imaginary frequencies, which confirms TlBr3 has optimised to a minimum.
Table 8. Frequencies of TlBr3
Form of vibration
Mode
Description
Frequency
Intensity
Symmetry (D3h point group)
Animation:
46
3.7
E'
46
3.7
E'
52
5.8
A
165
0.0
A'
211
25.5
E'
211
25.5
E'
What is the calculation method?
These calculations use the B3LYP hybid-DFT functional.
What is the basis set?
Why must you use the same method and basis set for both calculations?
Why do you have to carry out a frequency analysis?
In some structures gaussview does not draw in the bonds where we expect, does this mean there is no bond? Why?
What is a bond? (your reply should not be more than a paragraph in length)
An organometallic complex: Isomers of Mo(CO)4(PPh3)2
Fig 4. cis/trans isomers
The transition metal complex, Mo(CO)4(PPh3)2, has two possible isomers. The two triphenylphosphine ligands can either be cis or trans about the molybdenum centre (fig. 4). Which isomer is more stable depends on a number of factors, including electronic and steric effects. Density functional theory calculations shall be used to determine the relative stability and the spectral characteristics of the two isomers.
Optimisation
For efficiency, the computationally demanding tripheylphosphine ligands have been modeled by trichlorophosphine. PCl3 is similar electronically and is also reasonably bulky. Models of cis- and trans- Mo(CO)4(PCl3)2 were constructed in Gaussview 5.0. The computationally demanding tripheylphosphine ligands were modeled by trichlorophosphine for efficiency. As a ligand, PCl3 is similar to PPh3 electronically and is also reasonably bulky. The geometries of the two isomers were initially optimised at the B3LYP/LanL2MB level with loose convergence criteria. This was specified by: # opt=loose b3lyp/lanl2mb geom=connectivity. This low level optimisation was performed to obtain an approximate geometry before optimising to more expensive, higher level of theory. The final set of forces and displacements printed in the output file were checked to ensure the jobs had converged.
Fig 3.
Fig. 4
From the outputs of the B3LYP/LanL2MB optimisations, the dihedral angles of the PCl3 ligands were adjusted to values likely to converge to a global, rather than local, minimum. These angles (Fig. 3 and 4) were obtained from a previously run scan of the potential energy surface[3]. These adjusted geometries were then further optimised at the B3LYP/LanL2DZ level, specified by: # opt b3lyp/lanl2dz int=ultrafine scf=conver=9. The keyword int=ultrafine requests a larger grid for numerical integration. The final set of forces and displacements printed in the output file were checked to ensure the jobs had converged. Frequency analysis was run on the final optimised geometries, specified by: # freq b3lyp/lanl2dz int=ultrafine scf=conver=9.
Calculation summaries for the B3LYP/LanL2DZ level optimisations and corresponding frequency analyses can be seen in table 5.
Table 5. Summary of B3LYP/LanL2DZ calculations on cis- and trans- Mo(CO)4(PCl3)2
cis- Mo(CO)4(PCl3)2
trans- Mo(CO)4(PCl3)2
optimsation
frequency analysis
optimsation
frequency analysis
File Name
Mo_cis_DZ_opt_log_57566
Mo_cis_DZ_freq_log_57568
Mo_trans_DZ_opt_log_57564
Mo_trans_DZ_freq_log_57571
File Type
.log
.log
.log
.log
Calculation Type
FOPT
FREQ
FOPT
FREQ
Calculation Method
RB3LYP
RB3LYP
RB3LYP
RB3LYP
Basis Set
LANL2DZ
LANL2DZ
LANL2DZ
LANL2DZ
Charge
0
0
0
0
Spin
Singlet
Singlet
Singlet
Singlet
E(RB3LYP) (a.u.)
-623.5770719
-623.5770719
-623.576031
-623.576031
RMS Gradient Norm (a.u.)
0.00000577
0.00000584
0.00002963
0.00002964
Imaginary Freq
0
0
Dipole Moment (Debye)
1.3101
1.3101
0.3049
0.3049
Point Group
C1
C1
C1
C1
Job cpu time (days : hours : minutes : seconds)
0 : 1 : 7 : 28.6
0 : 0 : 30 : 38.1
0 : 0 : 47 : 11.6
0 : 0 : 27 : 58.8
Extra d-functions on phosphorous
The basis set for phosphorous implemented with LanL2DZ only has s and p functions [4]. This treatment neglects possible interactions involving low lying d-atomic orbitals, which may play a part in the metal-phosphine bond.
Extra basis functions can be added using the extrabasis keyword. Any additional functions are described in the input file, listed after the coordinates. In this case, extra d-functions can be added to phosphorus for a more complete description.
The input files used for the previously described B3lYP/LanL2DZ optimisations were modified to include an addition d- basis function on phosphorous. This was specified as follows:
# opt b3lyp/lanl2dz int=ultrafine scf=conver=9 extrabasis

...(title, charge/multiplicity, coordinates)...

P 0
D  1  1.0
0.55  0.100D+01
****
The final set of forces and displacements printed in the output files were checked to ensure the jobs had converged. Frequency analysis was run of the final optimised geometries. Calculation summaries can be seen in table 6.
Table 6. Summary of B3LYP/LanL2DZ calculations on cis- and trans- Mo(CO)4(PCl3)2 with extra d-fuctions on phosphorous
cis- Mo(CO)4(PCl3)2
trans- Mo(CO)4(PCl3)2
optimsation
frequency analysis
optimsation
frequency analysis
File Name
Mo_cis_DZ_dAO_opt_log_57567
Mo_cis_DZ_dAO_freq_log_57569
Mo_trans_DZ_dAO_opt_log_57565
Mo_trans_DZ_dAO_freq_log_57570
File Type
.log
.log
.log
.log
Calculation Type
FOPT
FREQ
FOPT
FREQ
Calculation Method
RB3LYP
RB3LYP
RB3LYP
RB3LYP
Basis Set
Gen
Gen
Gen
Gen
Charge
0
0
0
0
Spin
Singlet
Singlet
Singlet
Singlet
E(RB3LYP) (a.u.)
-623.6929123
-623.6929123
-623.6941561
-623.6941561
RMS Gradient Norm (a.u.)
0.00000947
0.00000947
0.00001184
0.00001188
Imaginary Freq
0
0
Dipole Moment (Debye)
0.0758
0.0758
0.2299
0.2299
Point Group
C1
C1
C1
C1
Job cpu time (days : hours : minutes : seconds)
0 : 1 : 5 : 4.0
0 : 0 : 35 : 34.5
0 : 0 : 58 : 57.8
0 : 0 : 35 : 31.9
Discussion from 2nd year lab report:
Infrared analysis. The symmetry of the -
cis-[Mo(CO)4L2] isomer is defined by the
point group C2v. Out of the four carbonyl
stretching modes, all transform as one of the
translation vectors (Tx, Ty, Tz) and therefore
result in a change of dipole moment [5]. This
means all for carbonyl stretching modes are
IR active and one would expect to see four
peaks in the spectrum. The symmetry of the -
trans-[Mo(CO)4L2] isomer is defined by the
point group D4h. Out of the carbonyl
stretching modes, only the doubly degenerate
Eu stretch is IR active and therefore only one
peak is expected.
As you can see from the attached IR
spectra, [Mo(CO)4(pip)4] has four well
defined carbonyl stretches in the expected
region and is easily assigned as the cisisomer.
The first [Mo(CO)4(PPh3)2] has one
sharp absorption at 2013cm-1 and an intense
series of overlapping peaks around 1900cm-1. It is difficult to determine the precise number of peaks in this
region. However, the absorption at 2013.59cm-1 is characteristic of the A1
(1) mode of the cis- isomer.
The thermal isomer shows a single strong absorption at 1891.19cm-1. This can be assigned to the Eu
mode of the trans- isomer, with only one IR active carbonyl stretch. There is a small peak at 2025cm-1. This
may either indicate a small amount of cis- impurity, which may explain the low decomposition point, or it
may be the A1g stretching mode of the trans- isomer. Although this mode is theoretically IR inactive, the
influence of the bulky PPh3 ligands can distort the geometry away from ideal D4h symmetry allowing the
inactive mode to be weakly observed.
...
Computational analysis. Density function theory B3YLP calculations using the LANL2DZ basis set
with extra d functions were carried out on a model system to find the relative energies and calculate the
theoretical IR stretching frequencies using Gaussian 09. Trichlorophosphine was used as an approximation to
the computationally demanding triphenylphosphine groups. Both geometries optimized with the transisomer
coming out at 1.2432×10⁻³ Hartrees lower in energy (3.26 kJ mol-1). This is quite a small difference
in energy, but considering that the phenyl ring is larger that the chlorine atom (PCl3 cone angle = 124° [10]),
the true difference is most likely even greater. The computed IR spectrum of the cis- isomer predicts a
overlap of peaks for the A1
(2), B1 and B2 modes at 1952, 1941 and 1938cm-1 respectively with the A1
(1) peak
at 2019cm-1 which agrees well with the experimental spectra given the approximations of the model. The
trans- spectrum predicts a strong absorption at 1938cm-1 for the Eu mode, with trace absorptions for the A1g
and B2g modes at 2024 and 1966cm-1 respectively caused by minor distortions to the D4h symmetry from the
phosphine ligands. Again, this supports the experimental results.
Mini Project: The structure, bonding and coordination chemistry of [Pd4(C8H8)(C9H9)][BArf4]
Introduction
A recent development in organometallic chemistry has been the isolation of "sheet" sandwich complexes consisting of mono-layer metal clusters, typically of palladium, coordinated between planar aromatic hydrocarbons. A few selected examples of sheet sandwich complexes that have been synthesized so far can be be seen in Fig. 1.
Fig. 1. Examples of sheet sandwich complexes
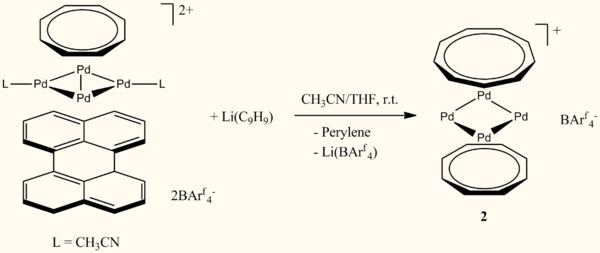
Complex 1, a trinulear Pd3Cl3 cluster capped by two tropylium ligands, was reported by Murahashi et al in 2006[1], along with a Pd5 complex with polycyclic capping ligands. These two compounds were the first "sheet" sandwich complexes to be characterized; a sheet being defined as a monolayer cluster consisting of three or more metal centers. The tetranuclear sheet sandwich complex, 2, was reported by Murahashi et al[2] in 2009 and has several interesting features. X-ray crystallography shows that the Pd4 cluster is almost perfectly square and planar and, unlike 3 and its synthetic precursor, is uncoordinated by acetonitrile. This has prompted theoretical studies into whether 2 is an example of transition metal aromaticity[3][4]. The complex is also a rare example of coordination to the cyclononatetraenyl anion. This ten electron Hückel aromatic species is simliar to the more common cyclopentadienyl anion, but is usually susceptible to skeletal rearrangement. A theoretical study has been carried out to assess the feasibility of using 2 to isolate planar tetra-coordinate carbon[5]. 3 is the first example of a sheet sandwich complex to contain a metal other than palladium and was reported by Murahashi et al in 2011[6]. This complex has a similar structure to 1, and was found to complex to various L-type ligands. 1, 2 and 3 are each reminiscent of the archetypal metallocene structure of ferrocene.
This project will focus on the Pd4 sheet sandwich complex, 2. Experimentally, the structure of 2 is well characterised through NMR and x-ray crystallography. The structure and bonding has also been investigated further through inital and subsequent computational DFT studies. However, one aspect that hasn't been so thoroughly investigated is the coordination chemistry of 2. Trinuclear sheet sandwich complexes, such as 3, are typically stabilized upon synthesis by coordination to acetonitrile, acting as an L-type ligand. 2 is uncoordinated in this respect, even in solutions with a large excess of acetonitrile. On the other hand, titration studies have shown that it will coordinate with phosphine ligands, forming mono- and bis- PR3 adducts, with possible evidence for tris- coordination. The cis/trans stereochemistry of the bis- PR3 adducts has not been established.
This project will aim to compare the binding of 2 to a variety of L-type ligands and investigate how coordination effects the aromatic character of the Pd4 cluster. The preference of bis-adducts to form cis or tans isomers will also be determined.
Optimisation
From the x-ray coordinates
The geometry of 2 was initially optimised at the B3LYP/lanL2DZ level. The x-ray crystallographic coordinates were used to specify the starting geometry. These were obtained from the .cif file, downloaded from the Cambridge Crystallographic Database. The output was then further optimised using the PBE1 hybrid DFT fuctional, with the Stuttgart/Dresden pseudopotential on palladium and the 6-31G(d) basis set on carbon and hydrogen. This was specified by:
In addition to the above, a 50 cycle limit was imposed (opt(maxcycles=50)) for this first calculation with the new method. PBE1 was chosen, as a comparison of density functional methods found it to be superior to the more popular B3LYP in calculating the geometries of transition metal complexes [7][8]. The Stuttgart/Dresden ECPs were also found to significantly outperform the Los Alamos ECPs that are implemented with LanL2DZ. After each optimisation, the final set of forces and displacements printed in the output file were checked to ensure the job had converged. Frequency analysis was carried out on the final geometry to ensure the optimisation had converged to a minimum. All calculations were carried out through Gaussian 09 on the SCAN cluster and a summary of each can be seen in Table 6.
Table 6. Summary of optimisation of 2 from .cif coordinates
B3LYP/LanL2DZ
PBE1/SDD(Pd), 6-31G*(C, H)
Frequency analysis
File Name
Pd_4_opt_log_57578
Pd_4_opt_PBE1_SDD_log_57726
Pd_4_opt_PBE1_SDD_freq_log_57754
File Type
.log
.log
.log
Calculation Type
FOPT
FOPT
FREQ
Calculation Method
RB3LYP
RPBE1PBE
RPBE1PBE
Basis Set
LANL2DZ
Gen
Gen
Charge
1
1
1
Spin
Singlet
Singlet
Singlet
E(RB3LYP) (a.u.)
-1164.730964
-1168.613774
-1168.613774
RMS Gradient Norm (a.u.)
0.00002185
0.00005655
0.00005654
Imaginary Freq
1
Dipole Moment (Debye)
0.4685
0.1821
0.1821
Point Group
C1
C1
C1
Job cpu time (days : hours : minutes : seconds)
0 : 6 : 41 : 22.7
0 : 11 : 28 : 11.5
0 : 7 : 52 : 57.0
Imaginary frequency
Unfortunately, the frequency analysis revealed one imaginary frequency corresponding to rotation of the cyclononatetraenyl (CNT) ring. This indicates that the geometry has optimised to a saddle point on the potential energy surface, which corresponds to a transition state connecting two local minima.
The output file was opened in Gausview 5.0 with the read intermediate geometries checkbox ticked. The plots of energy and RMS gradient against optimisation step show a decrease in energy, followed by an increase in energy. It seems the optimisation "passed through" a minimum but wouldn't converge under the set criteria. Therefore, a new molecule group was created from the structure at step 7, which was the lowest in energy, and the optimisation repeated from this point specified by: # opt freq pbe1pbe/gen pseudo=read int=ultrafine. The additional int=ultrafine keyword requests a larger grid for numerical integration, although it also increases the job time. Unfortunately, this calculation converged in eight steps to a structure that also had an imaginary frequency.
From an "ideal" model
To try and find the elusive minimum, another starting structure was constructed in Gaussview 5.0. Unlike the first attempt based on crystallographic coordinates, this model was made entirely from scratch using the Gaussview builder tools. It had idealised bond lengths, angles and dihedrals, the values of which were informed by the x-ray structure, and the cyclononatetraenyl ring was orientated as to give the molecule a Cs plane of symmetry. The structure was initially optimised by PBE1/LanL2DZ (# opt pbe1pbe/lanl2dz) and then subsequently by PBE1/SDD(Pd), 6-31G*(C, H) (# opt pbe1pbe/gen pseudo=read int=ultrafine). Unfortunately, the frequency analysis carried out on the final optimised structure had a single imaginary frequency, again corresponding to rotation of the CNT ring.
If the structure has converged to a transition state, then one would expect displacement along the imaginary frequency to lower the energy. To test this, a series of new input files were saved from various manual displacements along the imaginary frequency (0.2, 0.4, 0.6, 0.8, 1.0). Single point energy calculations (# pbe1pbe/gen pseudo=read int=ultrafine) were performed on each structure. Each of the energies were higher than the original suggesting that the imaginary frequency may be product of noise. However, the displacements may have been too large and it doesn't take into account the other degrees of freedom so the results are inconclusive. An IRC calculation was also attempted, but this failed to converge.
In hindsight, it may have been worth performing the initial optimisation with the nosymm keyword.
From previously optimised coordinates
It was decided to check whether the problem of not being able to converge to a minimum was to do with the method. The theoretical study on whether compounds such as 2 could be used to isolate planar tetra-coordinate carbon had successfully optimised 2 to a minimum with no imaginary frequencies. Their calculations were performed using the B3LYP functional with 6-311+G(3df,p) on carbon and hydrogen and SDD with extra 2f and 1g functions on palladium. The Cartesian coordinates as provided in the supplementary information were optimised using PBE1/SDD(Pd), 6-31G*(C, H) (# opt freq pbe1pbe/gen int=ultrafine pseudo=read pop=(full,nbo)). A summary of this calculation can be seen in table 11.
The optimisation converged to a minimum with no imaginary frequencies. This shows that optimising to a stationary point with no imaginary frequencies is at least possible with the current method, given a good enough starting point. The difficulty seems to be in converging with several of the failed optimisations "passing through" energy minima. 6-31G(d) and the SDD double zeta basis set should be adequate for most applications in transition metal organometallic chemistry. However, it seems that they are unable to describe the
Coordination of 2 to L-type ligands
Scheme 1. Synthesis of 2
An interesting observation is that 2 is uncoordinated with respect to acetonitrile acting as a L-type donor ligand. This is on the basis of 1H-NMR analysis in CDCl3, which found no evidence of coordination to acetonitrile or pyridine, even with excess present in solution. This is unlike its synthetic precursor (Scheme 1.) or trinuclear sheet sandwich complexes, such as 3, that have so far been reported. However, evidence was found for coordination of 2 to phosphine ligands, with mono- and bis- triphenylphosphine adducts observed at equilibrium.
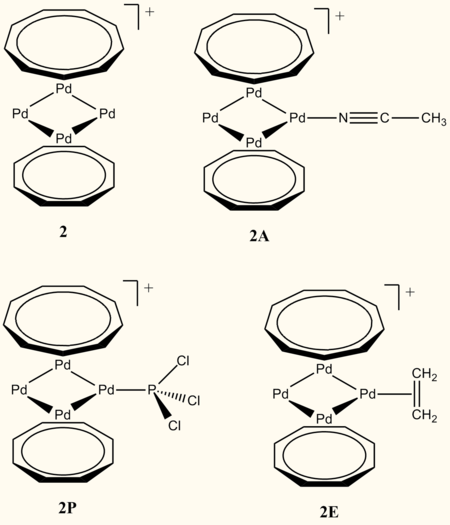
To explore its coordination chemistry, 2 will be modeled as a mono-coordinated adduct with acetonitrile, PCl3 and ethene. PCl3 will be used instead of PPh3 for computational efficiency. These three represent different classes of L-type ligand that have all be shown to bind to the trinuclear platinum complex, 3.
Qualatative assesment with electron counting
One guide as to whether a metal center has "room" to accommodate extra ligands is the 18 electron rule.
Pd = 10 e-


CNT = 2 1/4 e-


COT = 2 e-


2x Pd-Pd bond = 2 e-


+1 charge = - 1/4 e-


total = 16 VE
This quick analysis, as outlined above, suggests that each palladium has 16VE. This potentially allows for coordination with a 2e- donor into an unoccupied d-orbital.
Calculations
Fig. 2. Adducts
Models of adducts of 2 to acetonitrile (2A), ethene (2E) and trichlorophosphine (2P) (Fig. 2) were constructed in Gaussview 5.0 from the optimised structure of 2. The geometries were initially optimised, with frequency analysis, at the PBE1/LanL2DZ level, specified by: # opt freq pbe1pbe/lanl2dz. The outputs were then further optimised to the PBE1/SDD(Pd), 6-31G*(C, H, N/P/Cl) level specified by: # opt pbe1pbe/gen pseudo=read. Subsequent frequency analysis was run on the final optimised geometries. Optimisations were carried out on acetonitrile, ethene and PCl3, along with frequency analysis, at the pbe1pbe/6-31G* level. A summary of these calculations can be seen in table 8 and table 9.
In order to calculate the equilibrium constant, 2, 2A, 2E, 2P, acetonitrile, ethene and PCl3 were optimised from the outputs of the gas phase optimizations with PCM solvent model (SCRF=(Solvent=Chloroform) and frequency analysis ( opt freq ). These calculations were also performed using the M06L pure DFT meta-GGA functional.
To estimate effect of coordination upon ring currents, nuclear independent chemical shift was calculated at the centre of the CNT, Pd4 and COT rings. This was done by placing a ghost atom (Bq) in the centre of rings using the place fragment at centroid of selected atoms tool in Gaussview and NMR calculation performed with the GIAO method. Signs reversed according to ppm convention.
Table 8. Summary of PBE1/SDD(Pd), 6-31G*(C, H, N/P/Cl) optimisations of 2A, 2E and 2P


2A

2E

2P


File Name
p4_opt_1acetonitrile_SDD_log_58431
p4_opt_1ethene_SDD_log_58473
p4_opt_1PCl3_SDD_log_58432


File Type
.log
.log
.log


Calculation Type
FOPT
FOPT
FOPT


Calculation Method
RPBE1PBE
RPBE1PBE
RPBE1PBE


Basis Set
Gen
Gen
Gen


Charge
1
1
1


Spin
Singlet
Singlet
Singlet


E(RB3LYP) (a.u.)
-1301.229478
-1247.115718
-2889.992278


RMS Gradient Norm (a.u.)
0.00001596
0.00001105
0.00000973


Imaginary Freq


Dipole Moment (Debye)
6.5467
1.2824
3.9535


Point Group
C1
C1
C1


Job cpu time (days : hours : minutes : seconds)
0 : 12 : 35 : 56.4
1 : 1 : 38 : 31.9
1 : 5 : 0 : 4.3
Table 9. Summary of PBE1/6-31G* optimisations of acetonitrile, ethene and PCl3


Acetonitrile

Ethene

PCl3


File Name
acetonitrile_opt_log_58474
ethene_opt_log_58476
PCl3_opt_log_58477


File Type
.log
.log
.log


Calculation Type
FOPT
FOPT
FOPT


Calculation Method
RPBE1PBE
RPBE1PBE
RPBE1PBE


Basis Set
6-31G(d)
6-31G(d)
6-31G(d)


Charge
0
0
0


Spin
Singlet
Singlet
Singlet


E(RB3LYP) (a.u.)
-132.5907247
-78.47954389
-1721.361269


RMS Gradient Norm (a.u.)
0.0000393
0.00006914
0.00028755


Imaginary Freq


Dipole Moment (Debye)
3.8576
0
0.8464


Point Group
C3V
C2H
C3V


Job cpu time (days : hours : minutes : seconds)
0 :  0 :  0 : 25.5
0 :  0 :  0 : 23.0
0 :  0 :  0 : 36.2
All optimisations described above, including PBE1/LanL2DZ, converged to minima without any imaginary frequencies.
Optimised geometries of 2A, 2E and 2P
2A
2E
2P
Selected bond lengths (nm):
Selected bond lengths (nm):
Selected bond lengths (nm):
Distortion factor = 1.06
Distortion factor = 1.13
Distortion factor = 1.11
Optimised geometries of 2, 2A, 2E and 2P can be seen in the Jmol applets above. Coordination appears to cause a distortion in the tetra-palladium ring from a square to a rhombus. The Pd-Pd distance in line with the coordinating ligand increases and the Pd-Pd distance perpendicular to the coordinating ligand decreases. This is in comparison with uncoordinated 2, where the Pd-Pd distances across the ring are 0.389nm and 0.386nm. This has been quantified by a "distortion factor", which is the Pd1-Pd4 bond distance divided by the Pd2-Pd3 bond distance and can be thought of as the ratio between the distances across the palladium ring. Uncoordinated 2 has a distortion factor of 1.01. Interestingly, ethene and trichlorophosphine have much larger distortion factors than acetonitrile, with ethene having the largest.
Binding energies
An estimation of the binding energy for each of the three ligands was made by comparing the energy of the adducts to the sum of the energy of 2 and the coordinating species (Table 10.).
Table 10. PBE1 binding energies of acetonitrile, ethene and PCl3


energy of adduct (a.u.)

sum of energy of fragments (a.u.)

difference


a.u.

kJ/mol


acetonitrile
-1301.229478
-1301.204672
0.02480599
65


ethene
-1247.115718
-1247.093491
0.02222682
58


PCl3
-2889.992278
-2889.975216
0.01706187
45
The calculations above suggest that the electronic stabilization upon coordination to acetonitrile is around 20kJ/mol greater than for PCl3. Clearly this does not tell the whole story since experimentally, coordination to PPh3 was found to be favorable whereas coordination to acetonitrile was not observed. However, it does show that electronically, there is a stabilization associated with coordination to each of the L-type ligands.
To find of whether coordination is favourable requires calculation of the equilibrium constant. This is related to the change in Gibbs free energy, which is in turn related to the change in enthalpy and entropy. The entropic penalty upon binding may play a significant role. Thermochemical corrections can be obtained through frequency calculations.
The optimisations and frequency analyses were repeated with chloroform solvent model


It has been found that one of the shortfalls of DFT is its ability to correctly predict the energy of metal-phosphine bonds. Popular DFT and hybrid-DFT functionals widely used with organic molecules, are seen to significantly underestimate the M-P bond strength.
Given this, PBE1 may be underestimating the Pd-P bond strength in 2. To test this, single point energy calculation were performed on the optimised structures of 2, 2A, 2P, acetonitrile and PCl3 with the M06L functional. M06L is a fairly recent meta-GGA pure DFT functional, developed by . It has been shown predict metal-phosphine bond energies in line with experiment, where popular DFT and hybrid DFT methods have fallen short, and will provide a useful test as to the reliability of the PBE1 energies is table 10.
Table 10. M06L binding energies of acetonitrile, ethene and PCl3


energy of adduct (a.u.)

sum of energy of fragments (a.u.)

difference


a.u.

kJ/mol


acetonitrile
-1302.523137
-1302.507578
0.01555946
41


PCl3
-2891.709088
-2891.692805
0.01628295
43
Interestingly, M06L functional predicts that the binding energy acetonitrile is less than that of PCl3.
Effect of coordination upon NICS
Table 11. NICS


2A

2E

2P

2


COT
-4.912
-4.3476
-4.2429
-4.1943


CNT
-10.1471
-9.8919
-9.6969
-9.5392


Pd4
-32.3052
-31.3771
-31.3401
-29.9051
cis/trans sterochemistry of the bis-PPh3 adduct
The cis/trans sterochemistry of the bis-PPh3 adduct was not established by experiment.