Rep:Mod:62367968
3rd Year Computational Lab - Module 2
Introduction
The structure and bonding of molecules are crucial to understanding more about their chemistry and reactivity. This project aims to make use of computational chemistry applications Gaussview 5 in conjunction with Gaussian to achieve this goal. By optimising the geometry of several molecules including BH3, TlBr3 and BBr3 – theoretical information on the kinetic and thermodynamic properties of molecules can be uncovered. These serve as a good theoretical benchmark with which to compare experimental data.
Optimisation of a molecule
BH3 - B3LYP, 3-21G optimisation
Initially, a minimal basis set (3-21G) was chosen along with a DFT method and B3LYP hybrid functional.
Results from log file and Gaussview summary provided below:

         Item               Value     Threshold  Converged?
 Maximum Force            0.000413     0.000450     YES
 RMS     Force            0.000271     0.000300     YES
 Maximum Displacement     0.001610     0.001800     YES
 RMS     Displacement     0.001054     0.001200     YES
Data indicates that the optimisation has been completed – the value for “RMS Gradient Norm” is less than 0.001.
B-H bond distance: 1.19 Å
H-B-H bond angle: 120.0˚ (D3 symmetry group, trigonal planar)
These values agree with those quoted in literature: 1.19 Å and 120˚ [1] respectively
BH3 - B3LYP, 6-31G d,p optimisation
Next a higher level basis set (6-31G d,p) was used in conjunction with a DFT method and B3LYP hybrid functional employed previously.
Results from log file and Gaussview summary provided below:

         Item               Value     Threshold  Converged?
 Maximum Force            0.000005     0.000450     YES
 RMS     Force            0.000003     0.000300     YES
 Maximum Displacement     0.000020     0.001800     YES
 RMS     Displacement     0.000012     0.001200     YES
Data indicates that the optimisation has been completed – the value for “RMS Gradient Norm” is less than 0.001.
From this point onwards, inclusion of the convergence table will represent the “RMS Gradient Norm” as being less than 0.001. All other instances will be commented on accordingly.
Total energies of BH3 optimisations
Total energy for your 3-21G optimised structure = -26.46226338a.u.
Total energy for your 6-31G(d,p) optimised structure = -26.61532374a.u.
TlBr3 - optimisations using pseudo-potentials (LanL2DZ)
The optimisation was run with a point group restriction on the TlBr3 atom (D3h, 0.001 – very tight)as well as a different LanL2DZ basis set with B3LYP hybrid functional. The calculation itself was submitted to the HPC server.
Results from log file and Gaussview summary provided below:

        Item               Value     Threshold  Converged?
Maximum Force            0.000002     0.000450     YES
RMS     Force            0.000001     0.000300     YES
Maximum Displacement     0.000022     0.001800     YES
RMS     Displacement     0.000014     0.001200     YES
Tl-Br bond distance: 2.65 Å
Br-Tl-Br bond angle: 120.0 (D3 symmetry group, trigonal planar)
These values agree with those quoted in literature: 2.52 Å[2] and 120[3] respectively
BBr3 - optimisation using a mixture of basis sets and pseudo potentials
The calculation was set up employing both a 6-31G (d,p) basis set, along with a LanL2DZ basis set (B3LYP hybrid functional as before). The mixture of basis sets is to account for the “light-heavy” imbalance of the B-Br bond. Optimisation was performed with initial to yield D3 h point-group instead of erroneous C 2 v.
Results from log file and Gaussview summary provided below:
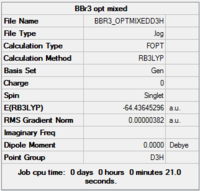
         Item               Value     Threshold  Converged?
 Maximum Force            0.000008     0.000450     YES
 RMS     Force            0.000005     0.000300     YES
 Maximum Displacement     0.000037     0.001800     YES
 RMS     Displacement     0.000024     0.001200     YES
B-Br bond distance: 1.93 Å
Br-B-Br bond angle: 120.0 (D3 symmetry group, trigonal planar)
These values agree with those quoted in literature: 1.88 Å[4]
Comparison of bond distances
The bond lengths of the 3 molecules investigated are summarised in the table below:
| Molecule | Bond Lengths, Å |
|---|---|
| BH3 | 1.19 |
| BBr3 | 1.93 |
| TlBr3 | 2.65 |
By contrasting the difference in bond lengths of the molecules BH3 and BBr3, one can draw some conclusions on the effect of changing the ligand in relation to a boron central atom. Numerically, the value for the length of the B-H bond (1.19 Å) is significantly less than that of the B-Br bond (1.93 Å).
A key difference between ligands, bromine and hydrogen atoms, is their size. As a relatively large atom, bromine will possess a diffuse outer electron shell which hinders the effectiveness of its electronic interaction (inefficient overlap) with the boron atom. Another difference worth considering is electronegativity. Bromine has a Pauling electronegativity of 2.74[5] compared to 2.1[6] for hydrogen. A value of 2.01[7] for the boron atom indicates that the B-Br bond is far more polar than the B-H bond. Thus, the distortion of the shared electron towards the bromine atom is prominent.
In terms of similarities, both bromine and hydrogen have an odd number of valence electrons (unpaired). This, however, has relatively small impact on the bond length.
The same analysis can be conducted for TlBr3 and BBr3, in this instance, relating to the effect of changing a Group 13 central atom both with three valence electrons. The electronic argument made above can be used once more. Thallium, with its outermost 6p orbitals is a lot larger in terms of electronic size in comparison to boron with only one electron residing in a 2p orbital. This naturally results in better electronic overlap between boron and bromine atoms – the B-Br bond is thus shorter than the TlBr3 bond.
One may be intuitively lead to believe the fact that the overlap of relatively large electron clouds (thallium and bromine) will result in effective overlap – thus a shorter bond. This is disproved when accounting for the weak electron density in the effective overlap cross-sectional area.
It is perhaps also worth mentioning the inert pair effect at this point. This phenomenon results in the preference of thallium to adopt a +1 oxidation state rather than the +3 oxidation state normally associated with boron. A direct implication of three coordinate thallium is its instability relative to a boron analogue.
What is a bond?
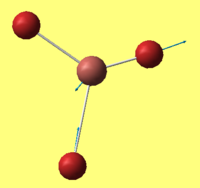
At times, Gaussview will tend to not display bonds in the places one would expect them to be present. This is a result of the fact that Gaussview is primarily accustomed to bond lengths in organic molecules, thus when a calculated bond length is longer than that would be usually expected – a bond is not drawn.
This leads on nicely to the distinction of a bond in the first place. It can be considered as a given interaction (in an area of high electron density) between atoms resulting in a larger entity being formed. In an ionic bond, this attraction is characterised by the electrostatic interaction between oppositely charged nuclei. Alternatively in a covalent bond, molecular orbitals of suitable symmetry overlap result in an attractive interaction. In practice, bonds are usually somewhere in between ionic and covalent in terms of bond character.
Frequency analysis
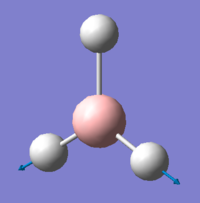
BH3 vibrational analysis
A further vibrational analysis was performed using the previously optimised structure (DFT, B3LYP, 6-31G (d,p))
Gaussview summary provided below:
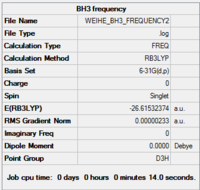
Results from frequency analysis
         Item               Value     Threshold  Converged?
 Maximum Force            0.000004     0.000450     YES
 RMS     Force            0.000002     0.000300     YES
 Maximum Displacement     0.000022     0.001800     YES
 RMS     Displacement     0.000010     0.001200     YES
Values for frequency have been extracted from the corresponding output file:
 Low frequencies ---   -3.4213   -0.0026   -0.0004    0.0015    3.9367    3.9367
 Low frequencies ---   46.4289   46.4292   52.1449
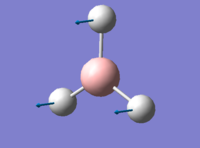
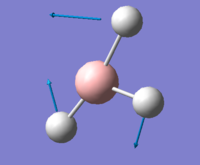
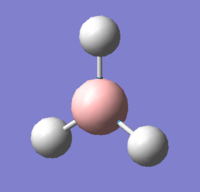
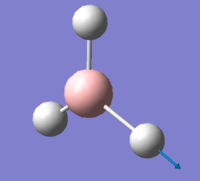
Normal modes of vibration (as predicted) are presented in the table below:
IR spectrum presented below:
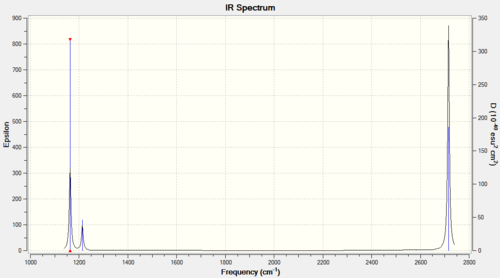
The IR spectrum only accounts for 3 peaks despite there being 6 vibrational modes. One must consider the prerequisite for IR activity – that vibrations result in a change in dipole moment of the molecule. Thus, the symmetric A1’ stretch does not fulfil this criteria and remains IR inactive.
In general terms, one would expect 3N-6 vibrational modes (where N corresponds to the number of atoms) in a molecule. For BH3, N=4, thus the 6 predicted vibrations conforms to this rule. Out of the remaining IR active vibrations, the E’ vibrations at 1213cm-1 and 2715cm-1 are degenerate. Thus only 2 bands are observed in the spectrum as opposed to 4.
In summary, the 3 peaks present correspond to vibrations of A2’’ (1163cm-1) E’ (1213cm-1) and E’ (2715cm-1) symmetry
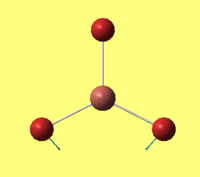
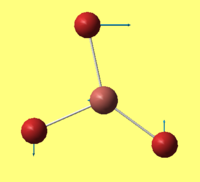
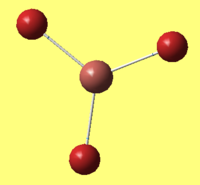
TlBr3 vibrational analysis
A further vibrational analysis was performed using the previously optimised structure (DFT, LanL2DZ, 6-31G (d,p)) Gaussview summary provided below:
Gaussview summary provided below:
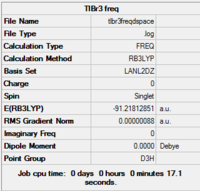
         Item               Value     Threshold  Converged?
 Maximum Force            0.000002     0.000450     YES
 RMS     Force            0.000001     0.000300     YES
 Maximum Displacement     0.000022     0.001800     YES
 RMS     Displacement     0.000011     0.001200     YES
Completed frequency analysis of TlBr3
 Low frequencies ---   -3.4213   -0.0026   -0.0004    0.0015    3.9367    3.9367
 Low frequencies ---   46.4289   46.4292   52.1449
The lowest "real" normal mode occurs at 46.4289cm-1
IR spectrum presented below:

A summary of the vibrational frequencies considered is presented in the table below:
| TlBr3 frequency / cm-1 | BH3 frequency / cm-1 |
|---|---|
| 46 | 1163 |
| 46 | 1213 |
| 52 | 1213 |
| 165 | 2582 |
| 211 | 2715 |
| 211 | 2715 |
Numerically, the frequency values of BH3 are significantly larger than that of TlBr3. The frequency at which a bond vibrates also corresponds to its inherent bond strength. In this case, the B-H bond can be inferred to be stronger relative to the Tl-Br bond.
The order of vibrational modes in the two molecules is also slightly different. In BH3, the order is A2’, E', E', A1', E', E', whereas in TlBr3, it is E',E', A2’, A1' E', E'. Both however exhibit six modes – this is consistent with the notion of the two molecules being isostructural. Similarly, in the spectra of the two molecules – both present three vibrational peaks.
A trend that arises in both molecules is the closeness of two pairs of modes – the A2’ and E’ modes, as well as the A1’ and E’ modes (higher energetically). This is perhaps a sign of vibronic coupling between modes of vibration in both molecules. A prerequisite for strong coupling interactions in polyatomic systems is that the two vibrational modes that couple should possess a common atom or bond. In the trigonal planar arrangement, this is easily fulfilled – hence the closeness of the pairs of modes. Thus, modes at higher energy may be a result of coupling interactions experienced by the pair at lower energy.
The same method and basis set (for both the optimisation and frequency analysis calculations) as the PES (potential energy surface) must be employed. Calculations that use a different basis set for optimisation and frequency calculations would not be comparable.
A frequency analysis essentially verifies whether or not we have determined a minimum structure on a PES. It is also provide valuable information such as frequencies of vibration in spectra that may be related to similar data derived from experiments.
The “low frequencies” represents the “-6” part of the “3N-6” vibrations of a polyatomic molecule (with N atoms). Negative frequency values can be negated. It is usually the case that “low frequencies” have associated displacement vectors that ultimately influence the centre of mass of the molecule. In this symmetric case, it is the position of the boron or thallium atom that is shifted in each instance.
Population analysis
Molecular orbitals of BH3
A further energy calculation was performed using the previously optimised structure (DFT, B3LYP, 6-31G (d,p))
Gaussview summary provided below:
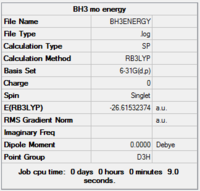
Results from population analysis
Completed population analysis of BH3
The MO diagram constructed using the LCAO method is shown below in Figure 10. Computed visualisations of the MOs are also included alongside the theoretical model:

It can be seen from Figure 10 that the "real" MOs do not differ from the LCAO MOs, thus validating qualitative MO theory as an accurate tool in modelling the molecular framework of simple molecules.
NBO analysis
NH3 optimisation practice
6-31g (d,p) Optimisation
A high level basis set (6-31G d,p) was used in conjunction with a DFT method and B3LYP hybrid functional employed previously.
Gaussview summary provided below:
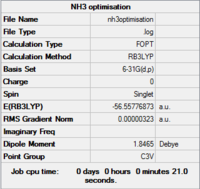
Results from log file
         Item               Value     Threshold  Converged?
 Maximum Force            0.000024     0.000450     YES
 RMS     Force            0.000012     0.000300     YES
 Maximum Displacement     0.000079     0.001800     YES
 RMS     Displacement     0.000053     0.001200     YES
Frequency analysis
A further frequency analysis was performed using the previously optimised structure (DFT, B3LYP, 6-31G (d,p))
Gaussview summary provided below:
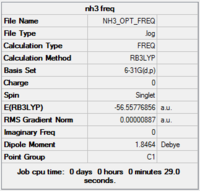
Results from log file
         Item               Value     Threshold  Converged?
 Maximum Force            0.000021     0.000450     YES
 RMS     Force            0.000009     0.000300     YES
 Maximum Displacement     0.000077     0.001800     YES
 RMS     Displacement     0.000039     0.001200     YES
 Low frequencies ---  -30.7674   -0.0013   -0.0005    0.0004   20.3063   28.2539
 Low frequencies --- 1089.5559 1694.1238 1694.1868
Population analysis
A further energy calculation was performed using the previously optimised structure (DFT, B3LYP, 6-31G (d,p))
Gaussview summary provided below:

Results from log file
NBO analysis of NH3
NBO visualisation on Gaussview:
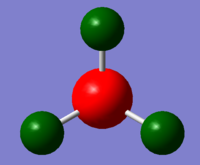
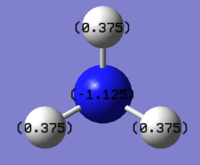
The charge range is between -1.125 and 1.125

NBO charge on nitrogen: -1.125
NBO charge on hydrogen: 0.375
NH3BH3 Analysis
3-21g optimisation

Initially, a minimal basis set (3-21G) was chosen along with a DFT method and B3LYP hybrid functional.
Gaussview summary provided below:
         Item               Value     Threshold  Converged?
 Maximum Force            0.000082     0.000450     YES
 RMS     Force            0.000030     0.000300     YES
 Maximum Displacement     0.000585     0.001800     YES
 RMS     Displacement     0.000204     0.001200     YES
6-31g (d,p) optimisation
Next, a higher level basis set (6-31G, (d,p)) was chosen along with a DFT method and B3LYP hybrid functional.
Gaussview summary provided below:
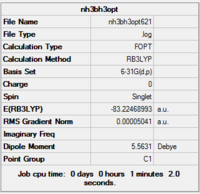
         Item               Value     Threshold  Converged?
 Maximum Force            0.000126     0.000450     YES
 RMS     Force            0.000036     0.000300     YES
 Maximum Displacement     0.000921     0.001800     YES
 RMS     Displacement     0.000428     0.001200     YES
Frequency analysis
A further frequency analysis was performed using the previously optimised structure (DFT, B3LYP, 6-31G (d,p))
Gaussview summary provided below:
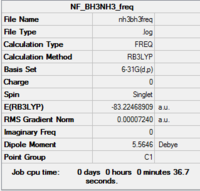
         Item               Value     Threshold  Converged?
 Maximum Force            0.000222     0.000450     YES
 RMS     Force            0.000051     0.000300     YES
 Maximum Displacement     0.001345     0.001800     YES
 RMS     Displacement     0.000554     0.001200     YES
 Low frequencies ---   -0.0004    0.0010    0.0012   11.1284   11.8644   20.0685
 Low frequencies ---  263.3420  631.4650  638.0156
Determination of the dissociation energy
Summary of the energies calculated from optimised structures:
E(NH3)= -55.55776856a.u.
E(BH3)= -26.61532374a.u.
E(NH3BH3)= -83.22468993 a.u.
Dissociation for NH3BH3 adduct is the difference between the energy of a molecule of NH3BH3 and the sum of the energies of its components (NH3 and BH3):
ΔE = (-83.22468993)-[(-56.55776856)+(-26.61532374)]
ΔE = (-83.22468993)-(-83.1730923)
ΔE = -0.05159763 a.u.
Edissoc = -135.4 kJ/mol-1
Mini Project - Aromaticity
All of the calculations performed henceforth were conducted on the HPC server.
Benzene
6-31g (d,p) optimisation
A higher level basis set (6-31G d,p) was used in conjunction with a DFT method and B3LYP hybrid functional employed previously. The "Symmetrise" function in Gaussview was applied prior to the optimisation to ensure that the correct symmetry, i.e. D6h, was obtained at the end of the calculation. Without using this function prior to commencing, an incorrect C1 symmetry was arrived at.
Gaussview summary provided below:
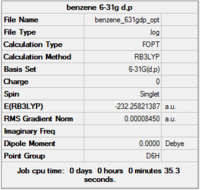
         Item               Value     Threshold  Converged?
 Maximum Force            0.000199     0.000450     YES
 RMS     Force            0.000081     0.000300     YES
 Maximum Displacement     0.000847     0.001800     YES
 RMS     Displacement     0.000299     0.001200     YES
Completed optimisation of benzene
Bond lengths
C-C : 1.40Å, confirmed in literature[8]
Frequency analysis
A further frequency analysis was performed on the previously optimised structure(DFT, B3LYP, 6-31G (d,p)):
Gaussview summary provided below:
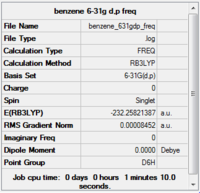
         Item               Value     Threshold  Converged?
 Maximum Force            0.000199     0.000450     YES
 RMS     Force            0.000085     0.000300     YES
 Maximum Displacement     0.000806     0.001800     YES
 RMS     Displacement     0.000346     0.001200     YES
Completed frequency analysis of benzene
 Low frequencies ---   -4.6046   -4.6046   -0.0088   -0.0041   -0.0041    9.6590
 Low frequencies ---  413.9386  413.9386  621.1428
Boratabenzene
6-31g (d,p) optimisation
A higher level basis set (6-31G d,p) was used in conjunction with a DFT method and B3LYP hybrid functional employed previously. The "Symmetrise" function in Gaussview was applied prior to the optimisation for reasons mentioned previously.
Gaussview summary provided below:
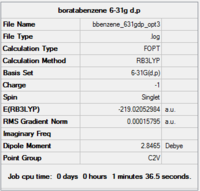
         Item               Value     Threshold  Converged?
 Maximum Force            0.000157     0.000450     YES
 RMS     Force            0.000069     0.000300     YES
 Maximum Displacement     0.000912     0.001800     YES
 RMS     Displacement     0.000324     0.001200     YES
Completed optimisation of boratabenzene
Bond lengths
B-(α)C : 1.51Å
(α)C –(β)C : 1.40Å
(β)C –(γ)C :1.40 Å
These values are confirmed in previous literature [9]
Frequency analysis
A further frequency analysis was performed on the previously optimised structure(DFT, B3LYP, 6-31G (d,p)):
Gaussview summary provided below:
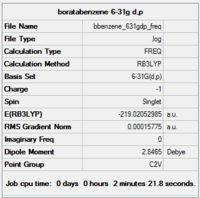
          Item               Value     Threshold  Converged?
 Maximum Force            0.000425     0.000450     YES
 RMS     Force            0.000158     0.000300     YES
 Maximum Displacement     0.000888     0.001800     YES
 RMS     Displacement     0.000392     0.001200     YES
Completed frequency analysis of boratabenzene
 Low frequencies ---  -13.1438   -0.0011   -0.0010   -0.0008   15.0593   18.1657
 Low frequencies ---  371.3447  404.2330  565.2519
Pyridinium
6-31g (d,p) optimisation
A higher level basis set (6-31G d,p) was used in conjunction with a DFT method and B3LYP hybrid functional employed previously. The "Symmetrise" function in Gaussview was applied prior to the optimisation for reasons mentioned previously.
Gaussview summary provided below:

          Item               Value     Threshold  Converged?
 Maximum Force            0.000062     0.000450     YES
 RMS     Force            0.000023     0.000300     YES
 Maximum Displacement     0.000801     0.001800     YES
 RMS     Displacement     0.000174     0.001200     YES
Completed optimisation of pyridinium
Bond lengths
N-(α)C : 1.35Å
(α)C –(β)C : 1.38Å
(β)C –(γ)C :1.40 Å
These values are confirmed in previous literature [10]
Frequency analysis
A further frequency analysis was performed on the previously optimised structure(DFT, B3LYP, 6-31G (d,p)):
Gaussview summary provided below:
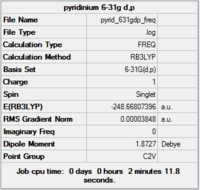
          Item               Value     Threshold  Converged?
 Maximum Force            0.000154     0.000450     YES
 RMS     Force            0.000038     0.000300     YES
 Maximum Displacement     0.000746     0.001800     YES
 RMS     Displacement     0.000227     0.001200     YES
Completed frequency analysis of pyridinium
 Low frequencies ---   -7.2090   -0.0001    0.0003    0.0012   17.3407   18.5421
 Low frequencies ---  392.4559  404.0620  620.4717
Borazine
6-31g (d,p) optimisation
A higher level basis set (6-31G d,p) was used in conjunction with a DFT method and B3LYP hybrid functional employed previously. The "Symmetrise" function in Gaussview was applied prior to the optimisation for reasons mentioned previously.
Gaussview summary provided below:
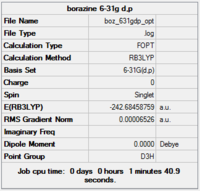
          Item               Value     Threshold  Converged?
 Maximum Force            0.000089     0.000450     YES
 RMS     Force            0.000033     0.000300     YES
 Maximum Displacement     0.000250     0.001800     YES
 RMS     Displacement     0.000075     0.001200     YES
Completed optimisation of borazine
Bond lengths
N-B : 1.35Å
This values is confirmed in previous literature [11]
Frequency analysis
A further frequency analysis was performed on the previously optimised structure(DFT, B3LYP, 6-31G (d,p)):
Gaussview summary provided below:
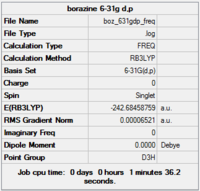
          Item               Value     Threshold  Converged?
 Maximum Force            0.000204     0.000450     YES
 RMS     Force            0.000065     0.000300     YES
 Maximum Displacement     0.000308     0.001800     YES
 RMS     Displacement     0.000098     0.001200     YES
Completed frequency analysis of borazine
 Low frequencies ---   -7.0171   -6.8521   -6.4062   -0.0107    0.0490    0.1520
 Low frequencies ---  289.2324  289.2404  403.8311
NBO analysis
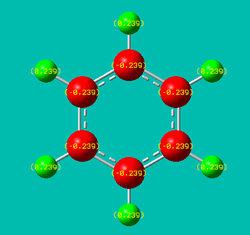
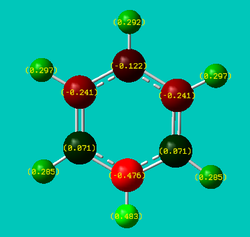
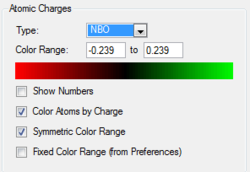
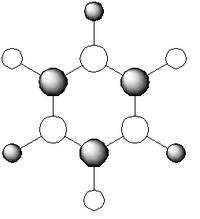
NBO analysis was performed on each of the four molecules and the resulting charge distribution visualisations have been provided below:
| Benzene | Boratabenzene | Pyridinium | Borazine |
|---|---|---|---|
 |
 |
 |
 |
| http://hdl.handle.net/10042/20672 | http://hdl.handle.net/10042/20673 | http://hdl.handle.net/10042/20676 | http://hdl.handle.net/10042/20675 |
| Net charge: 0 | Net charge: -1 | Net charge: +1 | Net charge: 0 |
 |
 |
 |
 |
| In benzene, the six aromatic carbons (shaded red) all carry the same negative charge (-0.239), whilst the six hydrogens in the ring systems (shaded green) all possess an equal, but opposite, charge (+0.239). This uniform localisation of charge confirms the symmetric nature of benzene. | The resulting NBO clearly shows an uneven charge distribution that is very much different to that of benzene, despite the two systems being isoelectronic (C-H unit replaced by B-H- counterpart), albeit boratabenzene possessing an extra negative charge. The polarity of the B-H unit (boron has positive charge localised upon it) is also the reverse of the remaining C-H units on the ring. This reflects the electropositivity of boron as well as the hydridic nature of the associated hydrogen atom. The addition of the B-H- unit consequently affects the pi electron system parallel to the plane of the molecule (formed from ring atoms’ respective p-orbitals). This results in a distortion of the pi electron cloud (the spare electron from the sp2 B-H unit is presumed to occupy a vacant pi molecular orbital) breaking the symmetry exhibited by benzene’s pi clouds. From the charge distribution numbers, one will be able to see that the two carbons adjacent to the boron atom end up carrying a lot of negative charge (-0.588 each). | Similar to boratabenzene, the addition of nitrogen as a heteroatom in an otherwise carbon dominated ring framework results in an interesting localisation of charge. Specifically, the C-H unit has been replaced by a NH+ unit (isoelectronic) resulting in the positively pyridinium cation. The polarity of the N-H unit (nitrogen has significant negative charge localised upon it) reflects the electronegativity of nitrogen relative to carbon and hydrogen (proton). The missing electron however does not originate from the delocalised pi system, but the outward (with respect to the ring) pointing sp2 lone pair on the nitrogen atom. Naturally, this imbalance results in a distortion of the delocalised pi cloud - reflected by the severe electron deficiency of the two carbons (+0.071) either side of the nitrogen atom. One similarity observed in the cases of boratabenzene and pyridinium is the fact that the charge localised at the two carbons located beta from the heteroatom (be it B or N) is almost equal to that observed in benzene (both with 0.011 units). Moreover, the alpha-carbon is oppositely charged relative to the substituted heteroatom. This reflects the issue of bond polarity of the X-H (X=B, N) unit, and consequently the inductive effect of the heteroatom. | Sometimes referred to as inorganic benzene, borazine displays inherent symmetry in terms of charge distribution which is not the case for both boratabenzene and pyridinium. However, the localisation of charge is not uniform across all atoms. This observation is to be expected when considering the alternating B-N-B-N arrangement of the ring and the fact that nitrogen atoms are electronegative with respect to hydrogen atoms (vice versa for boron). |
Benzene Molecular Orbital Diagram
The MO diagram of benzene was constructed by analysing the visualisations of each of the occupied and vacant orbitals as presented through the Gaussview interface. These were converted to their respective AOs, i.e. s and p orbitals and have been included alongside their respective energy level in the diagram. The symmetry label for each energy level was obtained from analysis of the frequency analysis output file (previously linked to).

Aromaticity is a concept that is central to the marked stability of certain molecules – benzene is a classic choice to illustrate this notion. In theory, the distinction between whether a compound is aromatic should be clear-cut. Huckel’s rule states that if the total number of pi electrons in a conjugated cyclic system comes to 4n+2, whereby n represents an integer – the compound is aromatic. The question of whether borazine is indeed aromatic has been the subject of debate - it is, however, generally considered to be aromatic[12]
Comparison of molecular orbitals
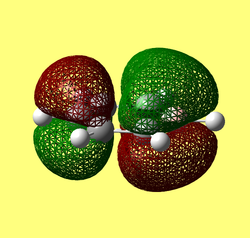
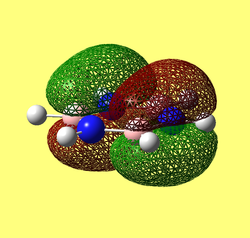
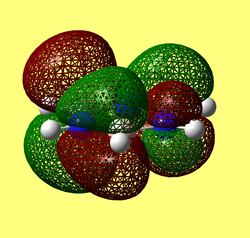
π1 molecular orbitals
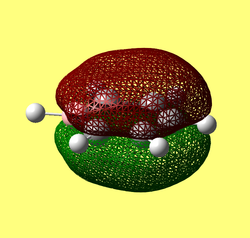
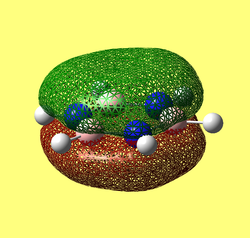
At first glance, all the π1 molecular orbitals across the four compounds resemble the same shape – delocalised cloud of electrons above and below the plane of the molecule (albeit with minor differences in electron distribution over certain atoms). This confirms the notion of aromaticity – true for all four molecules under consideration. Using the highly symmetric benzene molecule as a reference, it is possible to rationalise distortions in the shape of the other MOs and relate this to the respective substituent unit (X-H, X=B,N). In the case of boratabenzene, where a C-H unit has been replaced by an isoelectronic B-H- counterpart, it is clear that the π1 molecular orbital is shifted away from the electropositive (relative to carbon) boron atom. One can thus deduce that the pz AO (perpendicular to the plane) on the boron atom donates less electron density into the π1 MO. This suggestion has been corroborated previously in the analysis of charge distribution on each of the substituent atoms of boratabenzene. As such, the weakened contribution from the pz AO on boron will render the stability of the π1 boratabenzene as less stable than that of benzene. In contrast to boratabenzene, the pyridinium (cation) represents the other side of the spectrum. To avoid purely reversing the statements already made above, a few general points will be noted. Boron and nitrogen are two elements (G13 and G15 respectively) that straddle carbon in the periodic table. Naturally, their electronegativity relative to carbon will be reversed. This impact this has on the π1 MO in pyridinium is a more pronounced contribution from the pz orbital on the electronegative nitrogen – resulting in distortion of the MO towards the ring heteroatom. The argument already made concerning relative stability of the π1 MO can be applied in this instance, with the MO on pyridininium being more stable than its benzene counterpart. Lastly, the π1 MO on borazine is very symmetric in nature and not dissimilar to that of benzene. Having previously considered the charge distribution of borazine, a comment can be made that the pz AOs on electronegative nitrogen atoms will carry more of the localised electronic charge. However, as the ring structure of the molecule alternates in the form B-N-B-N, this discrepancy in localised electron density (boron is electropositive relative to nitrogen, thus contributes less) at the pz AOs is not distinctly evident in the MO picture, rather smeared out across all 6 ring atoms. It is perhaps also worth noting the relationship in the π MOs between energy and the number of modes. The fully bonding π1 MO (above) has no nodes, π2 and π3 (HOMO) have one nodal plane, π4 and π5 (LUMO) have two nodes and lastly, the π6 has three nodes.
HOMO
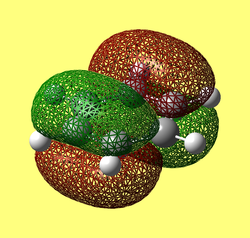
One will notice that both benzene and borazine exhibit degenerate HOMOs whilst boratabenzene and boratabenzene have single energy level at the highest occupancy. The degenerate HOMOs in benzene and borazine are the bonding π2 and π3 MOs that arise as a result of the high level of inherent symmetry present in their structures. For example, the π3 orbital (as labelled in Figure X) of benzene represents the bonding combination of 4 pz orbitals (relative to the plane, 2 in-phase on one side of the ring, 2 out-of-phase on the other). A similar point can be made for the π2 orbital in which 3 pz AOs either side of the ring form a bonding MO. These combinations of AOs to form bonding MOs is not observed in the cases of boratabenzene and pyridinium, in which the substitution of a ring carbon for a single heteroatom unsettles this degeneracy, on top of lowering the overall symmetry.
LUMO
Many of the observations made above for the HOMO across the four molecules hold true in considering the LUMO. The lowest unoccupied molecular orbital for both benzene and borazine are degenerate whilst the substitution of a ring carbon for a heteroatom disrupts this degeneracy and therefore overall symmetry – resulting in single LUMO in the cases of boratabenzene and pyridinium. The fact that the LUMOs for all four molecules are indeed “unoccupied” ties in to the inherent aromatic stability. No occupancy in the antibonding MOs eliminates any destabilisation that a molecule may experience otherwise (from filled LUMO or LUMO+1 MOs).
An interesting point worth considering for future study is the relative energy difference between HOMO and LUMOs in these compounds. This value is especially meaningful since this gap represents the energy required to promote and electron into an antibonding MO and thus to some extent governs the molecules’ reactivity.
Comparison of selected (relative) MO energies
| Molecular orbital | Benzene | Boratabenzene | Pyridinium | Borazine |
|---|---|---|---|---|
| Π(1) | -0.35999 | -0.13208 | -0.64064 | -0.36130 |
| HOMO | both -0.24691 | +0.01094 | -0.47885 | both -0.27590 |
| LUMO | both +0.00267 | +0.21469 | -0.25840 | both +0.02422 |
This table numerically confirms the points outlined above. Clearly, pyridinium's MOs are more stabilised relative to benzene and the opposite is true for boratabenzene. The values for benzene and borazine are distinctly similar.
MO Diagrams for benzene analogues
In terms of visualising what the MO diagrams boratabenzene, pyridinium and borazine would look like, the best place to start would be to consider the deviations from the benzene model that would be required for each molecule.
Atomic orbitals in LCAO approach
Constructing the MO diagram for benzene was straightforward in the sense that one was purely dealing with the combination of atomic orbitals originating from carbon and hydrogen. Moreover, the highly symmetric nature of D6h benzene, as alluded to on several occasions, results in a “tidy” set of MOs – both in terms of separation between energy levels and resultant electron distribution in the MOs. When considering the LCAO approach for boratabenzene and pyridinium, the basic AOs will not be as clear cut as in benzene. The addition of a heteroatom, brings up the question of size. The s and p orbitals of carbon will naturally be different to that of boron (larger) and nitrogen (smaller). This renders the respective contribution in AO overlap from each orbital to be different, and thus the resulting MOs will not be as symmetric as benzene. Similarly for borazine, whereby the ring consists of purely boron and nitrogen atoms, will result in an uneven distribution of energy levels. This arises due to the poor overlap of the respective orbitals in the LCAO approach on both atoms.
Energy of MOs
The resulting energies of the MO diagrams have been considered briefly in the “Comparison of selected (relative) MO energies” table. This shows that in general, the MOs on pyridinium will be stabilised, i.e. lower in energy, relative to benzene (for reasons previously mentioned) and that the opposite is true for boratabenzene. However, this does not mean that the ordering of the energy levels will remain as they were for benzene. For example, when considering the degenerate HOMO π 2 and π 3 energy levels in the MO diagram, a prediction can be made concerning the position of these two orbitals in the case of the addition of a heteroatom. For both boratabenzene and pyridinium, the degeneracy will be lost. In boratabenzene, both the π 2 and π 3 will be destabilised relative to benzene, with the π 2 orbital at a higher energy than the π 3. In pyridinium, both the π 2 and π 3 will be stabilised relative to benzene, with the π 2 orbital at a lower energy than the π 3.
Degeneracy of MOs
This point has been already touched on above. It is worth adding that degeneracy in MOs is a consequence of symmetry in molecules, thus one would expect D6h benzene to have more degenerate MOs than D3h borazine (or C2v boratabenzene and pyridinium for that matter).
Conclusion
The project carried out above clearly illustrates the advances in computational chemistry techniques in recent times. Today, we are at a stage where we can successfully optimise virtually any molecule, and from that generate a wealth of information as a comparison for experimental data. These techniques used, have allowed us to also visualise the bonding and antibonding MOs present in these molecules - thus providing valuable insight into the subsequent reactivity of these molecules.
It has been shown that borazine is truly similar on so many levels to benzene, and that the isoelectronic structures(relative to benzene) of boratabenzene and pyridinium also share many of the aromatic characteristics inherent in all four compounds.
References
- ↑ M. Schuurman, W. Allen, H. Schaefer, Journal of Computational Chemistry, 2005, 26, 1106
- ↑ J. Blixt et al., J. Am. Chem. Soc. , 117, 1995, pp 5089 - 5104
- ↑ M. Anatosov et al., J. Phys. Chem. , 105, 2001, pp 5450 - 5467
- ↑ C. Ballhausen, H. Gray, Inorg. Chem. , 1 (1), 1962, pp 111-122
- ↑ L. Pauling, J. Chem. Soc. A. , 69, 1947, pp 542
- ↑ L. Pauling, J. Chem. Soc. A. , 69, 1947, pp 542
- ↑ L. Pauling, J. Chem. Soc. A. , 69, 1947, pp 542
- ↑ H. Burgi et al., Angewandte Chemie, 34(13), 1995, pp 1454-1456
- ↑ R. Minyaev et al., Russ. Chem. Bull., Int. Ed. , 50(12), 2001, pp 2332
- ↑ P. Eaton et al., J.Am.Chem.Soc., 86(15), 1964, pp 3157-3158
- ↑ W. Harshbarger et al., Inorg. Chem., 8(8), 1969, pp 1683-1689
- ↑ R. Islas et al., Struct. Chem., 18, 2007, pp 833-839

