Rep:Mod:4815162342

Modeling free energy and thermal expansion of MgO
Like most compounds, crystalline MgO expands when it is heated. This is because the kinetic energy of the atoms increases leading to stronger bond vibrations and hence a larger average interatomic distance (i.e. equilibrium bond length). The expansion with temperature is be described by the coefficient of thermal expansion α, which was found computationally.
In the simplest approach a bond vibration can be seen as a harmonic oscillation following Hooke's law. Although this approach has it's limitations (discussed below) it works reasonably well at low temperatures. This approach can be used to compute all possible vibrations in the system and hence to determine the average cell volume. The system is optimized to maximize the free energy, thereby finding the most likely configuration. This is referred to as the quasi-harmonic approximation
A more sophisticated but computationally more complex approach is the use of molecular dynamics, which models atoms as spheres and aims to reproduce vibrations as they would occur in nature. Both models give similar results for lattice volume but different results for free energy due to computational differences.
Introduction
Structure
MgO exists in the halite structure (see figure 1). It's conventional unit cell is face centered cubic, with a MgO diatomic on every lattice point and the cell constant ac (length of one side). The primitive unit cell is a rhombohedron with an oxygen atom in the center and a Mg atom on every corner with the cell constant ap (length of one side).
Converting between primitive and conventional cell
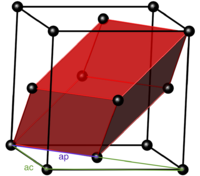
By examining the structure (see figure 2) it can be seen that:
hence
The volume of a rhombohedron with α = 60 ° is
Therefore (substituting ap for ac using relation 1.1.1 i)
Hence the volume of the conventional cell is 4 times that of the primitive cell.
Thermal expansion
Thermal expansion can be quantified using the coefficient of thermal expansion which describes the fractional change in volume with temperature. [1] For most compounds the coefficient will be positive as it expands with increasing temperature. Some compounds contract and hence will have a negative coefficient of thermal expansion.[2] For different conditions there are different coefficients of thermal expansion. Here the volumetric coefficient will be used at constant pressure although even if pressure isn't held constant the coefficient applies well to solids as pressure has little effect on a solid. It is defined as:
Rearranging and integrating gives:
By plotting ln(V) against T the slope will give αv.
Reciprocal lattice
In reciprocal space a position isn't described by a position vector r but by a wave vector k. Hence a point P in reciprocal space is a wave in real space (P=exp(-iQr) in real space). It is often useful to describe periodic structures, such as lattices, in reciprocal space.
The reciprocal lattice is the Fourier transform of a direct lattice and it is a function. The function is zero at any point except at lattice points. The reciprocal motif is the Fourier transform of the motif. The crystal structure is given by multiplying the reciprocal lattice with the reciprocal motif. [3]
The reciprocal lattice constant is:
Quasi-harmonic approximation
Harmonic phonon model
Monoatomic chain
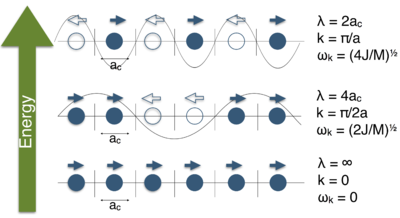
The quasi-harmonic approximation is based on the the assumption that a bond behaves like a spring that expands and compresses according to Hooke's law(1.3.1.1 i). If all particles oscillate uniformly this gives rise to a normal mode of vibration [4] . If two adjacent particles move in opposite directions their interatomic potential increases (Hooke's law: compressing or stretching a bond increases energy). Hence, a mode of vibration where all adjacent atoms move in opposite directions will be the highest possible energy state. A mode where all atoms move in the same direction is the ground state. Note that this is the absence of vibration as the relative distances don't change. This looks like a translation however, from the perspective of the system it is simply the absence of any motion which is expected at absolute zero (in classical mechanics, ignoring zero point energy). This can be compared to MO theory where the lowest energy combination of orbitals is that where all orbitals are in phase and the highest energy combination is that where the phases alternate. If a change in vibration direction is seen as a node like it is in the MO analog, a sine wave can be drawn through these nodes (see figure 3 ). The lowest energy state has no nodes hence an "infinite wavelength" while the highest energy state has wavelength of 2ac. This corresponds to the theory that wavelength is inversely related to energy. The amplitude is the intensity i.e. the magnitude of the displacement from the equilibrium position. In the wave model any vibration can be decomposed into normal modes of vibration (compare: Fourier transform). Hence, any vibration can be analyzed as the sum (constructive and destructive interference) of of normal modes. [5] These waves can be described by a quasi particle, the phonon.
The potential energy of one atom is a function of it's position with respect to all other atoms. To simplify this only neighboring atoms are considered to have an impact on an atoms potential energy.
The force, F, of the vibration can be given by Hooke's law:
where K = force constant (n.b. use of capital K to avoid confusion with wave vector k), x = displacement.
Since both neighbors are moving the change in distance between atom n and it's nearest neighbors n+1 and n-1 is best described as the difference in displacement (indicated by u). Therefore, using Hooke's law, the force is given by:
for the bond vibration between n and n±1
Considering both bonds:
According to Newton's law
hence
A solution for the equation of motion for a spring is: [6]
Treating displacement as superposition of traveling waves: [7]
where k is the wave vector defined as:
Substituting into equation 1.4.1.1 ii
Solving for ωk:
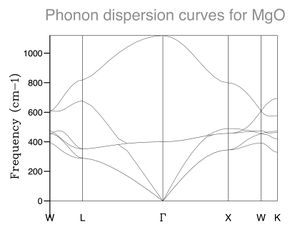
Plotting ωk against k gives the phonon dispersion (figure 4). This describes all possible modes of vibration and their frequencies. It does not describe how the system vibrates as it does not say anything about the probability of these vibrations occurring. For this the phonon density of states (DOS) is used. It gives the probability for each frequency (as a graph probability vs frequency). These two in combination describe the vibrations that actually occur in a system.
Diatomic chain

This model can be expanded to a diatomic chain of alternating atoms: every unit cell now contains 2 different atoms. The energy depends on two things: the vibration within the unit cell (if the atoms in the cell move out of phase the energy is increased) and the vibration between the cells (if two neighboring cells move out of phase the energy is increased). If two atoms within the cell move in phase this gives the lower energy acoustic branch (so called because sound travels with that speed in a solid). If they move out of phase this gives the higher energy optical mode (so called because these phonons are excited by IR). [8]
The energy is given by: [9]
where C is the spring constant
ω+2 gives the optical mode ω-2 gives the acoustic mode
The shape of the phonon dispersion graph for a diatomic chain looks a lot like that for a monoatomic chain where the second half of the curve was folded over. Phonon folding is another way to think of it. The possible vibrations are still the same as in the monoatomic chain just that the lattice constant is twice as large (treating both atoms to be the same size). Since it is not possible for half the modes of vibration to simply disappear and since the overall energy of the system has to be the same, the graph folds. In reciprocal space the new lattice constant is half the size of the old hence the reciprocal space graph will fold at a*/2=a*new (see below for more on reciprocal space).
This model can be expanded to any number N of different atoms per unit cell where the number of modes acoustic modes will be 3 (one longitudinal, 2 transverse) and the number of optical modes is given by 3N-3. Finally, this model can be expanded to describe a 3 dimensional lattice like MgO.
Quasi-harmonic approximation
In the harmonic model no change in lattice constant is described. While the lattice vibrates more at higher energies the harmonic phonon model assumes these vibrations are around an equilibrium value that doesn't change. Obviously, this is not what happens in reality since compounds change their lattice size as they are heated (usually they expand).
An extension of the harmonic phonon model is the quasi-harmonic approximation in which the phonon frequencies are seen as volume dependent.[10]
The Helmholtz free energy is given by:
where U is the internal energy, EZP is the vibrational zero-point energy
The zero-point energy equals:
where i is a phonon band, νk,i(V) is the frequency of a phonon (as a function of volume)
The entropy is given by:
Since F is a function of the vibrations and the vibrations are a function of the volume, V can be optimized to minimize free energy to find the preferred lattice volume at any given temperature.
Note that this approximation holds true at small displacements from equilibrium. However, as it treats atoms as particles and bonds as springs it ignores electronic and nuclear interactions. For strong vibrations (i.e. high temperature) this approximation fails as it is unable to describe bond breaking at large r and nuclear repulsion at small r. These considerations lead to the Lennard Jones potential.
Molecular Dynamics
Another approach of determining the behavior of the lattice with temperature is molecular dynamics. In molecular dynamics movements of atoms are simulated with the goal of making them move like they would in nature. A structure with initial atom positions (close to equilibrium position) is loaded.[11]The individual atoms are then randomly assigned an initial energy according to the Boltzmann distribution for that particular temperature. Then their forces and accelerations are computed. Each atom is allowed to move within a potential well (e.g. Lennard Jones potential) and transfer energy and momentum, with some restrictions. Here these restrictions are constant number of particles, external pressure and temperature (NPT ensemble). The velocities and position are then updated using:
where v = velocity, dt = time step and
where r = position This is done for a certain amount of time until average temperature and energy only fluctuate little. Therefore, some initial equilibrations steps are allowed before measuring.
The method used was Ewald summation which splits interactions into long and short range and computes them separately. Short range interactions are computed in real space whereas longer range interactions are computed as Fourier transform. Treating long range interactions in Fourier transform requires less processing power as energies converge faster. [12] Hence this method is useful for systems dominated by long range interactions (e.g. Coulombic interactions) such as crystals.
Program
The calculations were run using DL Visualize DL Visualize and GULP on Red Hat Linux.
Experimental considerations: For the quasi-harmonic approximation all calculations are performed on a primitive unit cell of MgO. It is therefore important to scale all extrinsic results appropriately. For the results and discussion all results will be scaled so that they describe a conventional unit cell hence output volume and energy for the quasi harmonic approximation will need to be multiplied by 4 (a unit cell has the volume of 4 primitive cells, see eq. 1.1.1 ii). To increase the resolution of the calculations shrink factors are used. In k space measurements are taken in intervals divided by the shrink factor i.e. if the shrink factor is 1 along one side of the lattice only one point will be sampled. If it is 2 two points will be sampled and so on. This is equivalent to constructing a grid of unit cells in real space i.e. if the shrink factor is 2 that is like placing two cells next to each other and measuring once in each cell. Increasing the shrink factors increases the accuracy of the results but also increases the computing power needed.
For the molecular dynamics calculations the program essentially solves Newton's laws numerally. Since the molecular dynamics simulation relies on the interactions between different atoms (and differently moving atoms) it is no longer appropriate to use only one primitive or even conventional unit cell. The calculations are therefore performed in a 2x2x2 MgO supercell. Volume and energy for the MD calculations will be divided by 8 to account for this.
Results and Discussion
Internal energy and lattice constant
The total internal energy of a conventional unit cell is -164.3012 eV with a lattice constant of a = 4.2119 Å which corresponds well to literature.[13]
Computing lattice vibrations
The phonon dispersion plot shows the expected 6 bands: 4 acoustic and 2 optical. Some of the acoustic bands are degenerate for most of the plot giving only 4 states at many points. As expected the highest and lowest energy states are at k = 0.
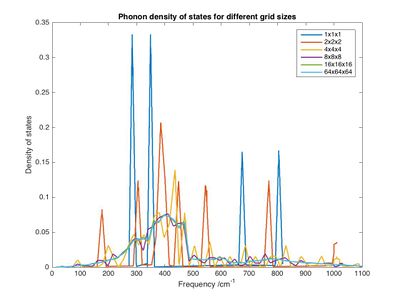
In the phonon density calculation using a 1x1x1 grid the point L (0.5, 0.5, 0.5) was taken. There are 6 vibrations and 4 states in total as both vibrations on the acoustic band are degenerate. This can be seen more clearly by looking at the far left or far right parts of the graph: 6 states (6 lines) can be seen for some points. Four of these lines merge to two (2 each) at point L indicating that the same number of modes still exist however, some are degenerate now. Increasing grid size shows that there are more than those 4 states however, the region around 300 cm-1 is still the most populated. The plot for 1x1x1 suggests that a few distinct states are occupied with a high probability while others aren't occupied at all, which is obviously not the case in a real crystal. A grid of 8x8x8 is the smallest possible grid that gives a good (realistic) approximation what's going on. As the distribution becomes broader the maximum probability (intensity of highest peaks) decreases strongly from 1x1x1 to 2x2x2 since the absolute probability of any state being occupied (i.e. the integral of the entire curve) has to remain unity. A phonon density near 0 is observed at 1100 cm-1 indicating that the highest energy state is sparsely populated. Another notable observation is that the most likely state is shifted to higher energies as the grid size increases while the average energy (appears to) remain the same. Whether it actually stays the same could be determined by finding the average value of the however, looking at the graph the mean frequency seems to lie just below 500 cm-1 for all curves (for 1x1x1 this is easy to find: two peaks at around 325 and 2 around 750, difference of 425. the ones around 300 are twice as large hence are weighted twice as much so ωaverage is around 325 + 1/3 * 425 = 467. For all others this can be estimated). The same can be seen in the phonon dispersion plot: the average y value at any point x is around 460 cm-1. This is because all the energy in the system is due to temperature (which is 300 K for all runs). What the program does is calculate a dispersion of phonons that correspond to this particular temperature. A possible expansion of the experiment would be to run this calculation again at a higher temperature (i.e. add more energy) to see if the graph does, as expected, undergo a blue shift without a large change in shape. The same could be accomplished by changing the masses or force constants (bond strength) involved in the system (equation 1.4.1.2 i). According to this equation the frequency is directly proportional to the force constant and indirectly proportional to the mass. This means a crystal with the same lattice points (i.e. halite structure) but different motif (e.g. CaO or NaCl) would show a similar phonon DOS but shifted along the x axis (note that the modes of vibrations are independent of motif). Another way to think of it is that all FCC structures have the same points in k space, the only difference between them is the spacing and the motive they are multiplied by. The spacing in CaO is slightly larger than for MgO (4.8 vs 4.2 ∠ [14]). For CaO the force constant will be similar to MgO hence the plot will undergo a shift to lower frequencies (indirectly proportional to mass, Ca heavier than Mg). For NaCl the case is more difficult: the reduced mass is higher but the force constant is going to be very different due to the difference in bonding. Assuming both bond ionically NaCl is expected to bond less strongly (indicated also by the much lower melting point) and hence have a lower force constant. This leads to the conclusion that the phonon DOS of NaCl is even further red shifted. The value of a changes too hence the curves would have different scales on the x axis.
Any crystal with similar lattice points will have a similar phonon DOS. A metal like lithium has a crystal structure as BCC which too gives a grid of atoms with constant spacing and 90 ° angles. The lithium lattice however only consists of one atom type which means no folding and hence no optic band will be observed. Otherwise, the plot will look similar. A crystal with completely different lattice points e.g. a Zeolite will have an entirely different phonon distribution and hence DOS.
The phonon dispersion plot simply gives all possible modes of vibration while the phonon DOS gives the probability of these occurring. Visualization of the phonons shows vibrations of the entire crystal.
Free energy
To find the best balance between accuracy and computational complexity free energy calculations were carried out using different shrink factors between 1x1x1 and 32x32x32. Going from 1x1x1 to 4x4x4 to 8x8x8 the free energy increases (the absolute value decreases). From then the free energy decreases (the absolute value increases) and converges. A grid of 2x2x2 is accurate to 1 meV, a grid of 4x4x4 is accurate to 0.5 meV and a grid of 8x8x8 is accurate to 0.1 meV. The optimal grid size would be appropriate for a similar oxide like CaO and possibly even for NaCl since the modes of vibration are the same. It would not be appropriate for a metal or zeolite. 32x32x32 requires noticeably more computational power whereas 16x16x16 takes only a few seconds to run. Although 8x8x8 would have been sufficient 16x16x16 was used for all following calculations since they still run fast enough.
Expansion and change in free energy with temperature
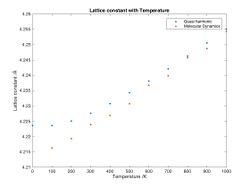
By calculating the phonon dispersion and optimizing the structure to minimize the Helmholtz free energy the most stable (hence most likely) structure at any given temperature can be found. Doing this at different temperatures gives an idea of how the lattice behaves when it is heated. As expected, it expands due to the increase in phonons (see figure 8).
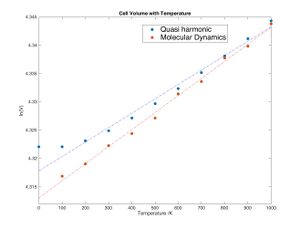
Using equation 1.2 ii it can be seen that a plot of ln(V) against temperature has a slope of α (see figure 9). Using the quasi harmonic approximation α is 2.5418*10 -05 K -1 with a R2 = 0.9875 indicating a reasonable but not great fit.
A literature value for the linear thermal expansion coefficient, αV, of 1.26 *10 4 for a range of 1000-1600 was found. Assuming that αV= 3 αL (equal expansion in all directions) the volumetric coefficient of thermal expansion should be 3.78 *10 4. [15]
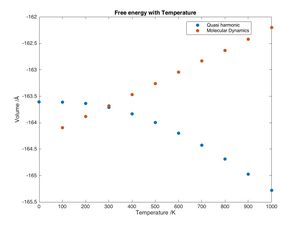
The quasi harmonic model predicts a non linear decrease of free energy with temperature (see figure 10). This is because the equation used to compute the Helmholtz free energy is 1.4.2 i (F = U + EZP - TS) which states that as temperature increases the entropic term becomes more negative hence F becomes smaller. This would suggest that the crystal becomes more stable as temperature increases which is not the case. Molecular dynamics provides a better explanation (see below).
The quasi harmonic model cannot predict the melting point. The model would predict the vibrations to get larger and larger and the cell volume to increase. When attempting a calculation at 3000K (just below the melting point) the program shows an error as the model breaks down.
Molecular Dynamics
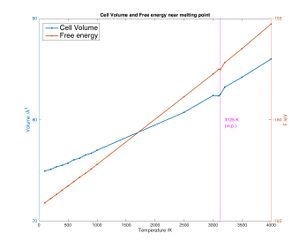
MD predicts a similar but slightly higher coefficient of thermal expansion: α = 3.0132 *10-5 K-1 with a R2 = 0.9956 indicating a much better fit. This is because MD is a more accurate way of modeling crystals. The atoms vibrate more at higher temperature and hence take up more space as they bump into each other.
Unlike the quasi harmonic model, molecular dynamics predicts the free energy of the lattice to increase. This is consistent with the fact that internal energy increases with temperature:
where kb = Boltzmann constant
As the temperature approaches the melting point molecular dynamics rightly a drop in cell volume indicating melting (breaking of the cell). However, going past the melting point the model keeps going linear which means that this model cannot be used to predict the behavior of liquid MgO (liquid simulation would be needed) (see fig. 11). However, the melting point can be found very accurately by looking for the small negative peak in the graph. The free energy decreases too due to the entropic contribution near the melting point as would be expected at a phase transition. In the plot, the free energy rises after the melting point. If the solid is seen as being "forced" to stay solid instead of wanting to become liquid, the free energy would of course rise (if a plot of free energy against temperature for liquid MgO was superimposed another line could be seen meeting at the melting point: below the melting point the solid gives lower free energy, above the melting point the liquid gives lower fee energy)
Shrink factors of 8x8x8 were found to be the lowest accurate shrink factors for the quasi harmonic computations hence MD calculations should be performed on an 8x8x8 supercell. However, given that MD computations require much more processing power it may not be feasible to perform these calculations on the computers used (note that going from 2x2x2 to 8x8x8 is a 64 fold increase in number of atoms and since atoms interact with each other in MD the increase in complexity would be very large).
Conclusions
Free energy and thermal expansion were computed two ways: using the quasi harmonic approximation which treats lattice vibrations as well defined waves and using molecular dynamics which treats vibrations as random movements of some total energy and aims to replicate the way they move in nature. In both calculations the volume of the cell is allowed to change. Both the quasi harmonic approximation and molecular dynamics showed that MgO expands when it is heated. Using the two methods coefficients of thermal expansion of 2.54 * 10-5 K-1 and 3.01 * 10-5 K-1 were found, with the molecular dynamics approach giving a better linear fit. Due to their difference in mathematical background they showed opposite trends for the change of free energy with temperature although very similar values are found at 300 K. While neither computational method was able to describe the melting process (in fact, the quasi harmonic model breaks down well before the melting point), MD was able to predict the melting point very accurately.
References
- ↑ D. L. Anderson, "Theory of the Earth", Blackwell Scientific Publications Boston, 1989
- ↑ Liu, Zi-Kui; Wang, Yi; Shang, Shun-Li. "Origin of negative thermal expansion phenomenon in solids". Scripta Materialia 65 (8): 664. doi:10.1016/j.scriptamat.2011.07.001.
- ↑ Lecture 2: Real and reciprocal lattices, http://ph.qmul.ac.uk/~anthony/spfm/2.html (accessed 20 November 2015)
- ↑ S.H. Simon, "The Oxford solid state basics", Oxford Univ Pr. Oxford, (1st ed. ed.) p. 82.
- ↑ VIBRATIONS IN CRYSTALS, http://physics-animations.com/Physics/English/phon_txt.htm (accessed Nov 15, 2015)
- ↑ Hooke’s Law and a Few Simple Lessons from Physics, https://www.math.ksu.edu/~dbski/calculus/hooke.pdf (accessed Nov 20 2015)
- ↑ Introduction to phonon calculations, http://www.mirrorservice.org/sites/downloads.sourceforge.net/p/ph/phonopy/phonopy%20documentation/introduction-phonon-calc.pdf (accessed Nov 19th, 2015)
- ↑ Quantised Lattice vibrations: Diatomic systems in 1-D and in Phonons in 3-D, http://www-sp.phy.cam.ac.uk/~wa14/camonly/statistical/Lecture12.pdf (accessed Nov. 18 1015)
- ↑ "2.1.3 Normal modes of a one-dimensional chain with a basis", Physics of Condensed Matter. Academic Press. pp. 44 ff.
- ↑ The Quasiharmonic Approximation, R. Wentzcovitch, University of Minnesota, http://www.vlab.msi.umn.edu/events/download/vlab_lectures/renata/lecture2_1.pdf, (accessed Nov 19 2015)
- ↑ http://www.ch.embnet.org/MD_tutorial/pages/MD.Part1.html
- ↑ H. Lee and W. Cai, Ewald Summation for Coulomb Interactions in a Periodic Supercell, Department of Mechanical Engineering, Stanford University http://micro.stanford.edu/mediawiki/images/4/46/Ewald_notes.pdf (accessed Nov 15)
- ↑ T. S. Bush,J. D. Gale: C. R. A. Catlow and P. D. Battle, Self-consistent Interatomic Potentials for the Simulation of Binary and Ternary Oxides, Journal of Materials Chemistry, 1994, 4(6), 831-837
- ↑ Calcium oxide (CaO) crystal structure, lattice parameters, thermal expansion, http://materials-static.springer.com/assets/sm_lbs/358/sm_lbs_978-3-540-31359-5_224/sm_lbs_978-3-540-31359-5_224.pdf?auth66=1447973685_1a0d71c93ca0382e60bbf3ec0d773e88&ext=.pdf (accessed Nov 15 2015)
- ↑ C.J. Engberg, E.G. Zehms, "Thermal Expansion of Al2O3, BeO, MgO, B4C, SiC, and TiC Above 1000°C", Journal of the american ceramic society, 1959 42
