Rep:Mod:3Loftus
Background
In module 3 we are looking into the characterisation of transition structures using computational methods. Specifically the Cope rearrangement mechanism and some examples of the Diels-Alder reaction were studied.
Cope Rearrangement Tutorial
Introduction

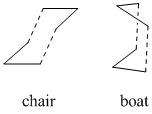
The Cope rearrangement is a specific example of a 3,3-sigmatropic rearrangement in 1,5-dienes. In this case I will be looking at the Cope rearrangement of 1,5-hexadiene shown in Fig 1. This reaction can proceed through either a boat or chair transition state also shown right, with the chair generally accepted as the lower energy pathway. In this tutorial section, the computational techniques and calculations which can be used to give optimised transition structures and energies will be used to analyse this reaction.
Results & Discussion
Reactant Structural Optimisation

Using GaussView 1,5-hexadiene was drawn in the anti-periplanar arrangement. There are, however, two possible conformations of this shown in Fig 3.[1] The one chosen to be minimised was a. as it has the double bonds furthest away from each other and will most likely have the lowest energy. This structure was then cleaned and optimized using HF method and 3-21G basis set, which is reasonably low level. *Opt refers to the structure having been optimised

The summary of the file is shown in Fig 4. and the energy can be seen as - 231.69254 a.u. which is equal to -608308.66 kJ/mol. The .out file was then opened and the symmetry determined using the symmetrize function, which gave Ci point group.
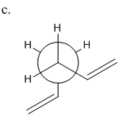
A gauche form shown right was then drawn in GaussView and optimised in the same manner as above, using HF/3-21G. It was expected that this conformation would have a higher energy than the anti arrangement as the two large C=C groups are further apart in the anti arrangement reducing the steric hindrance and, hence lowering the energy.
The optimised structure had energy -608306.02 kJ/mol (-231.69153 a.u.) and the point group was found as C2. In comparison with the anti product a. the energy is not as low, the difference being ~2 kJ/mol in favour of the anti conformation, which is what was predicted, although the difference is very small.
After looking at the energy of the above two optimisations, I expected the lowest energy conformation of 1,5-hexadiene to be still be an anti conformer. I therefore tested the other anti conformer (b.) to see whether it was lower than a.
After optimisation using the same HF/3-21G calculation the energy of b. was found to be -608308.84 kJ/mol (-231.69260 a.u.) with a C2 point group. This energy is 0.18 kJ/mol less than a. and I therefore assumed this to be the lowest energy conformation.
The data obtained above and comparisons with appendix 1 from the guide, are shown tabulated below.
| Conformer | Point Group | Energy / a.u.** | Energy / kJ mol-1 | Appendix Energy / a.u. | Difference / a.u. |
|---|---|---|---|---|---|
| Ci | -231.69254 | -608308.66 | -231.69254 | 0.00000 | |
| C2 | -231.69260 | -608308.84 | -231.69260 | 0.00000 | |
| C2 | -231.69153 | -608306.02 | -231.69153 | 0.00000 |
** Optimisations carried out using HF/3-21G
After looking at the comparison, the lowest energy conformer was actually shown to be gauche #3. I therefore also drew and optimised this structure to check for myself and indeed it was lower in energy than the rest, with a value of -231.69266 a.u. The difference is extremely small and a possible reason for this is that orbital overlap is causing stabilisation, as sterically the gauche form should not be lower.
The Ci anti #2 conformer (a.) which was first optimised using HF/3-21G was then sent for further optimisation, using a different method, and higher level basis set. They were, B3LYP/6-31G(d). The change in energy is shown below. Output: File:1,5Hantiopt631gd.out
| Optimisation of a. | ||
|---|---|---|
| Calculation Method | Energy / a.u. | Energy / kJ mol-1 |
| -231.69254 | -608308.66 | |
| -234.61170 | -615972.93 | |
| Difference / kJ mol-1 | -7664.27 | |
By comparing the two 3D models, I could see very little change in the geometry of the structure after using the different method and higher level basis set. However the energy difference is quite large most recent calculation, reducing the energy by a further ~7700 kJ/mol.
Reactant Vibrational Analysis
Frequency analysis was then carried out on the B3LYP/6-31G(d) structure, using the same basis set and method. The outputted file was then opened in wordpad and the low frequencies examined to ensure that the were no imaginary frequencies (negative frequencies). This part of the .out file is pasted below.
    Full mass-weighted force constant matrix:
     Low frequencies ---  -18.6405  -11.7164   -0.0006    0.0006    0.0010    1.8370
     Low frequencies ---   72.7305   80.1448  120.0231
     Harmonic frequencies (cm**-1), IR intensities (KM/Mole), Raman scattering
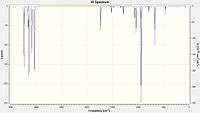
As we can see, the low frequencies are all positive, with the lowest being 72 cm- 1. The IR spectrum is also shown in Fig 6.
The results file was again opened and the following data noted, as shown below.
- Sum of electronic and zero-point Energies
- Sum of electronic and thermal Energies
- Sum of electronic and thermal Enthalpies
- Sum of electronic and thermal Free Energies
     Sum of electronic and zero-point Energies=           -234.469212
     Sum of electronic and thermal Energies=              -234.461856
     Sum of electronic and thermal Enthalpies=            -234.460912
     Sum of electronic and thermal Free Energies=         -234.500821
All of these values are quoted in a.u.
Transition Structure Optimisation
Chair
The chair transition state was optimised using two different methods, force constant matrix and frozen co-ordinate.
Force Constants Method
|
|
To compute the first method (Method 1), a CH2CHCH2 fragment was first drawn in GaussView and then copied and pasted to give two identical fragments. Each of these was then arranged to give the approximate chair conformation shown right with approximate terminal end distances of ~2.20 Å. This was also saved as a template for further calculations.
This structure was then optimised and frequency analysed by setting the job type to Opt+Freq, and then setting the optimisation to a TS (Berny) where Berny is a specific algorithm used to compute the transition state. Force constants were also calculated once and Opt=NoEigen added to the addition keywords which prevents the calculation crashing if >1 imaginary frequencies are found. The method and basis sets which were used are HF and 3-21G respectively. Output: File:CHAIRTSOPT.LOG
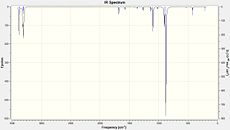
The resulting structure was then checked by looking for the expected imaginary frequency at -818 cm-1. This is also animated right.
Redundant Coord Editor
The second method (Method 2) which involved freezing the co-ordinates was then used. To compute this first, the approximate chair conformation from before was copied and pasted to allow it to be edited for this new method. From this starting point, using the redundant coord editor the positions of the two terminal carbons which are involved in bond formation/breaking were selected and set to be frozen at 2.20 Å apart. This was then repeated for the similar carbons found on the opposite side of the molecules, giving the end result of each set of two carbons being frozen 2.20 Å from each other.
This "frozen" structure was then optimised as if normal using HF/3-21G. The additional line Opt=ModRedundant was already included by the software after the bond co-ordinates were frozen.
The next step was using the optimised structure that had just been calculated, again using the redundant coord editor the bonds which were previously frozen, were this time set to derivative instead of freeze co-ordinate. The optimisation was then carried out similarly to the first computation using Opt+Freq with HF/3-21G and optimising to a transition state (Berny), however, this time not calculating the force constants and finally adding Opt=NoEigen to the additional keywords. File:CHAIRTSOPTFROZEN2.LOG
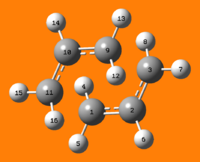
The results of these two methods can be shown tabulated below. Including 3D visualisations of each.
| Bond Length / Å | Bond Length / Å | Difference | |
| C1-C11 | 2.02106 | 2.02073 | 0.00033 |
| C3-C9 | 2.02060 | 2.02070 | 0.00010 |
Comparing the geometries of each, there is almost no visible difference between the two. To the naked eye each optimised structure appeared essentially the same. Looking more analytically at the difference in bond lengths between the bond forming/breaking carbons it is also clear that each optimisation produced very similar results. This is due to the difference between the bond lengths being in the order of ~0.0003 Å at most, which is ~0.01 % of the total bond length and hence very small.
Boat
QST2

The QST2 method was then used to optimise the boat transition structure. This method works by interpolating between the given reactants and products.
The first step to carry out this method out, was to start with the HF/3-21G optimised structure of a. and copy it into a additional molecule group, giving the reactant in window one and the product in the second. The pasted product had the same arrangement of carbons as the reactant due to it being pasted and it was therefore necessary to re-label the atoms so that they represent the result of a Cope rearrangement reaction. An image of this is shown in Fig 10.

This structure was then sent to be optimised to a transition state and frequency analysed using Opt+Freq [TS(QST2)] and the same HF/3-21G method and basis set. This, however, did not provide a suitable solution to the optimised transition state, as it did not take into account any rotation in the bonds. Therefore to allow this form of optimisation to work the reactants and products were then edited so that they were already similar to the transition state we were looking at.

This involved firstly changing the dihedral angle between carbons 2,3,4,5 from -180.0° to 0.0°. The angle between carbons 2,3,4 was edited from 111° to 100°, and then repeat for carbons 3,4,5. All of these changes were then also carried out on the product, however, as it is the opposite the negative signs are reversed for angle changes. This was then sent to be optimised exactly the same as above. The result of this second attempt at an optimisation was closer than the first although it still failed.
It was therefore assumed that the current structures were not close enough to the transition state and therefore a final edit was made. The dihedral angle between carbons 3,4,5,6 and similarly 1,2,3,4 on the reactant, were edited from 115.0° to 100.0°, keeping carbons 3 and 4 fixed during the rotation. This had the effect of moving carbon 6 and 1 closer together, and the result is shown. This final structure was then sent to be optimised to a transition state and frequency analysed as before, and a result was obtained. Output: File:QST2NUMBMODDIHED.LOG
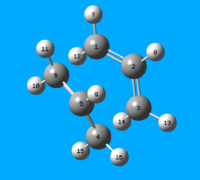
The optimised transition state is shown, along with the imaginary frequency of vibration at -840 cm-1 in Fig 13. Some bond distances of the optimised boat transition state have also been tabulated for reference.
| Bond Length / Å | |
| C1-C6 | 2.14 |
| C3-C4 | 2.14 |
Intrinsic Reaction Co-ordinate (IRC)
The IRC method is a way to find the local minimum on a PE surface starting from a transition state. It is completed in essence by taking snapshots of the geometry as the calculation moves down the slope towards the minimum. This is useful as it can show the geometry from which the transition state most likely forms by working backwards from the transition state.
This calculation was used to find the conformation of 1,5-hexadiene which leads to the transition state in the Cope rearrangement. As we have seen above, there are many possible conformations and it is interesting to find from which one the TS forms.
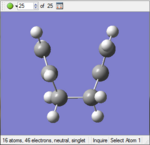
Starting from the HF/3-21G optimised chair transition state the calculation was first set up using Gaussian as a IRC job type, the direction was set to forward which is fine as the reaction co-ordinate in this case is symmetrical. The force constants were set to calculate once and the number of computation points set to 50 giving it enough points to find the minimum. This calculation was then submitted and the output file analysed. Immediately after opening GaussView stated that the job did not terminate normally, which indicated that the IRC method did not find a minimum. The final geometry is shown in Fig 14., which also shows the number of calculated steps as 25 (top left corner).
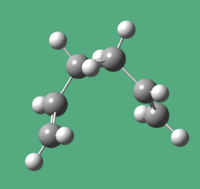
The calculation was then re-ran with the force constants set to recalculate at every 3 points and the number of computational points increased to 150. This time, a minimum was found, as shown by the image and Jmol right, taking 45 steps. Note: right click the Jmol window and select animation, play to view the change in geometry. File:ChairtsoptIRCFC150.out
The final geometry shown was compared to the appendix supplied, which indicated that the conformation was in fact gauche 2. This is not the lowest energy conformation although it is reasonably close.
Activation Energies & Energy Comparisons
Both the boat and chair TS were re-optimised and frequency analysed, to a TS(Berny) using B3LYP/6-31G(d) as it is generally far more accurate. Comparisons between the two levels of calculation for each value are tabulated below.
| Electronic / a.u. | |||
|---|---|---|---|
| HF/3-21G | B3LYP/6-31G(d) | Difference / a.u. | |
| Chair | -231.61932243 | -234.55698303 | -2.9376606 |
| Boat | -231.60280245 | -234.54309304 | -2.9402906 |
| a. (anti #2) | -231.69253528 | -234.61170280 | -2.9191676 |
| Sum of electronic and zero-point energies / a.u. | |||
| HF/3-21G | B3LYP/6-31G(d) | Difference / a.u. | |
| Chair | -231.466701 | -234.414929 | -2.948228 |
| Boat | -231.450925 | -234.402339 | -2.951414 |
| a. (anti #2) | -231.539539 | -234.469212 | -2.929673 |
| Sum of electronic and thermal energies / a.u. | |||
| HF/3-21G | B3LYP/6-31G(d) | Difference / a.u. | |
| Chair | -231.461341 | -234.409008 | -2.947667 |
| Boat | -231.445295 | -234.396005 | -2.95071 |
| a. (anti #2) | -231.532566 | -234.461856 | -2.92929 |
It is clear that the B3LYP/6-31G(d) method is far more accurate than HF/3-21G as all of the energy values are lower in the B3LYP/6-31G(d) calculation. Comparing the geometries however, It was found that there is almost no visible difference between each, which showed that only small changes in shape can lead to large energy changes.
| Activation energy (0 K) / kcal mol-1 | |||||
|---|---|---|---|---|---|
| HF/3-21G | B3LYP/6-31G(d) | Literature | Difference (HF) | Difference (B3LYP) | |
| Chair | 45.71 | 34.06 | 33.5 ± 0.5 | 12.21 | 0.56 |
| Boat | 55.61 | 41.96 | 44.7 ± 2.0 | 10.91 | 2.74 |
The activation energies were calculated by taking the sum of electronic and zero-point energies of the reactant (a.) from the same value for the transition state. They were then converted from a.u. to kcal/mol. 1 a.u. = 627.509 kcal/mol
Again we can see that compared to the literature values the B3LYP/6-31G(d) method and basis set are much more accurate than HF/3-21G. Comparing the calculated activation energy values using B3LYP/6-31G(d) and literature, they are very close. This shows that with this level of accuracy good results may be obtained from computation methods whcih match closely with nature. If the results were a slightly more accurate then they could have fallen within the precision of the literature measurements which would be even more encouraging. This may be possible with more accurate basis sets.
Diels-Alder Cycloaddition Reactions
Introduction
The Diels-Alder reaction is a specific 4π+2π cylcoaddition reaction, between a conjugated diene and a dieneophile. The reaction involves the movement of six electrons in a cyclic manner and is therefore stabilised by some degree of aromaticity.
In these reactions bonds are formed from the overlap of π orbitals on the diene and the dienophile. Whether the reaction is allowed or forbidden depends on the symmetry of the two orbitals being the same or different. If they are of the same symmetry then, the reaction is allowed and visa versa.[2].
Results & Discussion
cis-Butadiene & Ethene
MO's
Cis-butadiene and ethene were each separately drawn in GaussView and then optimized using AM1 semi empirical method. The HOMO and LUMO of each were then visualised and are shown below.
| Cis-Butadiene | Ethene | |||
|---|---|---|---|---|
| HOMO | LUMO | HOMO | LUMO | |
 |
 |
 |

| |
| Symmetry | antisymmetric | symmetric | symmetric | antisymmetric |
As we can see from the MO's only the LUMO of cis-butadiene may interact with the HOMO of ethene or the LUMO of ethene with the HOMO of cis-butadiene. These are the two pairs of interactions which have the same symmetry making them allowed as there will be sufficient overlap density.
Transition Structure
Optimization and Frequency Analysis

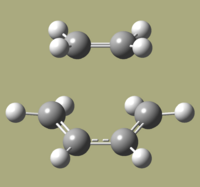
The transition state was achieved by copying and pasting the two structures into a new GaussView window, and then arranging them to give the approximate TS structure. As shown in Fig 16.
This was then optimised to a TS using the force constants method. The calculation was set as Opt+Freq to a TS(Berny) calculating force constants once with the semi-empirical AM1. The additional keywords Opt=NoEigen were used to prevent the calculation from crashing if >1 imaginary frequencies were found. This structure once converged was then re-optimized using B3LYP/3-21G method and basis sets with all other parameters kept the same. Output: File:CisethTSOPTFREQCL.out
It was confirmed that a TS was found by visualising the vibrational analysis, which showed one imaginary frequency at -481 cm-1 with bond forming/breaking movements which are synchronous, as expected for a Diels-Alder reaction. In comparison to the next lowest positive frequency the vibration is definitely not bond forming as the displacement is not in the direction of bond formation.
| Parameter | |
|---|---|
| Energy / a.u. | -233.27473 |
| Imaginary Vibration / cm-1 | -481 |
| C4-C11 / Å | 2.29 |
| C3-C12 / Å | 2.29 |
Typical sp3 (C-C) and sp2 (C=C) bondlengths are 1.54 Å and 1.34 Å respectively, while the Van der Waals radius of a carbon atom is 1.71 Å.[3] The measured C=C bond lengths of the TS are 1.38 Å and the C-C 1.41 Å. The fact that the C=C bond length is longer than usual indicates that it is in transition between forming single C-C bonds. The shorter than normal C-C bond indicates that it has some double bond character which is to be expected in the transition structure. The terminal carbon seperation of 2.29 Å is less than double the VDW radius of C (3.42 Å) showing that the structures are close enough for the orbitals to interact.
IRC
|
|
An IRC was also carried out on the optimized TS to show the progress of the reaction. The IRC was calculated in both direction, force constants being recalculated every 3 points with the number of points set to 150. The method and basis sets were again B3LYP/3-21G. As the IRC was calculated in both directions, we also see the ethene moving apart from the cis-butadiene, this is not useful and hence only the later part of the animation should be considered. Note: right click the Jmol window and select animation, play to view the change in geometry. Output: File:CisethTSOPTIRC.out
MO's
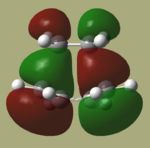
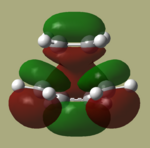
The HOMO and LUMO of the optimized TS are shown below.
| HOMO | LUMO |
|---|---|
 |
 |
| Antisymmetric | Symmetric |
By comparing these MO's with the HOMO's and LUMO's of the two reactants, It can be seen that in this reaction, the HOMO is formed from the HOMO of cis-butadiene interacting with the LUMO of ethene as all are antisymmetric. The LUMO of the TS is therefore formed from the interaction between the symmetric LUMO of cis butadiene and the HOMO of ethene. The reaction is hence allowed, because the HOMO and LUMO as described above have the same symmetry providing good interaction between the orbitals.
Cyclo-1,3-hexadiene and Maleic Anhydride
Introduction
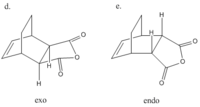
The reaction between maleic anhydride and cyclo-1,3-hexadiene is another example of a classic Diels-Alder reaction. Unlike the latter, however, there is now the possibility of forming two products rather than one. These are termed the endo and exo products, and are shown right.
MO's
Cyclohexadiene and maleic anhydride were each separately drawn in GaussView and then optimized using AM1 semi empirical method. The HOMO and LUMO of each were then visualised and are shown below.
| Cyclo-1,3-hexadiene | Maleic Anhydride | |||
|---|---|---|---|---|
| HOMO | LUMO | HOMO | LUMO | |
 |
 |
 |

| |
| Symmetry | antisymmetric | symmetric | antisymmetric | antisymmetric |
As we can see, the cyclohexadiene HOMO and LUMO are antisymmetric and symmetric respectively. While the maleic anhydride has a HOMO and LUMO which are both antisymmetric. This should mean that only the HOMO of cycloheaxadiene will be able to interact with the maleic anhydride as it is the only MO with the correct symmetry.
Transition Structure
Optimization and Frequency Analysis
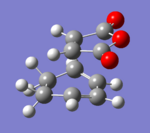 |
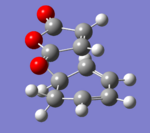 |
The transition state was achieved by copying and pasting the two structures into a new GaussView window, and then arranging them to give the approximate TS structures. As shown in Fig 22-23.
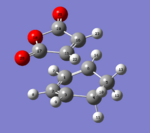 |
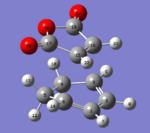 |
This was then optimised to a TS using the force constants method. The calculation was set as Opt+Freq to a TS(Berny) calculating force constants once with the semi-empirical AM1. The additional keywords Opt=NoEigen were used to prevent the calculation from crashing if >1 imaginary frequencies were found. This structure once converged was then re-optimized using B3LYP/3-21G method and basis sets with all other parameters kept the same. Output: File:Mc2.out (endo) Output: File:Mc3.out (exo)
The energy and some bond lengths are tabulated below.
| Parameter | Difference | ||
|---|---|---|---|
| Energy / a.u. | -609.32100 | -609.31631 | 0.00469 |
| Imaginary Vibration / cm-1 | -360 | -377 | 17 |
| C3-C16 / Å | 2.32 | 2.35 | 0.03 |
| C6-C15 / Å | 2.32 | 2.34 | 0.02 |
It would usually be expected that the exo TS would be lower in energy and hence more stable than the endo as this conformation reduces steric clashing between the large O groups on maleic anhydride and the upward pointing hydrogens on cyclohexadiene. This however is not the case as we see that the endo product is more stable by 0.00469 a.u. This effect is most likely due to secondary orbital overlap which can help to stabilise the TS.
Looking at the imaginary vibrations, both are synchronous and bond forming as expected showing that a transition state has indeed been found. The bond lengths are quite similar for both conformers as well which is expected.
MO's
The HOMO's and LUMO's of the exo and endo optimized TS are shown below.
| endo | exo | |||
|---|---|---|---|---|
| HOMO | LUMO | HOMO | LUMO | |
 |
 |
 |

| |
| Symmetry | antisymmetric | antisymmetric | antisymmetric | antisymmetric |
As expected all of the HOMO's and LUMO's are antisymmetric as this was the only interaction which was allowed. This shows that it is the HOMO of cyclohexadiene which is interacting with the LUMO of maleic anhydride. The secondary orbital overlap which stabilises th endo conformation in preference to the exo can be found between HOMO π* orbital of the C=O bond overlapping with some of the delocalised LUMO C-C orbitals on the cyclohexadiene.[4] This overlap is not possible in the exo conformation as the orbitals are not close enough to each other and hence only the endo product is stabilised.
References
- ↑ B. G. Rocque, J. M. Gonzales, H. F. Schaefer, Molecular Physics, 2002, 100 4, 441 -446
- ↑ R. Hoffman, R. B. Woodward J. A. Chem. Soc., 1965, 9, 2046 - 2048 DOI:10.1021/ja01087a034
- ↑ S. J. Stuart, M. T. Knippenberg, O. Kum, P. S. Krstic, Phys. Scr., 2006, T124, 58 - 64 DOI:10.1088/0031-8949
- ↑ J. I. Garcia, J. A. Mayoral, L. Salvatella, Acc. Chem. Res., 2000, 33, 658 - 664 DOI:10.1021/ar0000152
