Rep:Mod:323
Module 3
This Module uses Gaussian to identify transition state structures in such reactions as the Diels-alder and the Cope rearrangement forming the chair and boat structures. Several problems were encountered in these exercises, which involved a great degree of problem solving.
Cope Rearrangement Tutorial
A.P.P Conformation Optimisation
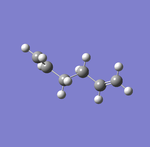
The first problem tackled was optimising 1,5-hexadiene to produce an anti-linkage. In order to achieve an anti conformation after optimisation the starting conformation must look similar to an anti linkage, otherwise a gauche conformation will be obtained. The fully optimised molecule file is given below:
Supporting evidence is shown below which shows that the optimised molecule fully converged and appropriate enrgies and point groups were found:
| File Name | checkpoint(1) |
| File Type | .fch |
| Calculation Type | FOPT |
| Calculation Method | RHF |
| Basis Set | 3-21G |
| Charge | 0 |
| Spin | Singlet |
| E(RB3LYP) | -231.69260236 a.u. |
| RMS Gradient Norm | 0.00000972 a.u. |
| Imaginary Freq | |
| Dipole Moment | 0.2019 Debye |
| Point Group | C2 |
        Item               Value     Threshold  Converged?
Maximum Force            0.000014     0.000450     YES
RMS     Force            0.000005     0.000300     YES
Maximum Displacement     0.000725     0.001800     YES
RMS     Displacement     0.000228     0.001200     YES
Predicted change in Energy=-1.334148D-08
Optimization completed.
-- Stationary point found.
Upon inspection of the Energy and the point group it is clear that the conformation obtained is the anti 1 conformation[1]. This is the lowest energy 'anti' conformation.
| Image | Point Group | Energy (a.u.) | Relative Energy (kcal/mol) | Newman Projection |
|---|---|---|---|---|
 |
-231.69260236 | 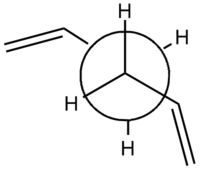
|
The low energy nature of this conformation can be rationalised by sterics as the two alkene groups are in an anti periplanar conformation with each other. This minimises the repulsive steric interaction between them and stabilises the conformation, hence producing a low energy conformation.
Gauche Conformation Optimisation
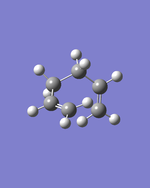
The next optimised conformation looked to be produced was a gauche conformation, again like with the anti conformation to produce a gauche conformation the starting molecule had to look similar to the desired optimised output. This was successfully completed with the optimised gauche conformation file given below:
Supporting evidence showing that the optimisation has converged and that appropriate energies and point group were obtained:
| File Name | checkpoint |
| File Type | .fch |
| Calculation Type | FOPT |
| Calculation Method | RHF |
| Basis Set | 3-21G |
| Charge | 0 |
| Spin | Singlet |
| E(RB3LYP) | -231.68771613 a.u. |
| RMS Gradient Norm | 0.00001461 a.u. |
| Imaginary Freq | |
| Dipole Moment | 0.455 Debye |
| Point Group | C2 |
        Item               Value     Threshold  Converged?
Maximum Force            0.000019     0.000450     YES
RMS     Force            0.000007     0.000300     YES
Maximum Displacement     0.000625     0.001800     YES
RMS     Displacement     0.000163     0.001200     YES
Predicted change in Energy=-2.589025D-08
Optimization completed.
Looking at the energy obtained and the point group this is the gauche 1 conformation[1]. This is the highest energy gauche conformation. This is not surprising as the two terminal carbons are inward facing which will provide some steric strain. In order to relieve some of the steric strain the 2 terminal carbons are 3.51Å away from each other. The bond angle of the sp3 carbons next to the terminal carbons are 107°, this is slightly less than the desired sp3 angle of 109° which may show some strain, however this is most likely negligible. The repulsive steric interactions can clearly be shown in the Newman projection below:
| Image | Point Group | Energy (a.u.) | Relative Energy (kcal/mol) | Newman Projection |
|---|---|---|---|---|
 |
--231.68771613 | 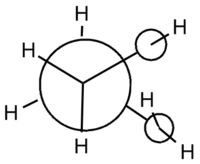
|
Lowest Energy Conformation Optimisation
When considering the lowest energy conformation of 1,5-hexadiene the anti 1 structure would seem to be very close to the lowest energy conformation as it has less steric repulsion than the gauche conformation. However one gauche form surprisingly shows the lowest energy, the conformer was optimised and the file is given below:
Supporting evidence showing the energy and that the molecule optimisation converged is given below:
| File Name | checkpoint(34) |
| File Type | .fch |
| Calculation Type | FOPT |
| Calculation Method | RHF |
| Basis Set | 3-21G |
| Charge | 0 |
| Spin | Singlet |
| E(RB3LYP) | -231.69266115 a.u. |
| RMS Gradient Norm | 0.00002546 a.u. |
| Imaginary Freq | |
| Dipole Moment | 0.3402 Debye |
| Point Group | C1 |
        Item               Value     Threshold  Converged?
Maximum Force            0.000048     0.000450     YES
RMS     Force            0.000014     0.000300     YES
Maximum Displacement     0.001430     0.001800     YES
RMS     Displacement     0.000372     0.001200     YES
Predicted change in Energy=-8.886924D-08
Optimization completed.
   -- Stationary point found.
This is the gauche3 conformation[1]. The lowest energy conformation being gauche is due to an attractive overlap with the π orbital and a vinyl proton[2]. This interaction along with the gauche form being less sterically repulsive than some others allows this to be the lowest energy form. This is shown in the table below:
| Image | Point Group | Energy (a.u.) | Relative Energy (kcal/mol) | Newman Projection |
|---|---|---|---|---|
 |
-231.69266115 | 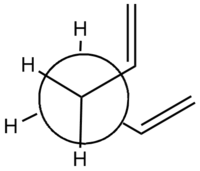
|
Anti 2 optimisation
The anti2 optimisation was the next to be produced, the molecule was optimised successfully with the file given below:
The supporting evidence is given below and shows that the optimisation ran to completion and converged:
| File Name | checkpoint(2) |
| File Type | .fch |
| Calculation Type | FOPT |
| Calculation Method | RHF |
| Basis Set | 3-21G |
| Charge | 0 |
| Spin | Singlet |
| E(RB3LYP) | -231.69253516 a.u. |
| RMS Gradient Norm | 0.00004313 a.u. |
| Imaginary Freq | |
| Dipole Moment | 0.0000 Debye |
| Point Group | Ci |
        Item               Value     Threshold  Converged?
Maximum Force            0.000110     0.000450     YES
RMS     Force            0.000022     0.000300     YES
Maximum Displacement     0.000634     0.001800     YES
RMS     Displacement     0.000235     0.001200     YES
Predicted change in Energy=-1.327338D-07
Optimization completed.
   -- Stationary point found.
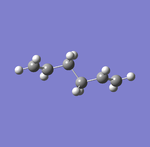
The energy and point group correspond with the data given in the reference table. The relative energy difference between the two optimised anti conformations is 0.04 kcal/mol, this difference is almost negligible when compared with the relative energy of the gauche 1 conformation. The table below shows the information clearly:
| Image | Point Group | Energy (a.u.) | Relative Energy (kcal/mol) | |
|---|---|---|---|---|
 |
-231.69253516 | 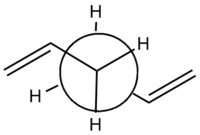
|
6-31G(d) Optimisation
In order to achieve a more realistic result for the anti2 conformation the molecule was re-optimised using a better basis set, that of 6-31g(d). The successfully optimised anti2 file is given below:
The supporting evidence showing that the optimisation ran successfully is given below:
| File Name | checkpoint(3) |
| File Type | .fch |
| Calculation Type | FOPT |
| Calculation Method | RB3LYP |
| Basis Set | 6-31G(d) |
| Charge | 0 |
| Spin | Singlet |
| E(RB3LYP) | -234.61170273 a.u. |
| RMS Gradient Norm | 0.00001299 a.u. |
| Imaginary Freq | |
| Dipole Moment | 0.0000 Debye |
| Point Group | Ci |
        Item               Value     Threshold  Converged?
Maximum Force            0.000016     0.000450     YES
RMS     Force            0.000006     0.000300     YES
Maximum Displacement     0.000215     0.001800     YES
RMS     Displacement     0.000079     0.001200     YES
Predicted change in Energy=-1.572603D-08
Optimization completed.
   -- Stationary point found.
Upon re-optimisation of the anti 2 conformation there was a change in energy from -231.69253516 a.u. to -234.61170273 a.u., this is a large change in energy (1832 kcal/mol), this is not surprising as a better basis set has been used which will give a more accurate optimisation and hence a more accurate energy of the conformer. The difference in energy is not very useful as molecules optimised with different basis sets should not really be compared. The geometry of the re-optimised anti 2 has not changed very much and still has Ci symmetry.
Frequency of Anti 2
The frequency of the anti2 conformation was next to be studied the file provided below:
There are no imaginary frequencies which what is to be expected from a molecule optimised to a minimum energy (unlike a transition state which would give an imaginary frequency (displayed as a negative frequency).
Low frequencies ---  -18.8360  -11.7255   -0.0009   -0.0007   -0.0003    1.7210
Low frequencies ---   72.7084   80.1375  120.0085
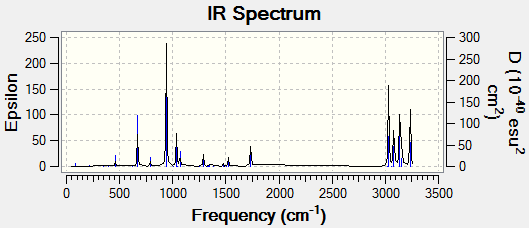
The IR spectrum, shows the expected peaks with strong C-H stretches shown in the 3000cm-1 region.
Thermochemistry
Energy data is shown below which will be used later in activation energy calculations.
Sum of electronic and zero-point Energies=           -234.469212 a.u.
Sum of electronic and thermal Energies=              -234.461856 a.u.
Sum of electronic and thermal Enthalpies=            -234.460912 a.u.
Sum of electronic and thermal Free Energies=         -234.500822 a.u.
Optimising Chair and Boat Transition Structures
Allyl Fragment Optimisation
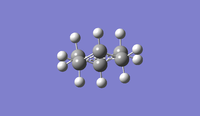
The allyl fragment was produced first and optimised this is a relatively straight forward exercise and no problems were encountered. The allyl fragment can used to create chair and boat transition structures (when two fragments are positioned with the right geometry). The successfully optimisation file is given below:
The supporting evidence is given below, showing that the optimisation successfully converged:
        Item               Value     Threshold  Converged?
Maximum Force            0.000048     0.000450     YES
RMS     Force            0.000018     0.000300     YES
Maximum Displacement     0.000143     0.001800     YES
RMS     Displacement     0.000070     0.001200     YES
Predicted change in Energy=-1.277266D-08
Optimization completed.
   -- Stationary point found.
Chair Optimisation and Frequency
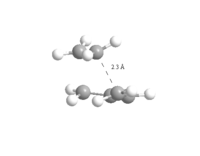
The Chair transition structure was built using two optimised allyl fragments with terminal carbons that were approximately 2.2Å apart. No problems were encountered tackling this exercise either, a successful chair optimisation was ran, with the file being given below:
The supporting evidence shows the successful optimisation:
        Item               Value     Threshold  Converged?
Maximum Force            0.000126     0.000450     YES
RMS     Force            0.000016     0.000300     YES
Maximum Displacement     0.001577     0.001800     YES
RMS     Displacement     0.000275     0.001200     YES
Predicted change in Energy=-4.058698D-07
Optimization completed.
   -- Stationary point found.
1 imaginary frequency was recorded with magnitude 818 cm-1 (3sf). In GaussView this is displayed as a negative frequency which is not technically accurate however allows for an easier comparison.
Low frequencies --- -817.8228   -3.7866   -0.0009   -0.0008   -0.0006    3.8524
Low frequencies ---    6.5593  209.5815  395.5386
- 1 imaginary frequencies (negative Signs) ******
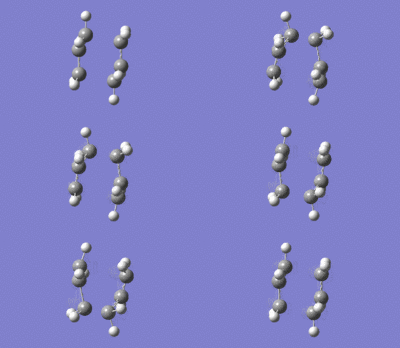
The animation below shows the two terminal carbons in the two allyls moving towards and away from each other, this shows the imaginary frequency is that corresponds to the cope rearrangement. The bond making/breaking distance is 2.02Å, this is much less than two van der Waal radii for carbon so some interaction must be present.
Freeze Optimisation
The frozen coordinate method threw up many problems as errors were encountered when the frozen coordinate was set at 2.2Å. This was overcome by moving the molecules to 2.2Å apart manually. The freeze coordinate optimisation then ran smoothly with the successful file given below:
The supporting evidence below shows a successful optimisation:
        Item               Value     Threshold  Converged?
Maximum Force            0.000012     0.000450     YES
RMS     Force            0.000004     0.000300     YES
Maximum Displacement     0.000908     0.001800     YES
RMS     Displacement     0.000141     0.001200     YES
Predicted change in Energy=-1.252191D-08
Optimization completed.
   -- Stationary point found.
Freeze Derivative
The frozen coordinate system was then optimised with frequencies being analysed. As expected an imaginary frequency of magnitude 818cm-1 (3sf) was generated. This agrees with the imaginary frequency when the chair was optimised using a different method. The correlation between these results was to be expected. The successful file is given below:
The supporting evidence shows the imaginary frequency and that the optimisation converged:
Low frequencies --- -818.1443   -6.5821   -0.0008   -0.0008   -0.0003    2.2606
Low frequencies ---    5.1848  209.5033  395.8970
******    1 imaginary frequencies (negative Signs) ******
        Item               Value     Threshold  Converged?
Maximum Force            0.000036     0.000450     YES
RMS     Force            0.000012     0.000300     YES
Maximum Displacement     0.000947     0.001800     YES
RMS     Displacement     0.000170     0.001200     YES
Predicted change in Energy=-4.140491D-07
Optimization completed.
   -- Stationary point found.
Comparing the two optimised chair structures shows that even though two different methods were used to calculate the transition structures very similar results were obtained. Both have imaginary magnitudes of 818cm-1 and both have bond making/breaking distances of 2.02Å. This shows that there are more then one way to tackle a problem using Gaussian.
'Boat' Transition State Fail
When attempting to optimise a boat transition state from a chair like conformation it proved impossible. The transition state appears to be 'chair like' with dotted bonds crossing the molecule. This is obviously a failed calculation and not an accurate representation of the transition state. The TS (QST2) method was used with the 3-21g basis set.
Boat Transition State
The TS (QST2) method was used with the 3-21g basis set, a successful boat transition state was produced. The successful file is given below:
Supporting data is given below to show a successful optimisation and an imaginary frequency of magnitude 840cm-1, showing that the transition state is present:
        Item               Value     Threshold  Converged?
Maximum Force            0.000067     0.000450     YES
RMS     Force            0.000014     0.000300     YES
Maximum Displacement     0.000452     0.001800     YES
RMS     Displacement     0.000151     0.001200     YES
Predicted change in Energy=-4.862792D-08
Optimization completed.
   -- Stationary point found.
Low frequencies --- -840.0325   -6.0823   -4.9975   -3.4793   -0.0009   -0.0008
Low frequencies ---    0.0005  155.1478  382.1823
******    1 imaginary frequencies (negative Signs) ******
The imaginary frequency with magnitude 840cm-1 shows the transition state has bee identified, the animation is given below:
The bond breaking/making distance of 2.14Å can be observed.
Intrinsic Reaction Coordinate Chair
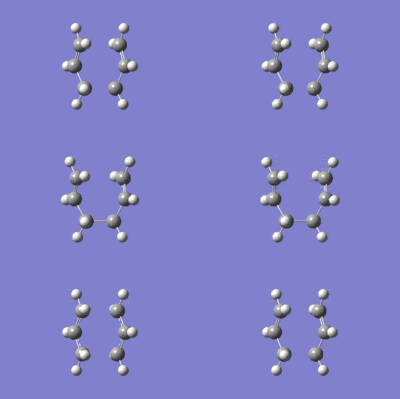
This was computed with 50 points however not all points were calculated with there only being 21 present in the final file. The file is given below:
The table shows the reaction coordinate energy pathway and the animation:
| IRC | Animation |
|---|---|
 |
|
In order to see the true energy minimum the final reaction coordinate was re-optimised using the 6-31g* basis set to find a minimum energy optimised molecule, the file is given below:
Minimum energy of -234.61068500 a.u. was achieved.
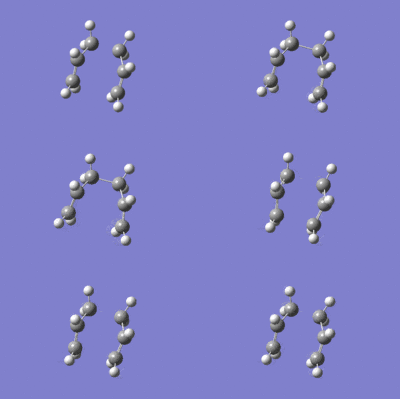
IRC Boat
The IRC of the boat was also ran using 3-21g basis set. This file is given below:
| IRC | Animation |
|---|---|
 |
|
Activation Energies
The Boat transition state was re-optimised wit the 6-31g* basis set
21122 - Optimisation
21489 - Frequency
The supporting evidence is given below, showing the molecule optimised successfully:
        Item               Value     Threshold  Converged?
Maximum Force            0.000048     0.000450     YES
RMS     Force            0.000014     0.000300     YES
Maximum Displacement     0.001556     0.001800     YES
RMS     Displacement     0.000356     0.001200     YES
Predicted change in Energy=-9.619792D-08
Optimization completed.
   -- Stationary point found.
Low frequencies --- -533.1281  -16.6656   -1.6353    0.0002    0.0007    0.0009
Low frequencies ---   11.6624  133.9293  258.4266
******    1 imaginary frequencies (negative Signs) ******
The imaginary frequency shows that the optimised transition sate is still present. The thermochemistry data is provided below:
Sum of electronic and zero-point Energies=           -234.402340
Sum of electronic and thermal Energies=              -234.395993
Sum of electronic and thermal Enthalpies=            -234.395049
Sum of electronic and thermal Free Energies=         -234.431768
The chair was optimised using the 6-31g* basis set the same as the boat conformation. This ran successfully and the file is given below:
The supporting data has also been provided:
               Item               Value     Threshold  Converged?
Maximum Force            0.000016     0.000450     YES
RMS     Force            0.000006     0.000300     YES
Maximum Displacement     0.000898     0.001800     YES
RMS     Displacement     0.000167     0.001200     YES
Predicted change in Energy=-4.727004D-08
Optimization completed.
   -- Stationary point found.
Low frequencies --- -569.0992  -21.5412   -7.1927   -0.0014   -0.0010   -0.0009
Low frequencies ---   25.5105  195.1486  262.5505
******    1 imaginary frequencies (negative Signs) ******
The imaginary frequency shows that the optimised transition structure is still present. The thermochemistry data is provided below:
Energy Comparison
| Structure | HF/3-21g (a.u.) | B3LYP/6-31g* (a.u.) | Activation Energy (kcal/mol)HF/3-21g (3sf) | Activation Energy (kcal/mol)HF/3-21g (3sf) |
|---|---|---|---|---|
| Chair TS | -231.61932142 | -234.55693214 | 46.0 | 34.4 |
| Boat TS | -231.60280243 | -234.54309302 | 56.3 | 43.1 |
| Anti2 (reactant) | -231.69253516 | -234.61170273 | - | - |
The results correlate well with the supplied data[1] and fall within the error limits. The difference in energy between the 3-21g and 6-31g* basis set shows the difference in accuracy a basis set can have. The 6-31g* energies are most similar to the experimental results.
From the activation energies it can be seen that the Chair is the preferred and lowest energy conformation when compared with the boat.
Diels Alder Cycloaddition
Cis Butadiene Optimisation
To optimise cis butadiene the AM1 semi empirical molecular orbital method was used. This worked well with the optimised file being given below:
The supporting data is also provided:
| File Name | logfile(43) |
| File Type | .log |
| Calculation Type | FOPT |
| Calculation Method | RAM1 |
| Basis Set | ZDO |
| Charge | 0 |
| Spin | Singlet |
| E(RB3LYP) | 0.04879719 a.u. |
| RMS Gradient Norm | 0.00001745 a.u. |
| Imaginary Freq | |
| Dipole Moment | 0.0414 Debye |
| Point Group | C1 |
        Item               Value     Threshold  Converged?
Maximum Force            0.000030     0.000450     YES
RMS     Force            0.000011     0.000300     YES
Maximum Displacement     0.000362     0.001800     YES
RMS     Displacement     0.000162     0.001200     YES
Predicted change in Energy=-9.691059D-09
Optimization completed.
   -- Stationary point found.
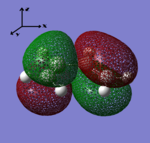
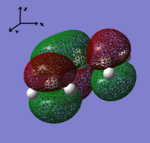
| HOMO | LUMO |
|---|---|
 |
|
| Antisymmetric with respect to the yz-plane | Symmetric with respect to the yz-plane |
Diels Alder Transition Structure
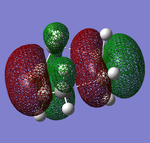
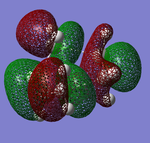
The transition structure was calculated using a force matrix method, the optimised file was successful and given below. The distance between the diene and dieneophile was set to 2.2Å as this seemed a good estimate on the transition state bond length. The HOMO and LUMO can be seen:
The supporting evidence is shown below, there is an imaginary frequency with magnitude 525cm-1(3sf), this suggests a transition state has been achieved:
        Item               Value     Threshold  Converged?
Maximum Force            0.000058     0.000450     YES
RMS     Force            0.000007     0.000300     YES
Maximum Displacement     0.001035     0.001800     YES
RMS     Displacement     0.000278     0.001200     YES
Predicted change in Energy=-1.029234D-08
Optimization completed.
   -- Stationary point found.
Low frequencies --- -524.8061   -6.6416    0.0003    0.0003    0.0008    9.9933
Low frequencies ---   19.6743  135.8592  203.7649
| HOMO | LUMO |
|---|---|
 |
|
| Antisymmetric with respect to the plane | Symmetric with respect to the plane |
The HOMO structure is antisymmetric with respect to the plane. The HOMO is made up of the LUMO of the dieneophile (cis butadiene) and the diene HOMO. This can be seen if the images are compared. Both of these orbitals are anti-symmetric. The formation of the two new C-C bonds has not change in symmetry and hence is allowed.
The internuclear distance between the diene and dienophile is 2.27Å (3sf). A comparison of C-C bonds is shown below:
| Bond Type | Length (Å) |
|---|---|
| sp3 C-C [3] | 1.53 |
| sp2 C-C [3] | 1.46 |
| partially formed σ C-C | 2.27 |
| Sum of 2 C van der Waal radius[4] | (2x1.7)= 3.40 |
As expected the partially formed bond has a length of less than the sum of the van der Waal radius showing some interaction. The partial bond in the transition state has not fully formed however as it is still longer than a sp3 C-C bond or an sp2 C-C bond.
| Imaginary (-525cm-1) | Lowest Possible Real (136cm-1) |
|---|---|
 |
|
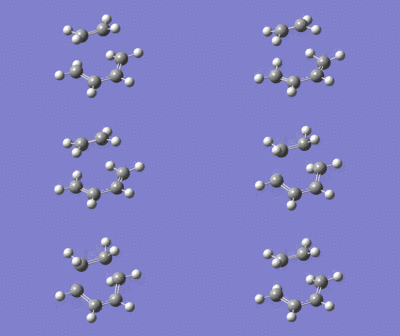
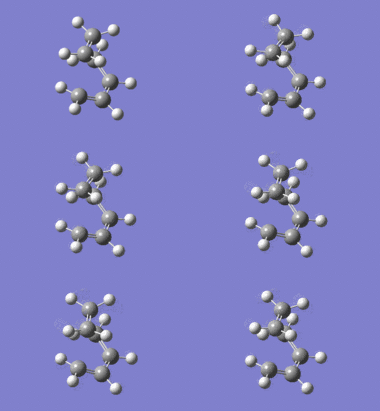
From the vibrations it can be seen that the Imaginary frequency has the two molecules moving towards each other, forming bonds. This is very different to the lowest possible real frequency, this shows two molecules vibrating independently and having no visible interaction.
Endo Transition State
The transition state was calculated using the 6-31g* basis set and the optimisation was carried out using TS Berny method. The successful file is given below:
The supporting data is given below, showing the optimisation completed and an imaginary frequency was found signifying the transition state:
        Item               Value     Threshold  Converged?
Maximum Force            0.000127     0.000450     YES
RMS     Force            0.000012     0.000300     YES
Maximum Displacement     0.001398     0.001800     YES
RMS     Displacement     0.000261     0.001200     YES
Predicted change in Energy=-2.509110D-08
Optimization completed.
   -- Stationary point found.
Low frequencies --- -447.3922  -14.5543   -0.0008    0.0005    0.0007    3.8105
Low frequencies ---   11.2923   59.6167  118.3573
******    1 imaginary frequencies (negative Signs) ******
Exo Transition State
The transition state was calculated using the 6-31g* basis set and the optimisation was carried out using TS Berny method. The successful file is given below:
The supporting data is given below, showing the optimisation completed and an imaginary frequency was found signifying the transition state:
        Item               Value     Threshold  Converged?
Maximum Force            0.000028     0.000450     YES
RMS     Force            0.000003     0.000300     YES
Maximum Displacement     0.001131     0.001800     YES
RMS     Displacement     0.000257     0.001200     YES
Predicted change in Energy=-8.578183D-09
Optimization completed.
   -- Stationary point found.
Low frequencies --- -448.5315  -13.9006  -11.7824    0.0004    0.0009    0.0013
Low frequencies ---    3.2021   53.3163  109.0983
******    1 imaginary frequencies (negative Signs) ******
Comparison
| EXO | -612.67931096 a.u. |
| ENDO | -612.68339672 a.u. |
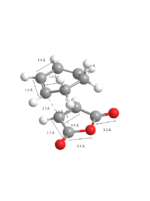
When comparing the Endo and Exo transition states it is best to start with the energies. The Endo form has the lowest energy, the difference in energy is 0.00408576 a.u. (2.56 kcal/mol), this is a large difference in transition state conformational energy and the reasons for this are explored below.
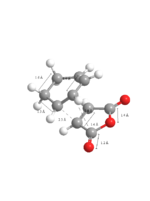
 |
|
Looking at the structure of both transition states all bond lengths seem the same. The difference in structure comes with the relative position of the alkene in the cyclohexadiene. In the Endo form the anhydride of maleic anhydride is directly under the alkene, however in the Exo form it is away from the anhydride. Considering sterics only the extra protons above the bulky anhydride group in the Exo form could cause some steric repulsive interactions. These interactions would not be seen in the Endo form. Having a π system above the anhydride could have also have some electronic effects which are explored below.
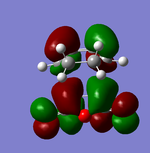
| HOMO | LUMO | |
|---|---|---|
| EXO | 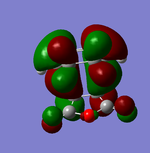 |
|
| ENDO | 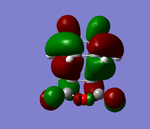 |
|
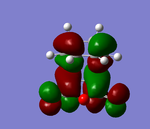
Looking at the HOMO in particular for the Endo and Exo. There is a positive combination of orbitals with the anhydride section and the 'alkene' in the Endo transition state. This is not present in the Exo form as there is a node in between. This overlap of orbitals in the Endo form can be termed a secondary orbital overlap. This positive electronic effect is the main reason in this case why the Endo form is lower in energy.
References
- ↑ 1.0 1.1 1.2 1.3 M.Bearpark., (2012)., Moecule 3, Physical (Computational Lab)., [Lab Script]., Imperial College London., Autumn 2012., Lab Script
- ↑ B W. Gung, Z Zhu, R A. Fouch., ,J. Am. Chem. SOC. 1995,117, 1783-1788[Diene Conformations]., Imperial College London., Autumn 2012., Diene Conformations
- ↑ 3.0 3.1 F.H. Allen, O. Kennard, D.G. Watson, et.al. J. Chem. Soc. Perkin Trans. 2., 1987, S1-S19., DOI:10.1039/P298700000S1
- ↑ A. Bondi. J. Phys. Chem., 1964, 68 (3) pp 441-451., DOI:10.1021/j100785a001

