
Rep:Mod:3080ecm10mod2
Computational Laboratory 2012 - Bonding and Molecular Orbitals in Main Group Chemistry
Emily Monkcom
Introduction
Computational analysis is taking on an ever increasing importance within chemistry. Its ability to explore the theoretical realms of quantum chemistry, molecular orbitals and molecular structure makes it a key component in research and industry. Computational chemistry has the added advantage of providing a means of examining the properties of toxic compounds such as thallium without the user having to come into direct contact with them.
In this report, the software GaussView 5.0.9 and Gaussian 9.0 were used for the analysis of various molecules, ranging from borane and toxic thallium bromide in the first part, to ionic liquid cations in the second part. Optimisations were conducted to determine bond lengths, bond angles and energy profiles; frequency analysis was able to reveal the frequency and intensity of vibrations; and orbital population and distribution was made possible by analysing the molecule's energy via NBO analysis.
Molecule Optimisation
BH3 Initial Optimisation
A trigonal planar molecule of BH3 was arbitrarily adjusted to have three B-H "bonds" of 1.50 Angstoms. The molecule was then optimised using a basis set of 3-21G, a low accuracy basis set. This generated very fast a new perfect trigonal planar molecule. The operation results are summarised within the following table and the log file can be found here.

| Criteria | Result |
|---|---|
| File type | .log |
| Calculation type | FOPT |
| Calculation method | RB3LYP |
| Basis set | 3-21G |
| Charge | 0 |
| Spin | Singlet |
| Final Energy (a.u.) | -26.46226338 |
| Gradient (a.u.) | 0.00020672 |
| Dipole moment (D) | 0.0000 |
| Point Group | D3h |
| Duration (sec) | 16.0 |
To confirm that the optimisation has run, the "Item" segment of the .log file had been included below:
Item               Value     Threshold  Converged?
 Maximum Force            0.000413     0.000450     YES
 RMS     Force            0.000271     0.000300     YES
 Maximum Displacement     0.001610     0.001800     YES
 RMS     Displacement     0.001054     0.001200     YES
 Predicted change in Energy=-1.071764D-06
 Optimization completed.
    -- Stationary point found.
|
Optimised data:
- The B-H bond legth = 1.19349 Å
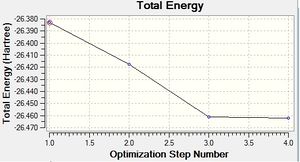
Fig.1: Energy profile for initial optimisation of BH3.

- The H-B-H bond angle = 120o
According to GaussView, the arbitrary distance of 1.50 Angstroms does not match the program's criteria for the existence of a bond. As can be seen from the optimisation steps of borane, BH3 is but a collection of atoms in the first stage of the optimisation, and the bonds make their appearance in the third stage. For the program, bonds are merely a tool for the structuring of the molecule. In reality, a bond is defined by the balance of the nuclear repulsion and the electrostatic attraction of the electrons between the nuclei. It exists when an energy equilibrium between the atoms and their electron density is able to form in a stable manner. In other words, the role of the optimisation is to determine the energy minimum at which this equilibrium will occur by solving the Schrodinger Equation multiple times at different interatomic distances.

The results of this optimisation may be visualised by the energy profile in Figure 1.
The second graph, Figure 2, describes the gradient of the energy optimisation, in atomic units. The gradient of a function corresponds to the first derivative of that function. Looking at Figure 2 it can be seen that the gradient decreases steadily from 0.035 a.u. to 0.000 a.u., indicating that an energy stationary point has been reached. Combining shape of the function in Figure 1 with the knowledge that the gradient equals zero at, it is proven that an energy minimum has been determined at step five of the optimisation.
BH3 Improved Optimisation
Following on from this initial operation, the resulting molecule of BH3 was optimised once more, this time using a higher level basis set of 6-31G of greater accuracy. The log file can be found here and the operation results are summarised as follows:
| Criteria | Result |
|---|---|
| File type | .log |
| Calculation type | FOPT |
| Calculation method | RB3LYP |
| Basis set | 6-31G(d,p) |
| Charge | 0 |
| Spin | Singlet |
| Final Energy (a.u.) | -26.61532363 |
| Gradient (a.u.) | 0.00000235 |
| Dipole moment (D) | 0.0000 |
| Point Group | D3h |
| Duration (sec) | 11.0 |
To confirm that the optimisation has run, the "Item" segment of the .log file had been included below:
Item               Value     Threshold  Converged?
 Maximum Force            0.000005     0.000450     YES
 RMS     Force            0.000003     0.000300     YES
 Maximum Displacement     0.000019     0.001800     YES
 RMS     Displacement     0.000012     0.001200     YES
 Predicted change in Energy=-1.304899D-10
 Optimization completed.
    -- Stationary point found.
|
Optimised data:
- The B-H bond length = 1.19232 Å
- The H-B-H angle = 120o
The final energies for both optimisations of BH3 are different (former: -26.46226338 a.u., latter: -26.61532363) as a result of the difference in accuracies of the calculations. The two results cannot be compared to each other due to the two different basis sets, but it can be said that 6-31G is a fuller and more accurate basis set. For the purpose of valid comparison to other molecules, the 6-31G basis set is used from now on for the optimisations of molecules.
TlBr3 Optimisation using Pseudo-Potentials
Using the more accurate basis set settings, calculations were carried out on thallium(III) bromide. TlBr3 is different from BH3 in that both the thallium and bromide exhibit relativistic effects that cannot be solved simply using Schrodinger equation with Gaussian. A pseudo-potential must be used instead, made possible using Imperial College London's high performance computing service (HPC). The results of the operation can be found here: DOI:10042/21581 , and are summarised in the table below. The log file can be found here.
| Criteria | Result |
|---|---|
| File type | .log |
| Calculation type | FOPT |
| Calculation method | RB3LYP |
| Basis set | LANL2DZ |
| Charge | 0 |
| Spin | Singlet |
| Final Energy (a.u.) | -91.21812851 |
| Gradient (a.u.) | 0.00000090 |
| Dipole moment (D) | 0.0000 |
| Point Group | D3h |
| Duration (sec) | 37.4 |
To confirm that the optimisation has run, the "Item" segment of the .log file had been included below:
Item               Value     Threshold  Converged?
 Maximum Force            0.000002     0.000450     YES
 RMS     Force            0.000001     0.000300     YES
 Maximum Displacement     0.000022     0.001800     YES
 RMS     Displacement     0.000014     0.001200     YES
 Predicted change in Energy=-6.084142D-11
 Optimization completed.
    -- Stationary point found.
|
Optimised data:
- The Tl-Br bond length = 2.651 Å
- The Br-Tl-Br angle = 120o
The computed Tl-Br bond distance is in fact longer than the ones given in literature. TlBr3 has been reported to have a bond distance of 2.512 Å.[1] This indicates that the basis set is perhaps not fully adequate for the molecule and that further optimisation is needed.
BBr3 Optimisation using a Mixture of Basis Sets and Pseudo-Potentials
BBr3 contains heavy bromide ions as well as the light boron atom. In such cases as these a combination of a full basis and a pseudo-potential must be used to achieve a successful optimisation. Using the improved optimisation of BH3 as a starting model, bromine atoms were used to replace the hydrogen ones, and the molecule was submitted to the HPC service with a new basis set of GEN, meaning that a basis set could be set for each individual atom. A further specification was made to assign a pseudo-potential to each atom individually. The computed results of the calculation can be found here: DOI:10042/21588 and are summarised below. The log file is found here.
| Criteria | Result |
|---|---|
| File type | .log |
| Calculation type | FOPT |
| Calculation method | RB3LYP |
| Basis set | Gen |
| Charge | 0 |
| Spin | Singlet |
| Final Energy (a.u.) | -64.43645296 |
| Gradient (a.u.) | 0.00000382 |
| Dipole moment (D) | 0.0000 |
| Point Group | D3h |
| Duration (sec) | 36.0 |
To confirm that the optimisation has run, the "Item" segment of the .log file had been included below:
Item               Value     Threshold  Converged?
 Maximum Force            0.000008     0.000450     YES
 RMS     Force            0.000005     0.000300     YES
 Maximum Displacement     0.000036     0.001800     YES
 RMS     Displacement     0.000023     0.001200     YES
 Predicted change in Energy=-4.026911D-10
 Optimization completed.
    -- Stationary point found.
|
Optimised data:
- The B-Br bond length = 1.93396 Å
- The Br-B-Br angle = 120o
Summary for Optimisation Data
Below is a table summarising the optimised bond distances for all the compounds discussed in the previous sections:
| Compound | Bond distance (Å) |
|---|---|
| BH3 (3-21G) | 1.19349 |
| BH3 (6-31G) | 1.19232 |
| TlBr3 | 2.65095 |
| BBr3 | 1.93396 |
As discussed earlier, it is evident from the table that the basis set of 6-31G was a more powerful tool to determine the energy minima of BH3. This basis set was used for the optimisations of TlBr3 and BBr3.
Changing the ligand in a molecule, for instance in the case of BH3 and BBr3, makes a significant difference in the strength of the boron-ligand bond. Bromine and hydrogen are in the same group of the Periodic Table, and both require only one electron to fill their valence shell. Bonding to boron is therefore favourable, but the differences in the bond lengths associated to each ligand is different because of the fact that bromine belongs to Period 4 of the Periodic Table, consequently much more of a sterically bulky and diffuse atom than hydrogen. Furthermore, the greater difference in energy between bromide and boron relative to hydrogen and boron means that orbital overlap is less successful. This combined with bromide's more diffuse nature means the stabilisation energy upon the formation of a molecular orbital is smaller that between boron and hydrogen.
A comparison of BBr3 and TlBr3 means the effect of a different central atom in a molecule can be explored. Both boron and thallium are in Group 13 of the Periodic Table, and have the same valence number of electrons. Once again, differences arise in the fact that thallium belongs to Period 6 - much heavier and more diffuse compared to boron. The combination of thallium and bromide, both diffuse fragments, means that atomic orbital overlap is very poor, resulting in weak bonds measuring 2.65 Å. Boron bromide in comparison is much more stable with its stronger bonds of 1.93 Å. The stabilisation energy for BBr3 upon the creation of molecular orbitals is greater, thereby yielding shorter bond lengths.
As discussed for the initial optimisation of borane, Gaussian's "approach" to a bond is different to what a bond actually is. According to Gaussian, bonds are only a tool for the structuring of a molecule and come into existence when a certain energy threshold has been crossed. In reality, a bond is defined by the balance of the nuclear repulsion and the electrostatic attraction of the electrons between the nuclei. This means that a bond will exist firmly and with stability when an energy equilibrium between the atoms and their electron density is able to form in a stable manner. However, it does not mean that a bond is arbitrarily absent above a certain energy threshold. Electron density will still be present between two atoms, thus providing the formation a bond, despite its potentially unstable or temporary nature.
Vibrational Analysis
Vibrational analysis, also known as frequency analysis, plays an important mathematical role in the analysis of optimised molecules. Performing frequency analysis enables the second derivative of the potential energy surface (PES) to be determined, thus revealing if a turning point is a minimum or maximum energy point. If the frequency is positive, a minimum point in the PES exists, and conversely if the frequency if displayed as negative, a transition state has been determined (energy maximum). This suggests that a negative force constant has been found, which leads to the determination an imaginary frequency. The second role of frequency analysis is to provide predictions for the IR and Raman mode of the molecule that can then be compared to real IR data. Often, large differences arise between computed and real data because of the presence of both harmonic and anharmonic factors in the real IR. In the frequency analysis carried out below, only harmonic factors are taken into consideration.
BH3 Frequency Analysis
Frequency analysis results for the BH3 molecule optimised using a 6-31G basis set are recorded below. The log file can be accessed here.
Low frequencies ---   -0.9033   -0.7343   -0.0054    6.7375   12.2491   12.2824
Low frequencies --- 1163.0003 1213.1853 1213.1880
Harmonic frequencies (cm**-1), IR intensities (KM/Mole), Raman scattering
activities (A**4/AMU), depolarization ratios for plane and unpolarized
incident light, reduced masses (AMU), force constants (mDyne/A),
and normal coordinates:
                     1                      2                      3
                    A2"                    E'                     E'
 Frequencies --  1163.0003              1213.1853              1213.1880
 Red. masses --     1.2531                 1.1072                 1.1072
 Frc consts  --     0.9986                 0.9601                 0.9601
 IR Inten    --    92.5478                14.0553                14.0589
  Atom  AN      X      Y      Z        X      Y      Z        X      Y      Z
     1   5     0.00   0.00   0.16     0.00   0.10   0.00    -0.10   0.00   0.00
     2   1     0.00   0.00  -0.57     0.00   0.08   0.00     0.81   0.00   0.00
     3   1     0.00   0.00  -0.57    -0.39  -0.59   0.00     0.14   0.39   0.00
     4   1     0.00   0.00  -0.57     0.39  -0.59   0.00     0.14  -0.39   0.00
                     4                      5                      6
                    A1'                    E'                     E'
 Frequencies --  2582.2624              2715.4311              2715.4323
 Red. masses --     1.0078                 1.1273                 1.1273
 Frc consts  --     3.9595                 4.8976                 4.8976
 IR Inten    --     0.0000               126.3307               126.3211
|
 |
| Criteria | Result |
|---|---|
| File type | .log |
| Calculation type | FREQ |
| Calculation method | RB3LYP |
| Basis set | 6-31G(d,p) |
| Charge | 0 |
| Spin | Singlet |
| Final Energy (a.u.) | -26.61532363 |
| Gradient (a.u.) | 0.00000237 |
| Dipole moment (D) | 0.0000 |
| Point Group | D3h |
| Duration (sec) | 13.0 |
| Number | Form of vibration | Description | Symmetry Label |
Frequency (cm-1) |
Intensity |
|---|---|---|---|---|---|
| 1 |  |
Out-of-plane vibration of H atoms. Boron moves in opposing direction to the H atoms. |
A2" | 1163 | 93 |
| 2 |  |
Symmetrical oscillation of the two H atoms. Boron moves shifts mildly along same plane as the H atom oscillation |
E' | 1213 | 14 |
| 3 |  |
Unsymmetrical vibration of all H atoms. Boron does not stay stationary - it moves in plane with H atom oscillation. |
E' | 1213 | 14 |
| 4 |  |
Symmetrical stretch of all B-H atoms along bond axis. Boron remains stationary. |
A1' | 2582 | 0.0000 |
| 5 |  |
Antisymmetric stretch of the two H atoms. Final H remains stationary. Boron shifts slightly as a result in alternating direction of oscillating bonds. |
E' | 2715 | 126 |
| 6 |  |
Antisymmetric stretch of all B-H atoms along bond axes. Stretches are out of sync in the ratio of 2:1 atoms. Boron moves along axis of the out-of-sync H atom. |
E' | 2715 | 126 |
From the obtained results, it is evident that there are less than six peaks displayed on the spectrum in Figure 7, despite the reported six vibrations. The reasons for this are two-fold. Firstly, the fourth vibration of BH3 is entirely symmetrical and generated no dipole moment, hence its intensity of zero. Secondly, vibrations 2 and 3, and 5 and 6 occur at the same frequency and therefore bear no distinction to each other in the spectrum. In total, this means three peaks are expected to be observed, as predicted by GaussView in Fig. 7.
TlBr3 Frequency Analysis
Frequency analysis results from the HPC service for the TlBr3 molecule optimised using a LanL2DZ basis set can be found here: DOI:10042/21610 , accompanied by the log file, and are recorded below:
Low frequencies ---   -3.4213   -0.0026   -0.0004    0.0015    3.9367    3.9367
Low frequencies ---   46.4289   46.4292   52.1449
Harmonic frequencies (cm**-1), IR intensities (KM/Mole), Raman scattering
activities (A**4/AMU), depolarization ratios for plane and unpolarized
incident light, reduced masses (AMU), force constants (mDyne/A),
and normal coordinates:
                     1                      2                      3
                    E'                     E'                     A2"
 Frequencies --    46.4289                46.4292                52.1449
 Red. masses --    88.4613                88.4613               117.7209
 Frc consts  --     0.1124                 0.1124                 0.1886
 IR Inten    --     3.6867                 3.6867                 5.8466
  Atom  AN      X      Y      Z        X      Y      Z        X      Y      Z
     1  81     0.00   0.28   0.00    -0.28   0.00   0.00     0.00   0.00   0.55
     2  35     0.00   0.26   0.00     0.74   0.00   0.00     0.00   0.00  -0.48
     3  35     0.43  -0.49   0.00    -0.01  -0.43   0.00     0.00   0.00  -0.48
     4  35    -0.43  -0.49   0.00    -0.01   0.43   0.00     0.00   0.00  -0.48
                     4                      5                      6
                    A1'                    E'                     E'
 Frequencies --   165.2685               210.6948               210.6948
 Red. masses --    78.9183               101.4032               101.4032
 Frc consts  --     1.2700                 2.6522                 2.6522
 IR Inten    --     0.0000                25.4830                25.4797
The operation results summary is as follows:

| Criteria | Result |
|---|---|
| File type | .log |
| Calculation type | FREQ |
| Calculation method | RB3LYP |
| Basis set | LANL2DZ |
| Charge | 0 |
| Spin | Singlet |
| Final Energy (a.u.) | -91.21812851 |
| Gradient (a.u.) | 0.00000088 |
| Dipole moment (D) | 0.0000 |
| Point Group | D3h |
| Duration (sec) | 28.3 |
The vibrations of molecules and their forms are given below:
| Number | Form of vibration | Description | Frequency (cm-1) |
Intensity | Symmetry Label |
|---|---|---|---|---|---|
| 1 |  |
Symmetric oscillation of two Br atoms. Thallium vibrates along third Br bond axis. |
46 | 4 | E' |
| 2 |  |
Antisymmetric vibration of all Br atoms. Thallium oscillates in plane as a result. |
46 | 4 | E' |
| 3 |  |
Out-of-plane oscillation of all Br atoms. vibrates in opposing direction |
52 | 6 | A2" |
| 4 |  |
Symmetrical stretch of all Tl-Br bonds. Thallium is stationary. |
165 | 0 | A1' |
| 5 |  |
Antisymmetric stretch of two Tl-Br bonds. Final Br is stationary. Thallium oscillates between the two stretching bonds. |
211 | 25 | E' |
| 6 |  |
Antisymmetric stretch of all Tl-Br bonds. Stretches are out of sync in the ratio 2:1. Thallium oscillates along axis of bond of the out-of-sync Br. |
211 | 25 | E' |
Once again, as can be seen from Figure 8, the number of visible peaks exceeds the number of predicted vibrations. This is due to the absence of a dipole moment in the fourth vibration (A1 symmetry), and also due to the fifth and sixth vibrations occurring at the same frequency. The peak in the region of 50 cm-1 is broad due to the peaks lying close together.
Summary of Frequency Analysis
The results of this frequency analysis allows us to compare and contrast the vibrations for both BH3 and TlBr3, therefore giving more of an insight into the differences between the two molecules. The frequencies of the two molecules' vibrations are compared in the following table:
| Vibration Number | BH3 Frequency | Symmetry Label |
TlBr3 Frequency | Symmetry Label |
|---|---|---|---|---|
| 1 | 1163 cm-1 | A2" | 46 cm-1 | E' |
| 2 | 1213 cm-1 | E' | 46 cm-1 | E' |
| 3 | 1213 cm-1 | E' | 52 cm-1 | A2" |
| 4 | 2582 cm-1 | A1' | 165 cm-1 | A1' |
| 5 | 2715 cm-1 | E' | 211 cm-1 | E' |
| 6 | 2715 cm-1 | E' | 211 cm-1 | E' |
As previously mentioned, frequency is in fact the second derivative of the PES, meaning that a higher frequency indicates stronger bonding. The frequencies obtained for BH3 are much larger than those for TlBr3. This, along with the optimisation data, confirms that TlBr3 has weaker bonds than BH3. There also exists a reordering of the first three vibrational modes in TlBr3. Whereas BH3 has the first three modes as (A2", E', E'), TlBr3 has them as (E', E', A2").
The spectra generated by Gaussian for both molecules are similar in that there are three main observable peaks - one at a higher frequency and two fairly close together at a lower frequency. This is due to the fact that there are two sets of degenerate E' vibrational modes, and one A1' mode with an intensity of zero. This reduces the total number of peaks to three. The spectra are different with respect to the width of the observable peaks. BH3 has three, sharp distinguishable peaks, whereas TlBr3 has three broad peaks, with the lower frequency peaks in particular so broad they almost merge.
The fact that the vibrational modes of (A2" and E') and (A1' and E') lie at very different frequencies is due to the type of vibration they involve. The former are vibrational modes that involve only the oscillating (or "rocking") of bonds, whereas the latter involves bond stretches. This is due to the fact that oscillations involve less of an alteration in the dipole of the molecule compared to the stretches that involve much more of a change in dipole. This is why stretches occur at higher frequencies.
Optimisations and frequency analysis must be carried out using the same method and basis set, for an effective and correct comparison and transfer of data. Vibrational analysis, as discussed previously, is essentially the second derivative of the PES, which means the same method and basis set must be used for both optimisation and vibrational analysis to make sure the second derivative is being taken for the right energy plot. By undertaking a frequency analysis of the molecule, we are able to determine whether a molecule has successfully been optimised, by the absence of any negatively signed frequencies. If any negatively signed frequencies are presentm this would indicate the presence of a transition state (energy maximum) because of the negative force constant it implies.
The "Low Frequencies" displayed each time for the vibrational analysis has specific significance. The top line of this log file excerpt corresponds to the six frequencies that are subtracted in the 3N - 6 formula that determines the number of vibrational modes for the molecule. Ideally, these six "Low frequencies" should not exceed zero, but error comes into play when using a basis set that does not quite model the molecule correctly. In the results above, as well as the results to come for more complex molecules, the top row of these "Low frequencies" rarely falls perfectly to zero. The second line of this log file excerpt indicates the first three frequencies of the first three vibrational modes of the molecule. This is to confirm that the vibrational analysis has run smoothly, by the absence of any negative frequencies.
Molecular Orbitals and NBO Analysis
Molecular Orbitals of BH3
The optimised molecule of BH3 (6-31G(d,p)) was subjected to further computational analysis in order to determine its molecular orbitals (MOs) by solving its electronic structure with a population analysis. The operation results summary and BH3's MO diagram are given below, and the log file is found here.
| Criteria | Result |
|---|---|
| File type | .fchk |
| Calculation type | SP |
| Calculation method | RB3LYP |
| Basis set | 6-31G(d,p) |
| Charge | 0 |
| Spin | Singlet |
| Final Energy (a.u.) | -26.61532363 |
| Gradient (a.u.) | 0.00000000 |
| Dipole moment (D) | 0.0000 |
| File:MO Diagram for BH3.pdf |
Below is a table of the computed MO energies in BH3:
| MO | Real Shape | LCAO shape | Energy | MO | Real Shape | LCAO shape | Energy |
|---|---|---|---|---|---|---|---|
| 1 |  |
 |
-6.77140 | 5 |  |
 |
-0.06605 |
| 2 |  |
 |
-0.51254 | 6 |  |
 |
0.16839 |
| 3 |  |
 |
-0.35079 | 7 |  |
 |
0.17929 |
| 4 |  |
 |
-0.35079 | 8 |  |
 |
0.17929 |
It should be noted that MO 1 has not been included in BH3's molecular orbital diagram in Figure 9 because it lies too low in energy. It involves boron's 1s orbital, as opposed to the 2s and 2p orbitals, which yield important frontier (non-core) orbitals such as MO 4 and 5: the HOMO and LUMO respectively.
The comparison of LCAO molecular orbitals with the computed ones reveals that the computed results are very similar to the orbitals predicted ones.
The only difference between the two is the level of localisation of the electron charge around the molecule, thus making computed MOs more accurate, in fact, since they takes into account the cancelling of opposing orbital phases. This makes qualitative computational analysis extremely useful as a tool when working out MOs and a molecule's reactivity.
NBO Analysis of NH3
Firstly, NH3 was optimised using Gaussian from an arbitrary bond distance of 1.50 Angtroms. The log file for this operation is found here.


| Criteria | Result |
|---|---|
| File type | .log |
| Calculation type | FOPT |
| Calculation method | RB3LYP |
| Basis set | 6-31G(d,p) |
| Charge | 0 |
| Spin | Singlet |
| Final Energy (a.u.) | -56.55776852 |
| Gradient (a.u.) | 0.00003480 |
| Dipole moment (D) | 1.8480 |
| Point Group | C1 |
| Duration (sec) | 32.0 |
To ensure the calculation has run properly, the "Item" segment of the .log file is included below.
Item               Value     Threshold  Converged?
 Maximum Force            0.000053     0.000450     YES
 RMS     Force            0.000039     0.000300     YES
 Maximum Displacement     0.000631     0.001800     YES
 RMS     Displacement     0.000370     0.001200     YES
 Predicted change in Energy=-5.642678D-08
 Optimization completed.
    -- Stationary point found.
|
Optimised data:
- N-H bond length = 1.01798 Å, 1.01798 Å, 1.01795 Å
- H-N-H bond angle = 105.711o, 105.714o, 105.713o
Secondly, frequency analysis was performed on the optimised molecule - the published result can be found here: DOI:10042/21689 . The summary of the operation results is given below. The log file is found here.
Low frequencies --- -35.3053 -15.4276 -0.0013 -0.0009 0.0016 8.0217 Low frequencies --- 1090.9067 1694.1846 1694.2504 |

| Criteria | Result |
|---|---|
| File type | .log |
| Calculation type | FREQ |
| Calculation method | RB3LYP |
| Basis set | 6-31G(d,p) |
| Charge | 0 |
| Spin | Singlet |
| Final Energy (a.u.) | -56.55776852 |
| Gradient (a.u.) | 0.00003471 |
| Dipole moment (D) | 1.8480 |
| Point Group | C1 |
| Duration (sec) | 23.8 |
The following is a tabulation of the six vibrations associated to the molecule.
| Number | Form of vibration | Description | Frequency (cm-1) | Intensity |
|---|---|---|---|---|
| 1 |  |
Vibration of H atoms along C3 axis. Nitrogen moves in opposing direction to the H atoms. |
1091 | 145 |
| 2 |  |
Symmetrical oscillation of two H atoms. Final H atom vibrates along C3 axis. Nitrogen moves shifts mildly perpendicular to C3 axis. |
1694 | 14 |
| 3 |  |
Unsymmetrical vibration of all H atoms. Nitrogen does not stay stationary - it shifts mildly perpendicular to C3 axis. |
1694 | 14 |
| 4 |  |
Symmetrical stretch of all N-H atoms along bond axis. Nitrogen remains stationary. |
3461 | 1 |
| 5 |  |
Antisymmetric stretch of the two H atoms. Final H remains stationary. Nitrogen shifts slightly as a result in alternating direction of oscillating bonds. |
3589 | 0 |
| 6 |  |
Antisymmetric stretch of all N-H atoms along bond axes. Stretches are out of sync in the ratio of 2:1 atoms. Nitrogen oscillates along axis of the out-of-sync H atom. |
3590 | 0 |
Thirdly, the molecule was subjected to a population analysis in order to determine the molecule's MOs.
The HPC output summary can be found here: DOI:10042/21749 along with the checkpoint file, and the results are given below. The log file can be found here.
| Criteria | Result |
|---|---|
| File type | .fch |
| Calculation type | SP |
| Calculation method | RB3LYP |
| Basis set | 6-31G(d,p) |
| Charge | 0 |
| Spin | Singlet |
| Final Energy (a.u.) | -56.55776852 |
| Gradient (a.u.) | 0.0000000 |
| Dipole moment (D) | 1.8480 |
Below is a table of the computed MO energies in NH3:
| MO | Real Shape | MO Symmetry | Energy | MO | Real Shape | MO Symmetry | Energy |
|---|---|---|---|---|---|---|---|
| 1 |  |
1 a1 core MO | -14.30571 | 5 |  |
3 a1 | -0.25327 |
| 2 |  |
2 a1 | -0.84473 | 6 |  |
4 a1 | 0.07984 |
| 3 |  |
1 e | -0.45028 | 7 |  |
2 e | 0.16921 |
| 4 |  |
1 e | -0.45026 | 8 |  |
2 e | 0.16922 |

It should be noted that MO 1 has not been included in NH3's molecular orbital diagram in Figure 5 because it lies too low in energy. It involves Nitrogen's 1s orbital, as opposed to the 2s and 2p orbitals, which yield important frontier orbitals such as MO 5 and 6: the HOMO and LUMO respectively.

Finally, NBO analysis was carried out on the molecule of ammonia from the population analysis files obtained previously. The charge distribution can be observed in Figure 13, where the charge ranges from -1.00 (bright red, negative charge) to +1.00 (bright green, positive charge). The specific NBO charges associated for each atom are 0.375 for each H atom and -1.125 for the N atom, shown in the summary below and in Figure 14.
Summary of Natural Population Analysis:

                                       Natural Population
                Natural  -----------------------------------------------
    Atom  No    Charge         Core      Valence    Rydberg      Total
 -----------------------------------------------------------------------
      N    1   -1.12501      1.99982     6.11090    0.01430     8.12501
      H    2    0.37500      0.00000     0.62254    0.00246     0.62500
      H    3    0.37500      0.00000     0.62254    0.00246     0.62500
      H    4    0.37500      0.00000     0.62254    0.00246     0.62500
 =======================================================================
   * Total *    0.00000      1.99982     7.97851    0.02168    10.00000
|
The bonding in the molecule is described by the following results from the .log file. As can be seen, all N-H bonds are sp3 hybridised. The lone pair on the nitrogen is also sp3 hybridised, indicating that the NH3 molecules must have a tetragonal pseudo-structure, and trigonal pyramidal as an actual structure.
(Occupancy)   Bond orbital/ Coefficients/ Hybrids
 ---------------------------------------------------------------------------------
     1. (1.99908) BD ( 1) N   1 - H   2
                ( 68.83%)   0.8296* N   1 s( 24.85%)p 3.02( 75.06%)d 0.00(  0.09%)
                                           -0.0001 -0.4985 -0.0059  0.0000 -0.2923
                                            0.0051  0.8151  0.0277  0.0007  0.0000
                                            0.0281  0.0000 -0.0001  0.0031  0.0082
                ( 31.17%)   0.5583* H   2 s( 99.91%)p 0.00(  0.09%)
                                           -0.9996  0.0000  0.0073 -0.0289  0.0000
     2. (1.99908) BD ( 1) N   1 - H   3
                ( 68.83%)   0.8296* N   1 s( 24.85%)p 3.02( 75.06%)d 0.00(  0.09%)
                                            0.0001  0.4984  0.0059  0.0000  0.2923
                                           -0.0051  0.4081  0.0138  0.7056  0.0240
                                            0.0141  0.0243  0.0075  0.0034  0.0030
                ( 31.17%)   0.5583* H   3 s( 99.91%)p 0.00(  0.09%)
                                            0.9996  0.0000 -0.0073 -0.0145 -0.0250
     3. (1.99908) BD ( 1) N   1 - H   4
                ( 68.83%)   0.8296* N   1 s( 24.85%)p 3.02( 75.06%)d 0.00(  0.09%)
                                            0.0001  0.4985  0.0059  0.0000  0.2890
                                           -0.0052  0.4081  0.0138 -0.7069 -0.0239
                                            0.0140 -0.0243 -0.0076  0.0033  0.0032
                ( 31.17%)   0.5583* H   4 s( 99.91%)p 0.00(  0.09%)
                                            0.9996  0.0000 -0.0071 -0.0145  0.0251
     4. (1.99982) CR ( 1) N   1           s(100.00%)
                                            1.0000 -0.0002  0.0000  0.0000  0.0000
                                            0.0000  0.0000  0.0000  0.0000  0.0000
                                            0.0000  0.0000  0.0000  0.0000  0.0000
     5. (1.99721) LP ( 1) N   1           s( 25.43%)p 2.93( 74.48%)d 0.00(  0.10%)
                                            0.0001  0.5041 -0.0120  0.0000 -0.8615
                                            0.0505 -0.0012  0.0001  0.0020 -0.0001
                                           -0.0001  0.0001  0.0000 -0.0269  0.0155
|
Population analysis is found in the log file's section below. As can be seen, all N-H bonds are at the same energy and the lone pair is at a higher energy to the bonds. The core orbital lies much deeper in energy compared to the N-H bonds, which is why it is not included in the MO diagram of the molecule. Looking at the occupancy, it is shown that two electrons occupy the lone pair, the core orbital and each N-H bond, meaning that each bond is a 2c-2e bond.
Natural Bond Orbitals (Summary):

                                                            Principal Delocalizations
           NBO                        Occupancy    Energy   (geminal,vicinal,remote)
 ====================================================================================
 Molecular unit  1  (H3N)
     1. BD (   1) N   1 - H   2          1.99908    -0.60414
     2. BD (   1) N   1 - H   3          1.99908    -0.60413
     3. BD (   1) N   1 - H   4          1.99908    -0.60416
     4. CR (   1) N   1                  1.99982   -14.16766
     5. LP (   1) N   1                  1.99721    -0.31779
|
Association Energies: Ammonia-Borane as a Hydrogen Storage Unit
Ammonia borane has increasingly been explored as a means of storing hydrogen, due to its high hydrogen content and stability as a solid at room temperature.
Optimisation of NH3BH3
A molecule of NH3BH3 was optimised using the same basis set and method that was employed for the optimisations of NH3 and BH3. The results for this optimisation can be found here: DOI:10042/21784 and are summarised below. The log file can be accessed here.


| Criteria | Result |
|---|---|
| File type | .log |
| Calculation type | FOPT |
| Calculation method | RB3LYP |
| Basis set | 6-31G(d,p) |
| Charge | 0 |
| Spin | Singlet |
| Final Energy (a.u.) | -83.22468918 |
| Gradient (a.u.) | 0.00006806 |
| Dipole moment (D) | 5.5654 |
| Point Group | C1 |
| Duration (sec) | 109.8 |
To ensure the optimisation has run properly, the "Item" segment of the .log file is included below.
Item               Value     Threshold  Converged?
 Maximum Force            0.000137     0.000450     YES
 RMS     Force            0.000063     0.000300     YES
 Maximum Displacement     0.000606     0.001800     YES
 RMS     Displacement     0.000336     0.001200     YES
 Predicted change in Energy=-1.994000D-07
 Optimization completed.
    -- Stationary point found.
|
Vibrational Analysis of NH3BH3
Vibrational analysis was then performed on the molecule, all the results of which are displayed below and can be found here: DOI:10042/21801 . The log file can be accessed here.
Low frequencies --- 0.0011 0.0011 0.0013 17.2740 22.6434 39.3749 Low frequencies --- 265.9536 632.3808 639.0809 |

| Criteria | Result |
|---|---|
| File type | .log |
| Calculation type | FREQ |
| Calculation method | RB3LYP |
| Basis set | 6-31G(d,p) |
| Charge | 0 |
| Spin | Singlet |
| Final Energy (a.u.) | -83.22468924 |
| Gradient (a.u.) | 0.00006816 |
| Dipole moment (D) | 5.5654 |
| Point Group | C1 |
| Duration (sec) | 64.2 |
The vibrations associated to the molecule are tabulated below with their corresponding frequencies and intensities.
| Number | Form of vibration | Frequency (cm-1) | Intensity | Number | Form of vibration | Frequency (cm-1) | Intensity |
|---|---|---|---|---|---|---|---|
| 1 |  |
266 | 0 | 10 |  |
1330 | 114 |
| 2 |  |
632 | 14 | 11 |  |
1676 | 28 |
| 3 |  |
639 | 4 | 12 |  |
1676 | 28 |
| 4 |  |
640 | 4 | 13 |  |
2470 | 67 |
| 5 |  |
1069 | 40 | 14 |  |
2530 | 231 |
| 6 |  |
1070 | 41 | 15 |  |
2530 | 231 |
| 7 |  |
1197 | 109 | 16 |  |
3462 | 3 |
| 8 |  |
1204 | 4 | 17 |  |
3579 | 28 |
| 9 |  |
1204 | 3 | 18 |  |
3579 | 28 |
Association Energies
From this we can calculate the association energies of NH3 and BH3 to NH3BH3.
Obtained data:
- E(NH3) = -56.55776852 a.u.
- E(BH3) = -26.61532363 a.u.
- E(NH3BH3) = -83.22468918 a.u.
Association energy is therefore:
- ΔE = E(NH3BH3) - [E(NH3) + E(BH3)]
- ΔE = -83.22468918 a.u. - -83.17309215 a.u.
- ΔE = -0.05159703 a.u.
- ΔE = -135.7816579 kJ mol-1
- ΔE = -135.78 kJ mol-1
Mini Project: Ionic Liquids as Powerful New Solvents
Introduction
Ionic liquids are a relatively new class of compounds that has been of great interest due to their application as solvents in green chemistry. They are liquids at room temperature and are comprised solely of ions. Because an enormous array of ions can be combined, computational chemistry is of vital importance to predict some of the chemical and physical data that makes some of these ionic compounds liquid, or alternatively that will enable an ionic compound to be engineered for it to become liquid. The compounds that will be looked at in this section are (NMe4)+, (PMe4)+ and (SMe3)+. (NMe3CH2CN)+ and (NMe3CH2OH)+ were also looked at to see the effect of changing functional groups in a molecule.
Molecule Optimisations
Optimisation of (NMe4)+
A molecule of (NMe4)+ was optimised using a full basis set of 6-31G(d,p) and the HPC output may be found here: DOI:10042/21850 , along with the log output file. The operation results are summarised below.
%2B_opt_final_energy_ecm10.jpg)
%2B_opt_gradient_ecm10.jpg)
| Criteria | Result |
|---|---|
| File type | .log |
| Calculation type | FOPT |
| Calculation method | RB3LYP |
| Basis set | 6-31G(d,p) |
| Charge | 1 |
| Spin | Singlet |
| Final Energy (a.u.) | -214.18127383 |
| Gradient (a.u.) | 0.00003824 |
| Dipole moment (D) | 0.0003 |
| Point Group | C1 |
| Duration (min; sec) | 10; 3.4 |
To confirm whether the calculation has converged, the "Item" segment of the .log file is included below:
Item               Value     Threshold  Converged?
 Maximum Force            0.000095     0.000450     YES
 RMS     Force            0.000022     0.000300     YES
 Maximum Displacement     0.001293     0.001800     YES
 RMS     Displacement     0.000397     0.001200     YES
 Predicted change in Energy=-1.665930D-07
 Optimization completed.
    -- Stationary point found.
|
Optimised data:
- C-H bond length = 1.090 Å
- C-N bond length = 1.509 Å
- C-N-C bond angle = 109.5°
Optimisation of (PMe4)+
A molecule of (PMe4)+ was optimised using the same basis set of 6-31G(d,p). The HPC output can be found here: DOI:10042/21851 as well as the log file. The operation results are summarised below.
%2B_total_energy_ecm10.jpg)
%2B_gradient_ecm10.jpg)
| Criteria | Result |
|---|---|
| File type | .log |
| Calculation type | FOPT |
| Calculation method | RB3LYP |
| Basis set | 6-31G(d,p) |
| Charge | 1 |
| Spin | Singlet |
| Final Energy (a.u.) | -500.82702894 |
| Gradient (a.u.) | 0.00003376 |
| Dipole moment (D) | 0.0002 |
| Point Group | C1 |
| Duration (min; sec) | 19; 56.8 |
To confirm that the optimisation has converged successfully, the "Item" segment of the log file is given below.
Item               Value     Threshold  Converged?
 Maximum Force            0.000115     0.000450     YES
 RMS     Force            0.000029     0.000300     YES
 Maximum Displacement     0.000399     0.001800     YES
 RMS     Displacement     0.000147     0.001200     YES
 Predicted change in Energy=-1.147840D-07
 Optimization completed.
    -- Stationary point found.
|
Optimised data:
- C-H bond distance = 1.093 Å
- C-P bond distance = 1.816 Å
- C-P-C bond angle = 109.5°
Optimisation of (SMe3)+
A molecule of (SMe3)+ was optimised using the same basis set as the two previous molecules. The HPC output can be found here: DOI:10042/21816 , accompanied by the log file output.
%2B_total_energy_ecm10.jpg)
%2B_gradient_ecm10.jpg)
| Criteria | Result |
|---|---|
| File type | .log |
| Calculation type | FOPT |
| Calculation method | RB3LYP |
| Basis set | 6-31G(d,p) |
| Charge | 1 |
| Spin | Singlet |
| Final Energy (a.u.) | -517.68326502 |
| Gradient (a.u.) | 0.00003495 |
| Dipole moment (D) | 0.0318 |
| Point Group | C1 |
| Duration (min; sec) | 20; 8.4 |
To confirm that the calculation has converged properly, the "Item" segment of the log file is included.
Item               Value     Threshold  Converged?
 Maximum Force            0.000079     0.000450     YES
 RMS     Force            0.000033     0.000300     YES
 Maximum Displacement     0.001676     0.001800     YES
 RMS     Displacement     0.000557     0.001200     YES
 Predicted change in Energy=-6.942247D-08
 Optimization completed.
    -- Stationary point found.
|
Optimised data:
- C-H bond distance = 1.092 Å
- C-S bond distance = 1.823 Å
- C-S-C bond angle = 102.7°
Results and Discussion
The geometries of the three structures are compared and analysed below.
| Cation | C-X bond length | C-H bond length | C-X-C bond angle | Pseudo-structure | Structure |
|---|---|---|---|---|---|
| (NMe4)+ | 1.509 Å | 1.090 Å | 109.5° | Tetrahedral | Tetrahedral |
| (PMe4)+ | 1.816 Å | 1.093 Å | 109.5° | Tetraedral | Tetrahedral |
| (SMe3)+ | 1.823 Å | 1.092 Å | 102.7° | Tetrahedral | Trigonal pyramidal |
As is see, the bond distances for the cation containing nitrogen are the smallest, due to nitrogen being the smallest of all central heteroatoms in the trio of cations. Thus, orbital energies are much closer to each other, enabling a more successful orbital overlap. Phosphorus is in the same group as nitrogen and therefore has a very similar pseudo structure and actual structure to the cation containing nitrogen, the difference lies purely in the slightly longer bond lengths. Sulphur, on the other hand, lies one group to the right of the other two heteroatoms and does not have the same structure. The lone pair on the sulphur permits it to have a tetrahedral pseudo structure, but the cation actually has a trigonal pyramidal structure, with longer bond lengths than the cation containing phosphorus. The fact that the (SMe3)+ is trigonal pyramidal explains why it has a larger dipole moment than the other two cations.
Vibrational Analysis of Molecules
Frequency Analysis of (NMe4)+
The frequency analysis of (NMe4)+ can be found here: DOI:10042/21859 along with the associated log file
%2B_spectrum_ecm10.jpg)
Low frequencies --- -21.2276 0.0006 0.0007 0.0007 10.4657 18.4688 Low frequencies --- 184.1482 286.9489 288.1316 |
| Criteria | Result |
|---|---|
| File type | .log |
| Calculation type | FREQ |
| Calculation method | RB3LYP |
| Basis set | 6-31G(d,p) |
| Charge | 1 |
| Spin | Singlet |
| Final Energy (a.u.) | -214.18127384 |
| Gradient (a.u.) | 0.00003829 |
| Dipole moment (D) | 0.0003 |
| Point Group | C1 |
| Duration (min; sec) | 10; 10.4 |
| Mode | Frequency | Intensity | Mode | Frequency | Intensity | Mode | Frequency | Intensity |
|---|---|---|---|---|---|---|---|---|
| 1 | 184 | 0 | 16 | 1078 | 0 | 31 | 1531 | 53 |
| 2 | 287 | 0 | 17 | 1183 | 0 | 32 | 1532 | 53 |
| 3 | 288 | 0 | 18 | 1184 | 0 | 33 | 1532 | 53 |
| 4 | 292 | 0 | 19 | 1305 | 1 | 34 | 3087 | 1 |
| 5 | 360 | 0 | 20 | 1306 | 1 | 35 | 3088 | 1 |
| 6 | 362 | 0 | 21 | 1307 | 1 | 36 | 3088 | 1 |
| 7 | 454 | 0 | 22 | 1453 | 6 | 37 | 3096 | 0 |
| 8 | 455 | 0 | 23 | 1454 | 5 | 38 | 3189 | 0 |
| 9 | 456 | 0 | 24 | 1456 | 5 | 39 | 3189 | 0 |
| 10 | 736 | 0 | 25 | 1486 | 0 | 40 | 3189 | 0 |
| 11 | 939 | 22 | 26 | 1487 | 0 | 41 | 3190 | 0 |
| 12 | 940 | 22 | 27 | 1488 | 0 | 42 | 3190 | 0 |
| 13 | 941 | 22 | 28 | 1501 | 0 | 43 | 3195 | 1 |
| 14 | 1076 | 0 | 29 | 1502 | 0 | 44 | 3195 | 1 |
| 15 | 1077 | 0 | 30 | 1511 | 0 | 45 | 3195 | 1 |
Frequency Analysis of (PMe4)+
The frequency analysis of (PMe4)+ can be found here: DOI:10042/21860 along with the associated log file.
%2B_spectrum_ecm10.jpg)
Low frequencies --- -9.2011 -6.1254 -0.0019 0.0007 0.0017 29.1776 Low frequencies --- 160.5550 192.8530 194.1941 |
| Criteria | Result |
|---|---|
| File type | .log |
| Calculation type | FREQ |
| Calculation method | RB3LYP |
| Basis set | 6-31G(d,p) |
| Charge | 1 |
| Spin | Singlet |
| Final Energy (a.u.) | -500.82702881 |
| Gradient (a.u.) | 0.00003369 |
| Dipole moment (D) | 0.0002 |
| Point Group | C1 |
| Duration (min; sec) | 9; 51.1 |
| Mode | Frequency | Intensity | Mode | Frequency | Intensity | Mode | Frequency | Intensity |
|---|---|---|---|---|---|---|---|---|
| 1 | 161 | 0 | 16 | 825 | 0 | 31 | 1480 | 26 |
| 2 | 193 | 0 | 17 | 972 | 0 | 32 | 1481 | 26 |
| 3 | 194 | 0 | 18 | 973 | 0 | 33 | 1481 | 26 |
| 4 | 199 | 0 | 19 | 1012 | 78 | 34 | 3064 | 5 |
| 5 | 222 | 0 | 20 | 1013 | 78 | 35 | 3064 | 5 |
| 6 | 223 | 0 | 21 | 1013 | 78 | 36 | 3064 | 5 |
| 7 | 268 | 2 | 22 | 1360 | 21 | 37 | 3066 | 0 |
| 8 | 269 | 2 | 23 | 1361 | 21 | 38 | 3157 | 0 |
| 9 | 270 | 2 | 24 | 1362 | 21 | 39 | 3158 | 0 |
| 10 | 614 | 0 | 25 | 1388 | 0 | 40 | 3158 | 0 |
| 11 | 755 | 4 | 26 | 1454 | 0 | 41 | 3158 | 0 |
| 12 | 755 | 4 | 27 | 1454 | 0 | 42 | 3158 | 0 |
| 13 | 756 | 4 | 28 | 1454 | 0 | 43 | 3158 | 4 |
| 14 | 822 | 0 | 29 | 1461 | 0 | 44 | 3160 | 4 |
| 15 | 822 | 0 | 30 | 1462 | 0 | 45 | 3160 | 4 |
Vibrational Analysis of (SMe3)+
The frequency analysis of (SMe3)+ can be found here: DOI:10042/21861 along with the associated log file.
%2B_spectrum_ecm10.jpg)
Low frequencies --- -23.8221 -13.7119 -0.0042 0.0043 0.0046 8.9315 Low frequencies --- 161.9739 195.8199 207.5145 |
| Criteria | Result |
|---|---|
| File type | .log |
| Calculation type | FREQ |
| Calculation method | RB3LYP |
| Basis set | 6-31G(d,p) |
| Charge | 1 |
| Spin | Singlet |
| Final Energy (a.u.) | -517.68326504 |
| Gradient (a.u.) | 0.00003501 |
| Dipole moment (D) | 0.9652 |
| Point Group | C1 |
| Duration (min; sec) | 4; 40.8 |
| Mode | Frequency | Intensity | Mode | Frequency | Intensity | Mode | Frequency | Intensity |
|---|---|---|---|---|---|---|---|---|
| 1 | 162 | 0 | 12 | 959 | 0 | 23 | 1474 | 26 |
| 2 | 196 | 0 | 13 | 1071 | 11 | 24 | 1485 | 42 |
| 3 | 208 | 0 | 14 | 1071 | 11 | 25 | 3074 | 0 |
| 4 | 256 | 0 | 15 | 1076 | 12 | 26 | 3075 | 3 |
| 5 | 258 | 0 | 16 | 1371 | 1 | 27 | 3076 | 3 |
| 6 | 287 | 0 | 17 | 1371 | 0 | 28 | 3184 | 0 |
| 7 | 624 | 2 | 18 | 1408 | 2 | 29 | 3185 | 8 |
| 8 | 703 | 1 | 19 | 1452 | 0 | 30 | 3185 | 9 |
| 9 | 704 | 1 | 20 | 1464 | 9 | 31 | 3187 | 3 |
| 10 | 919 | 0 | 21 | 1465 | 10 | 32 | 3188 | 2 |
| 11 | 956 | 1 | 22 | 1472 | 25 | 33 | 3188 | 2 |
Molecular Orbitals and NBO Analysis
NBO and MO Analysis of (NMe4)+
The log file for the NBO analysis of (NMe4)+ can be found here. The HPC output for the population analysis of (NMe4)+ can be found here: DOI:10042/22016 . The checkpoint file for the MOs of (NMe4)+ can be taken from the HPC output linked before.
%2B_charge_distribution.jpg) |
%2B_charge_distribution_numbers.jpg) |
%2B.jpg) |
%2B.jpg) |
The charge distribution of the molecule in terms of colour is depicted in Figure 27 (the colour/charge range is from -0.43848 (red) to +0.48348 (green)). The charge distribution of the molecule in terms of numbers is shown in Figure 28. The HOMO and LUMO are also displayed in Figures 29 and 30 respectively.
| Criteria | Result |
|---|---|
| File type | .log |
| Calculation type | SP |
| Calculation method | RB3LYP |
| Basis set | 6-31G(d,p) |
| Charge | 1 |
| Spin | Singlet |
| Final Energy (a.u.) | -214.18127384 |
| Dipole moment (D) | 0.0003 |
| Point Group | C1 |
| Duration (min; sec) | 1; 29.6 |
The charge distribution of the molecule is summarised below, taken from the log file.
Summary of Natural Population Analysis:

                                       Natural Population
                Natural  -----------------------------------------------
    Atom  No    Charge         Core      Valence    Rydberg      Total
 -----------------------------------------------------------------------
      C    1   -0.48336      1.99947     4.46939    0.01450     6.48336
      H    2    0.26905      0.00000     0.72994    0.00100     0.73095
      H    3    0.26907      0.00000     0.72993    0.00100     0.73093
      H    4    0.26902      0.00000     0.72998    0.00100     0.73098
      C    5   -0.48345      1.99947     4.46949    0.01450     6.48345
      C    6   -0.48334      1.99947     4.46938    0.01449     6.48334
      H    7    0.26906      0.00000     0.72994    0.00100     0.73094
      H    8    0.26908      0.00000     0.72992    0.00100     0.73092
      H    9    0.26908      0.00000     0.72992    0.00100     0.73092
      H   10    0.26904      0.00000     0.72996    0.00100     0.73096
      H   11    0.26906      0.00000     0.72994    0.00100     0.73094
      H   12    0.26903      0.00000     0.72996    0.00100     0.73097
      C   13   -0.48348      1.99947     4.46952    0.01450     6.48348
      H   14    0.26910      0.00000     0.72990    0.00100     0.73090
      H   15    0.26908      0.00000     0.72992    0.00100     0.73092
      H   16    0.26904      0.00000     0.72995    0.00100     0.73096
      N   17   -0.29508      1.99950     5.28967    0.00591     7.29508
 =======================================================================
   * Total *    1.00000      9.99736    31.92671    0.07592    42.00000
|
The hybridisations of the bonds can be found individually in the log file for the population analysis, but overall are as follows:
- The hybridisation of the C-H bonds is sp3 (25% s character, 75% p character)
- The hybridisation of the C-N bonds is sp3 (21% s character, 79% p character)
The occupancy and energy of the bonds is displayed below, again from the log file. It is evident that all bonds and core MOs have an occupancy of two electrons, as expected according to VSEPR theory. Core orbitals are also much lower in energy than any of the bonds, validating their absence in an MO diagram of the molecule.
Natural Bond Orbitals (Summary):

                                                            Principal Delocalizations
           NBO                        Occupancy    Energy   (geminal,vicinal,remote)
 ====================================================================================
 Molecular unit  1  (C4H12N)
     1. BD (   1) C   1 - H   2          1.99118    -0.71142  127(v)
     2. BD (   1) C   1 - H   3          1.99119    -0.71142  131(v)
     3. BD (   1) C   1 - H   4          1.99118    -0.71143  135(v)
     4. BD (   1) C   1 - N  17          1.98452    -0.90683  55(v),89(v),132(v),129(v)
                                                    124(v),45(v),135(g),131(g)
                                                    127(g)
     5. BD (   1) C   5 - H   7          1.99118    -0.71139  123(v)
     6. BD (   1) C   5 - H   8          1.99118    -0.71142  135(v)
     7. BD (   1) C   5 - H   9          1.99119    -0.71140  131(v)
     8. BD (   1) C   5 - N  17          1.98452    -0.90684  88(v),120(v),134(v),130(v)
                                                    22(v),54(v),123(g),131(g)
                                                    135(g),55(v)
     9. BD (   1) C   6 - H  10          1.99119    -0.71144  135(v)
    10. BD (   1) C   6 - H  11          1.99119    -0.71142  123(v)
    11. BD (   1) C   6 - H  12          1.99118    -0.71142  127(v)
    12. BD (   1) C   6 - N  17          1.98451    -0.90680  23(v),121(v),133(v),126(v)
                                                    45(v),89(v),135(g),123(g)
                                                    127(g),88(v)
    13. BD (   1) C  13 - H  14          1.99118    -0.71138  123(v)
    14. BD (   1) C  13 - H  15          1.99118    -0.71141  131(v)
    15. BD (   1) C  13 - H  16          1.99117    -0.71139  127(v)
    16. BD (   1) C  13 - N  17          1.98453    -0.90697  44(v),54(v),125(v),128(v)
                                                    122(v),22(v),127(g),131(g)
                                                    123(g)
    17. CR (   1) C   1                  1.99946   -10.29151  116(v),32(v),36(v),40(v)
    18. CR (   1) C   5                  1.99946   -10.29153  64(v),68(v),72(v)
    19. CR (   1) C   6                  1.99946   -10.29152  116(v),76(v),80(v),84(v)
    20. CR (   1) C  13                  1.99946   -10.29150  117(v),98(v),102(v),106(v)
    21. CR (   1) N  17
|
Five of the non-core occupied MOs for the molecule are tabulated below, along with their energies (in a.u.). A description of the atomic interactions within these MOS is provided in accompaniment with the MO images.
| MO number | Image | Energy | Description of Interactions | MO number | Image | Energy | Description of Interactions |
|---|---|---|---|---|---|---|---|
| 6 | %2B_MO_chosen_6.jpg) |
-1.19643 | Highly bonding MO. All S orbitals are interacting to make a totally bonding MO of symmetry A1. This is due to very effective AO interactions that create a strong stabilising energy for the MO. There are no nodes in the MO and the MO is very dense - localised in the bonds of the molecule. | 9 | %2B_MO_chosen_9.jpg) |
-0.92553 | Bonding MO. MO is divided into two orbital phases, much like a p-orbital. The orbital is degenerate with two other MOs of the same description. There is one planar node in the MO and the AO interactions are fairly strong, although not as strong as they were for MO 6. The MO is dense, and localised within the bonds of the molecule, with the exception of two of the methyl groups. |
| 13 | %2B_MO_chosen_13.jpg) |
-0.69892 | MO has antibonding character: each phase is adjacent to a lobe of opposite MO phase. This MO is degenerate with two other MOs of the same type. There are two point nodes and one planar node. The MO lobes are localised within the bonds of the molecule, and there are no through space interactions between the lobes that are in-phase, due to the fact that out-of phase lobes block their path. | 17 | %2B_MO_chosen_17.jpg) |
-0.58035 | This MO has four point nodes and is high in antibonding character, indicating weak AO interactions. The MO lobes are located primarily within the methyl C-H bonds, not within the entire molecule. There are no through-space interactions in this case. |
| 21 | |
-0.59730 | This is the HOMO for the molecule and is highly antibonding in character, implying weak AO interactions. There are five point nodes in the MO, each time between out-of-phase lobes. There are through-space interactions between the smaller and larger of the green lobes, due to their proximity. |
MO and NBO Anlysis for (PMe4)+
The log file for the NBO analysis of (PMe4)+ can be found here. The HPC output for the population analysis of (PMe4)+ can be found here: DOI:10042/22018 . The checkpoint file for the MOs of (PMe4)+ can be obtained from the HPC output.
%2B_charge_distribution.jpg) |
%2B_charge_distribution_numbers.jpg) |
%2B.jpg) |
%2B.jpg) |
The charge distribution of the molecule in terms of colour is depicted in Figure 31 (the colour/charge range is fro; -1.667 (red) to +1.667 (green)). The charge distribution of the molecule in terms of numbers is shown in Figure 32. The HOMO and LUMO are also displayed in Figures 33 and 34 respectively.
| Criteria | Result |
|---|---|
| File type | .log |
| Calculation type | SP |
| Calculation method | RB3LYP |
| Basis set | 6-31G(d,p) |
| Charge | 1 |
| Spin | Singlet |
| Final Energy (a.u.) | -500.82702881 |
| Dipole moment (D) | 0.0002 |
| Point Group | C1 |
| Duration (min; sec) | 1; 31.8 |
The charge distribution is summarised below from the log file.
Summary of Natural Population Analysis:

                                       Natural Population
                Natural  -----------------------------------------------
    Atom  No    Charge         Core      Valence    Rydberg      Total
 -----------------------------------------------------------------------
      C    1   -1.06024      1.99942     5.05200    0.00883     7.06024
      H    2    0.29785      0.00000     0.70110    0.00104     0.70215
      H    3    0.29782      0.00000     0.70114    0.00104     0.70218
      H    4    0.29780      0.00000     0.70115    0.00104     0.70220
      C    5   -1.06019      1.99942     5.05195    0.00883     7.06019
      C    6   -1.06021      1.99942     5.05197    0.00883     7.06021
      H    7    0.29780      0.00000     0.70115    0.00104     0.70220
      H    8    0.29782      0.00000     0.70114    0.00104     0.70218
      H    9    0.29781      0.00000     0.70115    0.00104     0.70219
      H   10    0.29782      0.00000     0.70114    0.00104     0.70218
      H   11    0.29783      0.00000     0.70113    0.00104     0.70217
      H   12    0.29782      0.00000     0.70114    0.00104     0.70218
      C   13   -1.06020      1.99942     5.05195    0.00882     7.06020
      H   14    0.29781      0.00000     0.70115    0.00104     0.70219
      H   15    0.29783      0.00000     0.70113    0.00104     0.70217
      H   16    0.29783      0.00000     0.70113    0.00104     0.70217
      P   17    1.66701      9.99814     3.28818    0.04667    13.33299
 =======================================================================
   * Total *    1.00000     17.99581    31.90969    0.09450    50.00000
|
The hybridisations of the bonds individually can be found in the log file, but overall they are as follows:
- The hybridisation of each C-H bond is sp3 hybridised (25% s character, 75% p character)
- The hybridisation of each C-P bond is sp3 hybridised (25% s character, 75% p character)
The occupancy and energies of all these bonds and core orbitals is found below, an extract from the log file. As can be seen, the occupancies for all bonds and core orbitals is two, conforming to the VSEPR model of bonding with a 2c-2e bond. It can also be notes that the core orbitals are too deep in energy to be included in an MO diagram of the molecule.
Natural Bond Orbitals (Summary):

                                                            Principal Delocalizations
           NBO                        Occupancy    Energy   (geminal,vicinal,remote)
 ====================================================================================
 Molecular unit  1  (C4H12P)
     1. BD (   1) C   1 - H   2          1.98385    -0.69147  131(v)
     2. BD (   1) C   1 - H   3          1.98385    -0.69149  135(v)
     3. BD (   1) C   1 - H   4          1.98384    -0.69148  139(v)
     4. BD (   1) C   1 - P  17          1.98031    -0.78615  139(g),135(g),131(g),133(v)
                                                    128(v),136(v)
     5. BD (   1) C   5 - H   7          1.98385    -0.69147  127(v)
     6. BD (   1) C   5 - H   8          1.98386    -0.69147  139(v)
     7. BD (   1) C   5 - H   9          1.98385    -0.69147  135(v)
     8. BD (   1) C   5 - P  17          1.98030    -0.78609  135(g),139(g),127(g),124(v)
                                                    138(v),134(v)
     9. BD (   1) C   6 - H  10          1.98384    -0.69147  139(v)
    10. BD (   1) C   6 - H  11          1.98386    -0.69147  127(v)
    11. BD (   1) C   6 - H  12          1.98385    -0.69147  131(v)
    12. BD (   1) C   6 - P  17          1.98030    -0.78611  127(g),139(g),131(g),137(v)
                                                    125(v),130(v)
    13. BD (   1) C  13 - H  14          1.98384    -0.69148  127(v)
    14. BD (   1) C  13 - H  15          1.98385    -0.69147  135(v)
    15. BD (   1) C  13 - H  16          1.98385    -0.69147  131(v)
    16. BD (   1) C  13 - P  17          1.98030    -0.78612  127(g),135(g),131(g),129(v)
                                                    132(v),126(v)
    17. CR (   1) C   1                  1.99942   -10.25525  36(v),40(v),44(v),121(v)
    18. CR (   1) C   5                  1.99942   -10.25525  120(v),68(v),72(v),76(v)
    19. CR (   1) C   6                  1.99942   -10.25526  122(v),80(v),84(v),88(v)
    20. CR (   1) C  13                  1.99942   -10.25526  121(v),102(v),106(v),110(v)
    21. CR (   1) P  17                  2.00000   -76.49164
    22. CR (   2) P  17                  1.99865    -7.46626  139(g),127(g),135(g),131(g)
    23. CR (   3) P  17                  1.99983    -4.96018
    24. CR (   4) P  17                  1.99983    -4.96018
    25. CR (   5) P  17                  1.99983    -4.96018
|
MO and NBO Analysis for (SMe4)+
The log file for the NBO analysis of (SMe3)+ can be found here. The HPC output for the population analysis of (SMe3)+ can be found here: DOI:10042/22019 . The checkpoint file for the MOs of (SMe3)+ can be founds in the HPC output.
%2B_charge_distribution.jpg) |
%2B_charge_distribution_numbers.jpg) |
%2B.jpg) |
%2B.jpg) |
The charge distribution of the molecule in terms of colour is depicted in Figure 35 (the colour/charge range is fro; -1.667 (red) to +1.667 (green)). The charge distribution of the molecule in terms of numbers is shown in Figure 36. The HOMO and LUMO are also displayed in Figures 37 and 38 respectively.
| Criteria | Result |
|---|---|
| File type | .log |
| Calculation type | SP |
| Calculation method | RB3LYP |
| Basis set | 6-31G(d,p) |
| Charge | 1 |
| Spin | Singlet |
| Final Energy (a.u.) | -517.68326504 |
| Dipole moment (D) | 0.9652 |
| Point Group | C1 |
| Duration (min; sec) | 0; 59.1 |
The charge distribution is shown below, taken from the log file.
Summary of Natural Population Analysis:

                                       Natural Population
                Natural  -----------------------------------------------
    Atom  No    Charge         Core      Valence    Rydberg      Total
 -----------------------------------------------------------------------
      C    1   -0.84543      1.99943     4.83714    0.00887     6.84543
      H    2    0.27858      0.00000     0.71953    0.00189     0.72142
      H    3    0.29732      0.00000     0.70161    0.00107     0.70268
      H    4    0.29731      0.00000     0.70162    0.00107     0.70269
      C    5   -0.84556      1.99943     4.83727    0.00886     6.84556
      H    6    0.29730      0.00000     0.70163    0.00107     0.70270
      H    7    0.29736      0.00000     0.70157    0.00107     0.70264
      H    8    0.27860      0.00000     0.71950    0.00189     0.72140
      C    9   -0.84564      1.99943     4.83735    0.00886     6.84564
      H   10    0.29736      0.00000     0.70156    0.00107     0.70264
      H   11    0.27862      0.00000     0.71949    0.00190     0.72138
      H   12    0.29734      0.00000     0.70159    0.00107     0.70266
      S   13    0.91686      9.99896     5.03944    0.04475    15.08314
 =======================================================================
   * Total *    1.00000     15.99724    25.91929    0.08347    42.00000
|
The hybridisations can also be found in the log file for each bond and lone pair individually. The overall results are as follows:
- The hybridisation of each C-H bond is sp3 (27% s character, 73% p character)
- The hybridisation of each C-S bonds is sp3 (20% s character, 80% p character)
- The hybridisation of the lone pair on S is sp (49% s character, 51% p character)
The occupancy and energies of the bonds and core orbitals is given below, also from the log file. It is obvious that the occupancy is two electrons for both bonds and cores. This fits the VSEPR classic model of a 2c-2e bond. Core orbitals are also noticeably low in energy, validating their omission from an MO diagram of the molecule.
Natural Bond Orbitals (Summary):

                                                            Principal Delocalizations
           NBO                        Occupancy    Energy   (geminal,vicinal,remote)
 ====================================================================================
 Molecular unit  1  (C3H9S)
     1. BD (   1) C   1 - H   2          1.99412    -0.72706
     2. BD (   1) C   1 - H   3          1.98722    -0.72257  109(v),89(v)
     3. BD (   1) C   1 - H   4          1.98723    -0.72256  105(v)
     4. BD (   1) C   1 - S  13          1.98630    -0.82991  106(v),102(v),109(g),105(g)
     5. BD (   1) C   5 - H   6          1.98722    -0.72257  101(v)
     6. BD (   1) C   5 - H   7          1.98721    -0.72252  109(v),90(v)
     7. BD (   1) C   5 - H   8          1.99412    -0.72706
     8. BD (   1) C   5 - S  13          1.98632    -0.83003  100(v),108(v),109(g),101(g)
     9. BD (   1) C   9 - H  10          1.98721    -0.72257  101(v)
    10. BD (   1) C   9 - H  11          1.99412    -0.72709
    11. BD (   1) C   9 - H  12          1.98719    -0.72255  105(v),90(v)
    12. BD (   1) C   9 - S  13          1.98632    -0.83016  103(v),99(v),105(g),101(g)
    13. CR (   1) C   1                  1.99942   -10.30648  101(g),36(v),40(v),32(v)
    14. CR (   1) C   5                  1.99942   -10.30644  105(g),54(v),58(v),62(v)
    15. CR (   1) C   9                  1.99942   -10.30644  109(g),76(v),84(v),80(v)
    16. CR (   1) S  13                  2.00000   -88.28725
    17. CR (   2) S  13                  1.99923    -8.86852
    18. CR (   3) S  13                  1.99989    -6.18071
    19. CR (   4) S  13                  1.99989    -6.18071
    20. CR (   5) S  13                  1.99993    -6.17626
    21. LP (   1) S  13                  1.97343    -0.75311
|
Comparison and Discussion of the Three Cations
An interesting comparison is the effect that changing the central heteroatom has on the charge distribution of the molecule. Below is the tabulated result for the charge distribution of each molecule. AN image has been provided for the trio of cations, all standardised to the same colour/charge range of -1.00 (red) to +1.00 (green).
| Cation | Image | Charge on central heteroatom |
Charge on carbon atoms |
Charge on hydrogen atoms |
|---|---|---|---|---|
| (NMe4)+ | %2B_charge_distribution_fixed.jpg) |
-0.295 | -0.483 | 0.269 |
| (PMe4)+ | %2B_charge_distribution_fixed.jpg) |
1.667 | -1.060 | 0.298 |
| (SMe3)+ | %2B_charge_distribution_fixed.jpg) |
0.917 | -0.845 | 0.297 |
The charges on the carbon and hydrogen atoms in all three cases remain relatively similar. The interesting cases of charge density lie with the heteroatoms. (PMe4)+ and (SMe3)+ both have a positive centre to the cation, whereas (NMe4)+ has a negative nitrogen atom. This result puts into question the traditional visualisation of an NR4+ molecule, where the positive charge is usually drawn to the nitrogen centre. The nitrogen is clearly not positively charge, which means the formal positive charge can only be attributed to the overall balance of the charges associated to each atom within it. Looking more closely at the contributions of the heteroatoms to the C-X bonds will hopefully shed light on this phenomenon. This is tabulated below.
| Cation | Contribution from C | Contribution from X |
|---|---|---|
| (NMe4)+ | 34 % | 66 % |
| (PMe4)+ | 60 % | 40 % |
| (SMe3)+ | 49 % | 51 % |
As can be seen, the contribution from the nitrogen atom to the C-X bond is much greater than for the other two cations. This would explain why it has a negative charge because it is surrounded by the most electron density within the bonds. Conversely, the S and P from the other cations are positively charged because the electron density in the C-X bonds lies more closely to the carbon atoms. Nevertheless, the carbons still remain more negatively charges for (NMe4)+ because the nitrogen is pulling electron density from all around the molecule towards itself, thus pulling the electron density from the hydrogen atoms towards the carbon atoms. The positive charge rests in fact with the hydrogen atoms across the entire molecule, which is not as expected according to the traditional way of representing the cation using VSEPR.
Influence of Functional Groups
Optimisation of (NMe3CH2CN)+
The HPC output for the optimisation of this cation can be found here: DOI:10042/21871 as well as its log file. The operation results are summarised below.
%2B_total_energy_ecm10.jpg)
%2B_gradient_ecm10.jpg)
| Criteria | Result |
|---|---|
| File type | .log |
| Calculation type | FOPT |
| Calculation method | RB3LYP |
| Basis set | 6-31G(d,p) |
| Charge | 1 |
| Spin | Singlet |
| Final Energy (a.u.) | -306.39377062 |
| Gradient (a.u.) | 0.00001824 |
| Dipole moment (D) | 5.7630 |
| Point Group | C1 |
| Duration (min; sec) | 13; 36.8 |
To confirm the calculation has reached a minimum, the "Item" segment of the log file is given below.
Item               Value     Threshold  Converged?
 Maximum Force            0.000051     0.000450     YES
 RMS     Force            0.000009     0.000300     YES
 Maximum Displacement     0.001178     0.001800     YES
 RMS     Displacement     0.000284     0.001200     YES
 Predicted change in Energy=-3.014789D-08
 Optimization completed.
    -- Stationary point found.
|
Optimisation of (NMe3CH2OH)+
The HPC output results can be found here: DOI:10042/21937 as well as the log file associated to it. The operation is summarised below.
%2B_total_energy_ecm10.jpg)
%2B_gradient_ecm10.jpg)
| Criteria | Result |
|---|---|
| File type | .log |
| Calculation type | FOPT |
| Calculation method | RB3LYP |
| Basis set | 6-31G(d,p) |
| Charge | 1 |
| Spin | Singlet |
| Final Energy (a.u.) | -289.39320016 |
| Gradient (a.u.) | 0.00000385 |
| Dipole moment (D) | 1.5790 |
| Point Group | C1 |
| Duration (min; sec) | 15; 28.3 |
To ensure the calculation has converged to a minimum, the "Item" segment of the log file is included below:
Item               Value     Threshold  Converged?
 Maximum Force            0.000009     0.000450     YES
 RMS     Force            0.000002     0.000300     YES
 Maximum Displacement     0.000130     0.001800     YES
 RMS     Displacement     0.000033     0.001200     YES
 Predicted change in Energy=-1.133800D-09
 Optimization completed.
    -- Stationary point found.
|
Vibrational Analysis of (NMe3CH2CN)+
The HPC output for the frequency analysis of the cation can be found here: DOI:10042/21877 , accompanied by its log file.
%2B_spectrum.jpg)
Low frequencies --- -7.0404 -0.0010 -0.0007 0.0010 6.6102 17.2351 Low frequencies --- 92.0852 154.6416 212.9030 |
| Criteria | Result |
|---|---|
| File type | .log |
| Calculation type | FREQ |
| Calculation method | RB3LYP |
| Basis set | 6-31G(d,p) |
| Charge | 1 |
| Spin | Singlet |
| Final Energy (a.u.) | -306.39377062 |
| Gradient (a.u.) | 0.00001831 |
| Dipole moment (D) | 5.7630 |
| Point Group | C1 |
| Duration (min; sec) | 13; 36.8 |
| Mode | Frequency | Intensity | Mode | Frequency | Intensity | Mode | Frequency | Intensity |
|---|---|---|---|---|---|---|---|---|
| 1 | 92 | 6 | 17 | 990 | 20 | 33 | 1502 | 2 |
| 2 | 155 | 9 | 18 | 1009 | 2 | 34 | 1519 | 35 |
| 3 | 213 | 0 | 19 | 1078 | 0 | 35 | 1521 | 46 |
| 4 | 286 | 0 | 20 | 1140 | 0 | 36 | 1533 | 61 |
| 5 | 288 | 0 | 21 | 1140 | 0 | 37 | 2384 | 8 |
| 6 | 327 | 1 | 22 | 1221 | 0 | 38 | 3087 | 1 |
| 7 | 352 | 0 | 23 | 1259 | 1 | 39 | 3090 | 1 |
| 8 | 379 | 0 | 24 | 1295 | 0 | 40 | 3091 | 0 |
| 9 | 417 | 0 | 25 | 1332 | 3 | 41 | 3097 | 0 |
| 10 | 436 | 1 | 26 | 1394 | 8 | 42 | 3145 | 2 |
| 11 | 443 | 0 | 27 | 1454 | 8 | 43 | 3189 | 0 |
| 12 | 571 | 2 | 28 | 1455 | 3 | 44 | 3192 | 0 |
| 13 | 746 | 0 | 29 | 1476 | 3 | 45 | 3193 | 0 |
| 14 | 895 | 28 | 30 | 1486 | 0 | 46 | 3197 | 0 |
| 15 | 912 | 19 | 31 | 1495 | 4 | 47 | 3198 | 0 |
| 16 | 963 | 14 | 32 | 1496 | 0 | 48 | 3202 | 0 |
Vibrational Analysis of (NMe3CH2OH)+
Vibrational analysis was attempted twice on the molecule from a new optmisation every time, yet a negative frequency was obtained for each attempt. Following on from this, the input settings were changed by:
- converting the coordinated to Cartesian
- tightening the parameters
No improvement to the result could be found. The HPC output can be found here: DOI:10042/21936 , as well as the log file. The vibrations below are reported with the negative frequency.
%2B_spectrum.jpg)
| Criteria | Result |
|---|---|
| File type | .log |
| Calculation type | FREQ |
| Calculation method | RB3LYP |
| Basis set | 6-31G(d,p) |
| Charge | 1 |
| Spin | Singlet |
| Final Energy (a.u.) | -289.39320016 |
| Gradient (a.u.) | 0.00000389 |
| Dipole moment (D) | 1.579 |
| Point Group | C1 |
| Duration (min; sec) | 13; 9.7 |
| Mode | Frequency | Intensity | Mode | Frequency | Intensity | Mode | Frequency | Intensity |
|---|---|---|---|---|---|---|---|---|
| 1 | -105 | 150 | 17 | 1078 | 0 | 33 | 1514 | 17 |
| 2 | 121 | 0 | 18 | 1117 | 40 | 34 | 1518 | 35 |
| 3 | 210 | 0 | 19 | 1171 | 3 | 35 | 1536 | 52 |
| 4 | 264 | 1 | 20 | 1174 | 41 | 36 | 1552 | 14 |
| 5 | 266 | 1 | 21 | 1213 | 51 | 37 | 3031 | 20 |
| 6 | 290 | 3 | 22 | 1243 | 1 | 38 | 3087 | 12 |
| 7 | 363 | 0 | 23 | 1289 | 29 | 39 | 3088 | 1 |
| 8 | 389 | 4 | 24 | 1309 | 14 | 40 | 3094 | 4 |
| 9 | 440 | 1 | 25 | 1335 | 4 | 41 | 3099 | 2 |
| 10 | 449 | 0 | 26 | 1447 | 7 | 42 | 3186 | 0 |
| 11 | 553 | 14 | 27 | 1453 | 6 | 43 | 3190 | 1 |
| 12 | 738 | 12 | 28 | 1457 | 2 | 44 | 3190 | 0 |
| 13 | 885 | 66 | 29 | 1482 | 0 | 45 | 3194 | 1 |
| 14 | 925 | 19 | 30 | 1496 | 4 | 46 | 3214 | 0 |
| 15 | 975 | 7 | 31 | 1500 | 0 | 47 | 3218 | 1 |
| 16 | 1068 | 2 | 32 | 1509 | 23 | 48 | 3827 | 141 |
MO and NBO Analysis for (NMe3CH2CN)+
The HPC output (and checkpoint file) for the MO and NBO analysis can be found here: DOI:10042/21924 . The log file for the NBO analysis can be found here.
%2B_charge_distribution.jpg) |
%2B_charge_distribution_numbers.jpg) |
%2B.jpg) |
%2B.jpg) |
The operation is summarised below.
| Criteria | Result |
|---|---|
| File type | .log |
| Calculation type | SP |
| Calculation method | RB3LYP |
| Basis set | 6-31G(d,p) |
| Charge | 1 |
| Spin | Singlet |
| Final Energy (a.u.) | -306.39377062 |
| Dipole moment (D) | 5.7630 |
| Point Group | C1 |
| Duration (min; sec) | 2; 17.9 |
The charge distribution for the molecule is shown in Figure 45 (in colour) and in Figure 46 (in numbers). The colour range is from -0.489 (red, negative charge) to +0.489 (green, positive charge). The HOMO for the molecule is given by Figure 47, and the LUMO by Figure 48.
The charge distribution for the molecule is summarised below from the log file.
Summary of Natural Population Analysis:

                                       Natural Population
                Natural  -----------------------------------------------
    Atom  No    Charge         Core      Valence    Rydberg      Total
 -----------------------------------------------------------------------
      C    1   -0.48852      1.99946     4.47439    0.01468     6.48852
      H    2    0.26947      0.00000     0.72952    0.00101     0.73053
      H    3    0.28208      0.00000     0.71679    0.00113     0.71792
      H    4    0.27372      0.00000     0.72531    0.00098     0.72628
      C    5   -0.48852      1.99946     4.47439    0.01468     6.48852
      C    6   -0.48533      1.99946     4.47118    0.01468     6.48533
      H    7    0.26947      0.00000     0.72952    0.00101     0.73053
      H    8    0.27372      0.00000     0.72531    0.00098     0.72628
      H    9    0.28208      0.00000     0.71679    0.00113     0.71792
      H   10    0.27687      0.00000     0.72217    0.00096     0.72313
      H   11    0.27074      0.00000     0.72824    0.00101     0.72926
      H   12    0.27074      0.00000     0.72824    0.00101     0.72926
      C   13   -0.35761      1.99915     4.34257    0.01588     6.35761
      H   14    0.30885      0.00000     0.68972    0.00143     0.69115
      H   15    0.30885      0.00000     0.68972    0.00143     0.69115
      N   16   -0.28904      1.99950     5.28314    0.00641     7.28904
      C   17    0.20869      1.99940     3.75873    0.03319     5.79131
      N   18   -0.18627      1.99966     5.16587    0.02074     7.18627
 =======================================================================
   * Total *    1.00000     13.99608    39.87160    0.13233    54.00000
|
The -CN group on the molecule is an electron-withdrawing group. By pulling electron density towards itself, the adjacent carbon atom gains a positive charge. In comparison to all the other carbons in the molecule, this carbon from the cyano group is extremely positive in charge (0.21 compared to -0.49 on the methyl carbons and -0.35 on the CH2 carbon). Interestingly, the positive charge on the cation is not actually positioned on the central nitrogen atom. The positive charge points of the molecules are distributed across all the terminal hydrogen atoms of the methyl groups and the carbon atom of the cyano group. These positive charges, balanced with the negative charges of the molecule give the molecules its +1 positive charge. In other words, this does not fit the classic view that the positive charge is localised on one particular atom.
The hybridisations for each bond are as follows. (The individual bond and lone pair information can be found in the log file.)
- Each C-H bond is sp3 hybridised (25% s character, 75% p character approximately)
- Each C-N bond (for the central N) is sp3 hybridised (25% s character, 75% p character)
- The C-C bond is sp3 hybridised (27% s character, 73% p character)
- The C-N bond is sp hybridised (48% s character, 52% p character), indicating that a triple bond is present
The occupancy and energy of each bond is summarsed below from the log file. Overall, two electrons populate each bond and each lone pair, giving the molecule the classic 2c-2e bond model that fits with VSEPR. It is also evident from the energies of the core orbitals (CR) that these are very much deeper in energy, and are therefore not included an the MO diagram of the molecule.
Natural Bond Orbitals (Summary):

                                                            Principal Delocalizations
           NBO                        Occupancy    Energy   (geminal,vicinal,remote)
 ====================================================================================
 Molecular unit  1  (C5H11N2)
     1. BD (   1) C   1 - H   2          1.99102    -0.72198  149(v)
     2. BD (   1) C   1 - H   3          1.98996    -0.72018  153(v)
     3. BD (   1) C   1 - H   4          1.98974    -0.72131  156(v)
     4. BD (   1) C   1 - N  16          1.98448    -0.92019  50(v),94(v),151(v),146(v)
                                                    154(v),61(v),153(g),149(g)
                                                    156(g)
     5. BD (   1) C   5 - H   7          1.99102    -0.72198  145(v)
     6. BD (   1) C   5 - H   8          1.98974    -0.72131  156(v)
     7. BD (   1) C   5 - H   9          1.98996    -0.72018  153(v)
     8. BD (   1) C   5 - N  16          1.98448    -0.92019  28(v),94(v),152(v),142(v)
                                                    155(v),61(v),153(g),145(g)
                                                    156(g)
     9. BD (   1) C   6 - H  10          1.98974    -0.72523  156(v)
    10. BD (   1) C   6 - H  11          1.99104    -0.72677  145(v)
    11. BD (   1) C   6 - H  12          1.99104    -0.72677  149(v)
    12. BD (   1) C   6 - N  16          1.98351    -0.92283  157(v),95(v),143(v),148(v)
                                                    29(v),51(v),156(g),145(g)
                                                    149(g)
    13. BD (   1) C  13 - H  14          1.97040    -0.74005  159(v),158(v),145(v),123(v)
                                                    160(v),157(g)
    14. BD (   1) C  13 - H  15          1.97041    -0.74005  159(v),158(v),149(v),123(v)
                                                    160(v),157(g)
    15. BD (   1) C  13 - N  16          1.97744    -0.92388  160(v),158(v),60(v),150(v)
                                                    144(v),147(v),29(v),51(v)
                                                    124(v),145(g),149(g)
    16. BD (   1) C  13 - C  17          1.98886    -0.91562  158(g),132(v),153(v),154(g)
                                                    155(g)
    17. BD (   1) C  17 - N  18          1.99595    -1.21722  157(g),122(g),96(v)
    18. BD (   2) C  17 - N  18          1.98640    -0.50924  154(v),155(v)
    19. BD (   3) C  17 - N  18          1.96825    -0.50997  156(v),154(v),155(v),97(v)
    20. CR (   1) C   1                  1.99945   -10.30159  42(v),46(v),38(v)
    21. CR (   1) C   5                  1.99945   -10.30159  78(v),74(v),70(v)
    22. CR (   1) C   6                  1.99946   -10.30707  82(v),86(v),90(v)
    23. CR (   1) C  13                  1.99915   -10.34254  158(v),122(v),120(v),104(v)
                                                    108(v)
    24. CR (   1) N  16                  1.99950   -14.50022  30(v),52(v),62(v)
    25. CR (   1) C  17                  1.99940   -10.27375  95(v),132(v),133(v),158(g)
    26. CR (   1) N  18                  1.99965   -14.25140  122(v),157(v)
    27. LP (   1) N  18                  1.96783    -0.68180
|
MO and NBO Analysis for (NMe3CH2OH)+
The HPC output can be found here: DOI:10042/21935 , as well as the checkpoint file. The log file for the NBO analysis can be found here.
%2B_charge_distribution.jpg) |
%2B_charge_distribution_numbers.jpg) |
%2B.jpg) |
%2B.jpg) |
The operation is summarised below.
| Criteria | Result |
|---|---|
| File type | .log |
| Calculation type | SP |
| Calculation method | RB3LYP |
| Basis set | 6-31G(d,p) |
| Charge | 1 |
| Spin | Singlet |
| Final Energy (a.u.) | -289.39320016 |
| Dipole moment (D) | 1.5790 |
| Point Group | C1 |
| Duration (min; sec) | 1; 57.7 |
The charge distribution for the molecule is shown in Figure 49 (in colour) and in Figure 50 (in numbers). The colour range is from -0.757 (red, negative charge) to +0.757 (green, positive charge). The HOMO for the molecule is given by Figure 51, and the LUMO by Figure 52.
The charge distribution of the molecule is summarised below from the log file.
Summary of Natural Population Analysis:

                                       Natural Population
                Natural  -----------------------------------------------
    Atom  No    Charge         Core      Valence    Rydberg      Total
 -----------------------------------------------------------------------
      C    1    0.09398      1.99938     3.88268    0.02396     5.90602
      H    2    0.23383      0.00000     0.76414    0.00203     0.76617
      H    3    0.23382      0.00000     0.76415    0.00203     0.76618
      C    4   -0.48797      1.99946     4.47339    0.01512     6.48797
      H    5    0.28541      0.00000     0.71317    0.00142     0.71459
      H    6    0.26616      0.00000     0.73284    0.00100     0.73384
      H    7    0.26368      0.00000     0.73531    0.00101     0.73632
      C    8   -0.48859      1.99946     4.47502    0.01411     6.48859
      H    9    0.27393      0.00000     0.72507    0.00100     0.72607
      H   10    0.26806      0.00000     0.73083    0.00111     0.73194
      H   11    0.26805      0.00000     0.73084    0.00111     0.73195
      C   12   -0.48797      1.99946     4.47339    0.01512     6.48797
      H   13    0.28542      0.00000     0.71316    0.00142     0.71458
      H   14    0.26370      0.00000     0.73529    0.00101     0.73630
      H   15    0.26615      0.00000     0.73285    0.00100     0.73385
      N   16   -0.31306      1.99949     5.30635    0.00722     7.31306
      O   17   -0.75651      1.99980     6.74443    0.01228     8.75651
      H   18    0.53190      0.00000     0.46489    0.00321     0.46810
 =======================================================================
   * Total *    1.00000     11.99705    37.89779    0.10516    50.00000
|
Functional group plays an important part once more in the charge distribution of this molecule. The oxygen and its two lone pairs create a point of high negative charge (-0.75). The other negative points in the molecule are on the nitrogen, due to its electronegativity, and the methyl group carbon atoms. The positive charge is located on the terminal hydrogen atoms and the carbon adjacent to the oxygen (it has been stripped of its electron density by the oxygen atom). Once again this demonstrates the fact that the positive charge is not localised on any particular atom, and especially not on the nitrogen atom! The positive charge exists in the molecule as an overall balance of all the charges.
The hybridisations of the bonds in the molecules are as follows. (The individual bond hybridisations can be found in the log file).
- The C-H bonds are all sp3 hybridised (25% s character, 75% p character approximately)
- The C-N bonds are all sp3 hybridised (21% s character, 79% p character approximately)
- The C-O bond is sp3 hybridised (23% s character, 76% p character)
- The O-H bond is sp3 hybridised (21% s character, 79% p character)
- The first O lone pair is sp hybridised (48% s character, 52% p character)
- The second O lone pair is purely of p character (100% p character)
The occupancy and energy of each bond, core orbital and lone pair is summarised below. All occupancies are of 2 electrons, once again confirming the classic 2c-2e system that conforms to VSEPR theory.
Natural Bond Orbitals (Summary):

                                                            Principal Delocalizations
           NBO                        Occupancy    Energy   (geminal,vicinal,remote)
 ====================================================================================
 Molecular unit  1  (C4H12NO)
     1. BD (   1) C   1 - H   2          1.98965    -0.72293  149(v),120(v)
     2. BD (   1) C   1 - H   3          1.98965    -0.72288  141(v),120(v)
     3. BD (   1) C   1 - N  16          1.98120    -0.90123  150(v),66(v),88(v),44(v)
                                                    142(v),139(v),148(v),141(g)
                                                    149(g),145(g),121(v)
     4. BD (   1) C   1 - O  17          1.99652    -1.04292  145(v)
     5. BD (   1) C   4 - H   5          1.99082    -0.69885  145(v)
     6. BD (   1) C   4 - H   6          1.99029    -0.70300  136(v)
     7. BD (   1) C   4 - H   7          1.99105    -0.70267  149(v)
     8. BD (   1) C   4 - N  16          1.98417    -0.89829  143(v),147(v),27(v),67(v)
                                                    135(v),89(v),145(g),149(g)
                                                    136(g)
     9. BD (   1) C   8 - H   9          1.99042    -0.70906  136(v)
    10. BD (   1) C   8 - H  10          1.99101    -0.71051  141(v)
    11. BD (   1) C   8 - H  11          1.99101    -0.71051  149(v)
    12. BD (   1) C   8 - N  16          1.98421    -0.90674  137(v),45(v),89(v),138(v)
                                                    146(v),28(v),141(g),149(g)
                                                    136(g)
    13. BD (   1) C  12 - H  13          1.99082    -0.69885  145(v)
    14. BD (   1) C  12 - H  14          1.99105    -0.70266  141(v)
    15. BD (   1) C  12 - H  15          1.99030    -0.70300  136(v)
    16. BD (   1) C  12 - N  16          1.98417    -0.89828  144(v),140(v),27(v),67(v)
                                                    134(v),45(v),145(g),141(g)
                                                    136(g)
    17. BD (   1) O  17 - H  18          1.98019    -0.89215  136(v),28(v)
    18. CR (   1) C   1                  1.99938   -10.35785  118(v),137(g)
    19. CR (   1) C   4                  1.99946   -10.28082  54(v),117(v),58(v),62(v)
    20. CR (   1) C   8                  1.99946   -10.28965  110(v),76(v),80(v),84(v)
    21. CR (   1) C  12                  1.99946   -10.28081  98(v),117(v),106(v),102(v)
    22. CR (   1) N  16                  1.99949   -14.47251  46(v),90(v),68(v),26(v)
    23. CR (   1) O  17                  1.99980   -19.15538  26(v),28(v),31(v)
    24. LP (   1) O  17                  1.96290    -0.77611  136(v),26(v),134(v),135(v)
                                                    131(v),31(v)
    25. LP (   2) O  17                  1.95480    -0.48242  135(v),134(v),130(v),29(v)
|
Comparisons and Discussion
The effect of functional group can have important effects on the properties of the ionic liquid. Below is a table of comparison for the HOMOs and LUMOs of (NMe4)+, (NMe3CH2CN)+ and (NMe3CH2OH)+.
| Molecule | HOMO | Energy (a.u.) | LUMO | Energy (a.u.) | HOMO-LUMO energy gap (a.u.) |
|---|---|---|---|---|---|
| (NMe4)+ | |
-0.57930 | |
-0.13303 | 0.44627 |
| (NMe3CH2CN)+ | |
-0.53926 | |
-0.11009 | 0.42917 |
| (NMe3CH2OH)+ | |
-0.51513 | |
-0.17636 | 0.33877 |
As can be seen, there is a change in HOMO-LUMO energy gaps as the functional group is changed. The greatest energy gap lies with (NMe4)+. The presence of an electron donating group such as OH has the effect of decreasing this gap more significantly than an electron-withdrawing group like CN. Chemically, this means that the reactivity of a cation that has an electron-donating group is increased, since less energy must be used to promote electrons to the LUMO, thereby pushing it into an excited state.
The shape of the HOMO and LUMO orbitals remains fairly similar, but there are noticeable changes. The HOMOs for the two altered molecules look much more similar to each other than the parent ion (the only difference is the size of the lobes), whereas the LUMO orbital is more different in the sense that it is less diffuse for the ion with the CN group compared to the other two.
References
1. Julius Glaser, Georg Johansson, Acta Chemica Scandinavia, 1982, A36, 125-135. DOI: 10.3891/acta.chem.scand.36a-0125
- ↑ 1
- ↑ Julius Glaser and Georg Johansson, "On the Structures of Hydrated Thallium(III) Ion and its Bromide Complexes in Aqueous Solution"> "Acta Chemica Scandinavia", 1982, A36, 125 - 135: DOI:10.3891/acta.chem.scand.36a-0125