Rep:Mod:2qpzm1029
Module 2: Bonding (Ab initio and density functional molecular orbital)
This experiment aims to make use of computational techniques to aid in the prediction and characterisation of compounds in inorganic chemistry. The main tool will be the Gaussian interface, which we will use for 3 major purposes:
1) To optimise geometries (bond lengths and angles)
3) To calculate the molecular orbitals of a molecule
2) To predict the vibrational frequencies of the bonds in a compound and hences its infrared spectrum
These techniques are not limited to inorganic chemistry. They can also be utilised quite reliably in organic chemistry but in this experiment we will focus primarily on inorganic molecules.
Optimising small molecules
BH3
As an introductory example, an optimisation will be run on a BH3 molecule. Optimisations are done by constantly calculating the potential energy of a molecule after every small change in geometry. By doing this, a potential energy curve is generated and new bond lengths and angles are tried until this curve reaches a minimum value. The computer knows it has reached a stationary point by calculating dy/dx (the gradient) for every point on the curve and a gradient of zero indicates it is a stationary point. The computer also knows that this point is a minimum (rather than a maximum) in the energy because d2y/dx2 will equal a (positive) value greater than 0.
The optimisation itself was a DFT calculation with the B3LYP method and 3-21G basis set and the results are shown below.
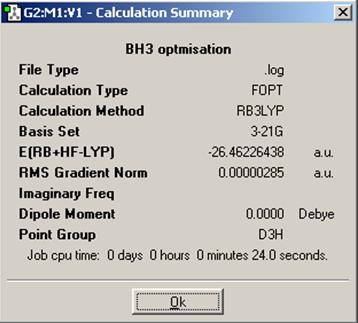
From the resulting summary file, we can see things such as what method and basis set were used, the energy of the molecule as well as the final energy gradient, the dipole moment (non-existant in this case), the point group, and how long the calculation took to run.
We can also instruct Gaussview to view intermediate geometries which allows us to view the potential energy of every iteration of the optimisation as well as the correspending gradient for all of these energies.

We can see that the calculation ended once the gradient had reached zero and the potential energy had consequently reached a minimum. The minimised BH3 molecule is below.
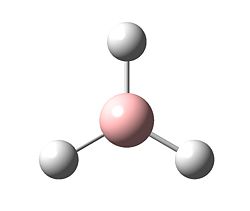
The structure can then be analysed in gaussview and the bond lengths and bond angles were found to be the following:
B - H bond length = 1.19435 angstroms
H - B - H angle = 120.000 degrees
The perfect 120.000 degree bond angles correspond to D3h symmetry as expected.
BCl3
In order to illustrate the use of pseudo-potentials, a further introductory example will be run on a BCl3 molecule. An almost identical calculation was run as with BH3 with the difference being that the basis set used was LANL2MB (the method was still B3LYP). This basis set, as opposed to 3-21G, applies a pseudo-potential to the core electrons on the chlorine atoms not involved in bonding. The result is that the calculation is faster whithout losing a significant amount of accuracy so is particularly useful for non-first row elements.
The results are below.
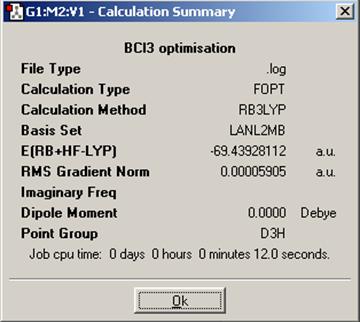
We can see that this calculation was quicker than that for BH3, which is probably down to the pseudo-potential applied by the LANL2MB basis set. The energies are slightly different, which is expected, however we cannot quantitatively compare absolute values for energy unless the exact same method AND basis set have been used, and in this case they have not. The purpose of these exercises are merely as examples so we will not concern ourselves with exact energies at this point.
The structure:
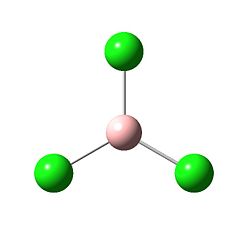
The bond lengths and bond angles were found to be the following:
B - Cl bond length = 1.86592 angstroms
Cl - B - Cl angle = 120.000 degrees
The B - Cl bond length is longer than the B - H bond length, which is likely due to the fact the the overlaping orbitals of BCl3 are not as close in energy as those in BH3. Once again, the perfect 120.000 degree bond angles correspond to D3h.
H2O
A final simple molecule will be optimised before commencing to the more in-depth parts of this experiment. For the purpose, H2O will be minimised using B3LYP/3-21G.

We can see that unlike BH3 or BCl3, H2 has a dipole moment of 2.231 debeye, owing to its non-bonding lone pairs. In addition, as this molecule was run with the same method and basis set as BH3, we can say see that it is lower in energy than BH3 by 49.512 hartrees atomic units.
The structure:
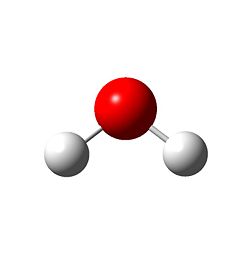
The bond lengths and bond angles were found to be the following:
O - H bond length = 0.99683 angstroms
H - O - H angle = 103.991 degrees
The O - H bond length is consiberably shorter than the B - H length, which is likely due to the better overlap of the bonding orbitals in H2O. The bonding angle of approximately 104 degrees demonstrates the calculation taking into account the oxygen lone pairs, leading to a bent structure with C2v symmetry, as predicted by VSEPR theory.
Vibrational Analysis and Molecular Orbital Calculations
We will now use the BH3 molecule we optimised earlier to show how we can use the Gaussian interface to calculate vibrational frequencies and molecular orbitals.
Vibrations
First of all, the vibrational frequencies of BH3 were calculated using the same method and basis set as for the optimisation (B3LYP/3-21G). The results are tabulated below.
The graphic for each vibration has the BH3 molecule in wireframe form as this makes it much easier to see the displacement vectors when they cut through the bonds.
| Vibration number | Frequency (cm-1) | Intensity | Graphic | (D3h) Symmetry |
|---|---|---|---|---|
| 1 | 1145.71 | 92.6991 |  |
A"2 |
| 2 | 1204.66 | 12.3789 | 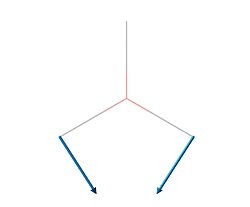 |
E' |
| 3 | 1204.66 | 12.3814 | 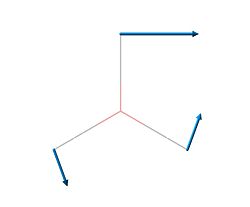 |
E' |
| 4 | 2592.79 | 0 | 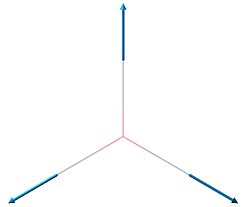 |
A'1 |
| 5 | 2731.31 | 103.837 | 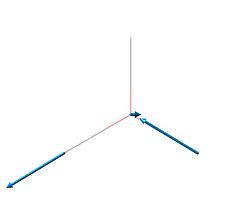 |
E' |
| 6 | 2731.31 | 103.830 | 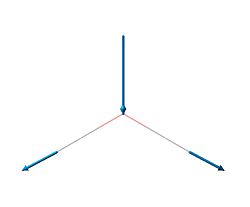 |
E' |
The frequencies together with their intensities can be put on a diagram to simulate an IR spectrum of a BH3 molecule.
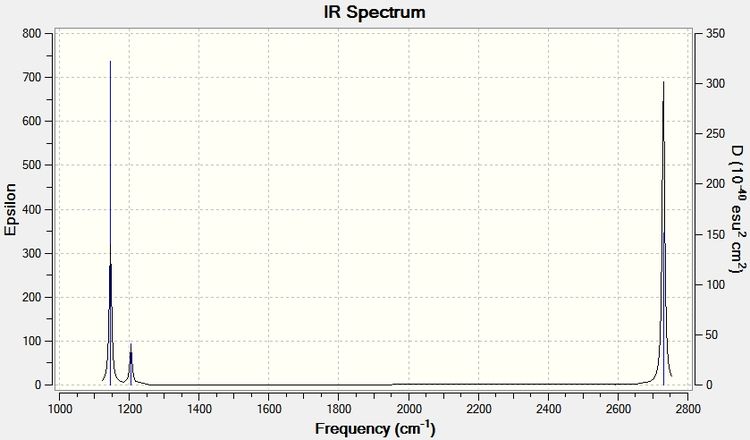
It can be seen from the spectrum that vibration 4 is missing, but this is expected as in order for a vibration to appear on an IR spectrum there must be a net change in dipole moment. This vibration is an A'1 (high symmetry) vibration, meaning there is no change in dipole moment. Incidentally, the calculated intensity of this vibration is zero in the above table.
Molecular Orbitals
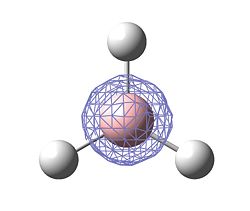
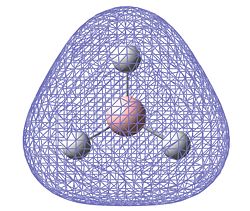
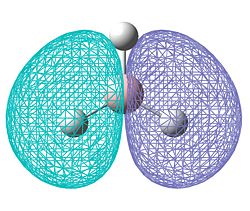
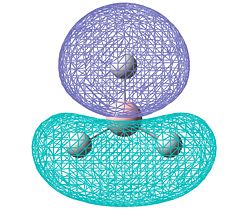
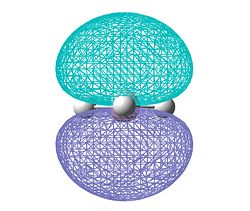
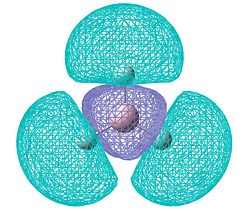
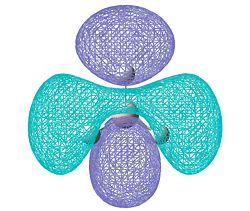
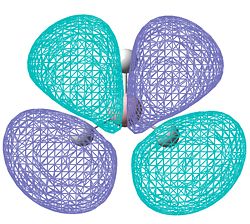
The molecular orbitals were then calculated and are tabulated below together with their qualitative atomic orbitals. First we will draw the qualitative MO diagram for BH3 so that it can be compared with the quantitative output from the calculation.
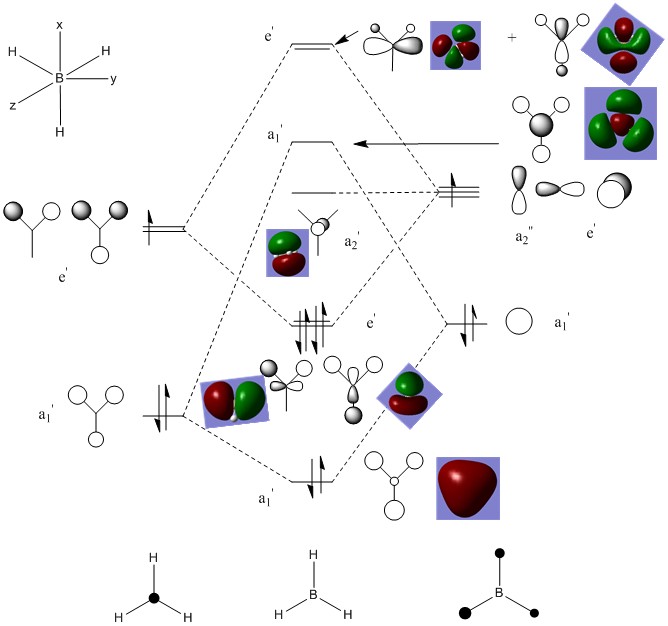
Now the calculated orbitals are tabulated.
Note that HOMO - 2 (1a1') is not shown on the qualitative diagram as it is the boron 1s orbital which is too low in energy to contribue to the bonding with the H3 fragment.
Comparing the qualitative with the quantitative results, it can be seen that they match very well. The combination of atomic orbitals has demonstrated itself to be be a very effective tool as it produces very good results and is particularly useful for rationalising organic reactivity where calculating a molecular surface which covers the whole molecule can make things rather difficult to visualise.
Cis and Trans Isomerism in Transition Metal Complexes
In this exercise, DFT calculations will be used to predict the relative stabilities of cis-Mo(CO)4(PMe3)2 and trans-Mo(CO)4(PMe3)2. Typically, chemists would use PPh3 ligands as opposed to PMe3 (as was done in the second year synthesis lab) but for the purpose of completing this exercise in a reasonable time-scale, the less computationally demanding PMe3 ligand will be used.
Geometry Optimisations
Both the trans and the cis complexes were draw in Gaussview and then optimised using the B3LYP method and LANL2MB basis set in order to apply a pseudo-potential for the phosphorus core electrons. The term "opt=loose" is added to the keywords in order to set loose convergence as otherwise the first derivative for this particular example never converge on zero with the LANL2MB basis set. This optimisation was sent to SCAN as it is too intensive to be run on the laptop.
After this first optimisation was completed, a further optimisation was run with the same method, but with the better LANL2DZ basis set. With this better basis set, the "opt=loose" term could be removed and replaced with "int=ultrafine scf=conver=9" which increase the convergence beyond the default, therefore yielding more accurate results.
3D structures of the cis and trans molybdenum complexes are shown below.
Cis isomer:
Mo PMe3 cis 2qpzm1029 |
Trans isomer:
Mo PMe3 trans 2qpzm1029 |
In order to check the accuracy of our calculation, the bond lengths and angles should be compared to the those found in the literature for the cis and trans complexes.
Note that the values given below are average bond lengths in angstroms
| Cis | Cis - lit.[1] | Trans | Trans - lit.[2] | |
|---|---|---|---|---|
| P - Mo bond length | 2.648 | 2.522 | 2.572 | 2.500 |
| P - Mo bond angle (degrees) | 92.92 | 97.54 | 179.97 | 180.0 |
| C - Mo bond length for CO cis to PMe3 | 2.033 | 2.032 | 2.029 | 2.011 |
| C - Mo bond length for CO trans to PMe3 | 1.982 | 1.9705 | - | - |
We can see that there is generally a good match with the literature for the trans complex, but there is a significant difference for the cis, particuarly in the P - Mo bond length and angle. In order to correct this, we require an improvement. Our previous calculation neglected the contribution of the d orbitals of phosphorus on the bonding. We know that Phosphine ligands are good π acceptor ligands due to vacant low lying d orbitals so in order to improve the accuracy of our results we must take these into account.
This was done by adding the word "extrabasis" to the keywords of the gaussian input file and adding the following to the end of input file itself:
(blank line)
P 0
D  1  1.0
0.55  0.100D+01
* * * *
(blank line)
Once this was done, the optimisation was run again with B3LYP/LANL2DZ and the new results have been tabulated again for comparison with the literature.
| Cis | Cis - lit.[1] | Trans | Trans - lit.[2] | |
|---|---|---|---|---|
| P - Mo bond length | 2.589 | 2.522 | 2.525 | 2.500 |
| P - Mo bond angle (degrees) | 94.00 | 97.54 | 178.85 | 180.0 |
| C - Mo bond length for CO cis to PMe3 | 2.032 | 2.032 | 2.029 | 2.030 |
| C - Mo bond length for CO trans to PMe3 | 1.994 | 1.9705 | - | - |
The addition of d orbitals into the calculation has clearly made a significant improvement in making the P - Mo bond length closer to the literature value for the cis complex. A modest improvement has also occured for the cis complex. Some of the other values have changed slightly but by relatively small amounts compared to the change in P - Mo bond length so we will not concern ourselves much with these changes and the matches in the other areas were fairly good anyway. The addition of the "extrabasis" function has demonstrated the difference made when other bonding contributions (in this case back-bonding to d orbitals) are included in the calculation.
IR Analysis
A very useful tool in differentiating between cis and trans isomers is their vibrational spectra, specifically looking for the presence (or absence) of the carbonyl stretches. For this reason the the vibrational frequencies of both complexes have been calculated. This was done using the optimised structure taking into account the phosphorous d orbitals as this has proved most accurate.
The results are tabulated below (in cm-1) together with their corresponding literature values.
| Cis (intensity) | Cis - lit.[1] | Trans (intensity) | Trans - lit.[1] |
|---|---|---|---|
| 1850.01 (1971.44) | 1899 | 1841.88 (2007.12) | 1895 |
| 1855.51 (1070.93) | 1905 | 1842.05 (2008.75) | - |
| 1873.76 (666.61) | 1922 | 1884.96 (1.7058) | - |
| 1961.83 (344.59) | 2019 | 1957.34 (0.5729) | - |
We can see that the calculated frequencies are not the same as the literature, however they are all off by approximately the same amount so it is clear which calculated frequency corresponds to which literature frequency. The exact frequencies themselves are not as important as which carbonyl stretches are present or absent, for this allows us to predict whether the structure is cis or trans.
The resulting infrared spectra are shown below:
Cis isomer:
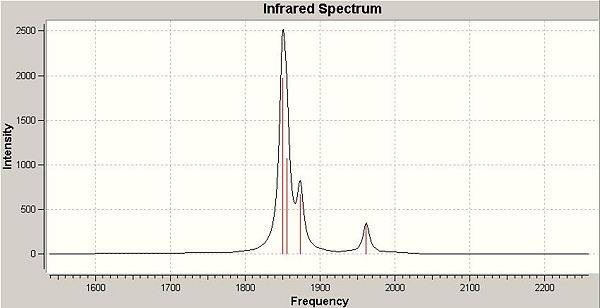
Trans isomer:
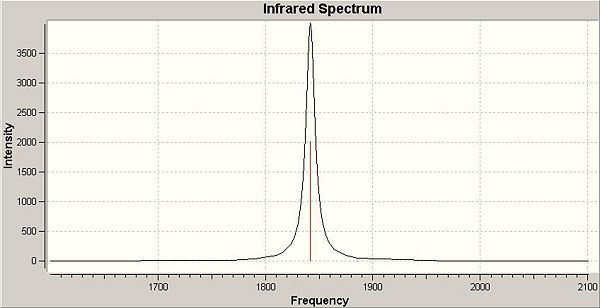
It should also be noted that the vibrations for the trans complex at 1841.88 and 1842.05 cm-1 are extremely close to one another and are essentially the same vibration as they are both due to the Eu mode from the irreducible representation (this will be explained shortly) and hence, only one signal is visible on the IR spectrum. In addition, the vibrations at 1884.96 and 1957.34 cm-1 have almost zero intensity which is why they are not visible on the spectrum. They are in fact not infrared active vibrations as there is no net change in dipole moment from these carbonyl stretches.
Through application of group theory, we can explain why we see four signals in the IR spectrum for the cis isomer but only 1 for the trans. The first thing that's required is to work out the irreducible representations of the two isomers. This can be done by using the reduction formula but for simplicity and to save time, they have been found in the literature[3].
The cis complex has pseudo C2v symmetry (pseudo because this is only true when treating the PMe3 ligands as point charges) and has the irreducible representation Γirr = 2A1 + B1 + B2.
The trans complex has pseudo D4h symmetry and has the irreducible representation Γirr = A1g + B1g + Eu.
By animating the vibrations in gaussview, we can use the character tables for the C2v and D4h point groups to assign each of the vibrations.
| Cis | mode (C2v) | Trans | mode (D4h) |
|---|---|---|---|
| 1850.01 | B2 | 1841.88 | Eu |
| 1855.51 | B1 | 1842.05 | Eu |
| 1873.76 | A1 | 1884.96 | B1g |
| 1961.83 | A1 | 1957.34 | A1g |
For the Cis complex, all the modes of vibration cause changes in dipole moment so are IR active. The A1 modes are of the same symmetry and similar energy so couple with each other strongly.
For the trans complex, only the Eu mode is IR active as A1g and B1g vibrations cause no net dipole change. From this explanation, we would ideally only expect to see one frequency from the calculation, however, the tetragonal shape of the phosphine ligands breaks the perfect D4h symmetry (resulting in pseudo-symmetry), and thus slight splitting on the Eu mode and very slight level of 'allowedness' of the A1g and B1g modes. This is why we see 4 stretching frequencies, but the Eu splitting is so small and the the A1g and B1g are so small that we do not observe these on the IR spectrum and indeed we only saw one signal in the predicted IR spectrum.
Cis/Trans ordering
We can examine the overall energies of each isomer to determine which one is thermodynamically favoured over the other. We will do separate analyses for the energies found with the LANL2DV basis set without taking into account phosphorus d orbitals, and the LANL2DV calculation taking into account phosophorous d orbital contributions.
The calculated energies were returned in Hartrees but they have been converted into kJ/mol before tabulating to make differences in energy more clear.
| LANL2DZ without d orbitals | LANL2DZ with d orbitals | |
|---|---|---|
| Cis isomer energy | -2030457.058 | -2030662.904 |
| Trans isomer energy | -2030449.599 | -2030665.755 |
| Energy difference | -7.45946558 | 2.85019029 |
An interesting result has arisen from the above analysis. When d orbitals are not included in the calculation, the result is that the cis isomer is more stable by 7.459 kJ/mol. However, when d orbitals on phosphorus are taken into account, the calculation predicts that the trans isomer is more stable by 2.850 kJ/mol and the literature does indeed agree that the trans isomer is the most thermodynamically stable. This highlights the importance of using calculations that model the situation as closely as possible, otherwise the wrong result might be obtained.
We can rationalise this preference for trans isomerism by thinking about the π acceptor ability of the PMe3 ligands. They are able to pull electron density away from ligands trans to themselves. For the case of the cis isomer, there are carbonyl ligands trans to PMe3 which are not as good π acceptors, so these carbonyls are rendered more labile to dissociative substitution with other PMe3 ligands in the reaction mixture. The result is isomersation to the trans complex, where the two PMe3 are now trans to each other (as are all the carbonyl ligands) so there is no net induction of polarity in the complex. This is the origin of the trans effect in transition metal chemistry.
With the trans effect in mind, we can use this to promote either cis or trans isomerism by carefully choosing the ligands. If instead of PMe3, we chose ligands that have poor π accepting ability, we should predict that the cis isomer might predominate. We can test this by modelling Mo(CO)4(piperidine)2 (with the same method and basis set) and comparing the relative cis and trans energies with Mo(CO)4(PMe3)2.
cis - Mo(CO)4(piperidine)2
pip cis 2qpzm1029 |
trans - Mo(CO)4(piperidine)2
pip trans 2qpzm1029 |
| Mo(CO)4(piperidine)2 | |
|---|---|
| Cis isomer energy | -2658753.254 |
| Trans isomer energy | -2658714.269 |
| Energy difference | -38.985 kJ/mol |
With the piperidine ligand, the cis structure is now the more stable by a fair margin, owing to the absence of π accepting ability and hence weak trans effect of the nitrogen in piperidine. We have therefore demonstrated how the use of different ligands can be used to control the preference for cis or trans isomerism.
Following the Inversion Process of Ammonia
Geometry optimisations
Computational calculations can allow us to investigate certain interesting processes and one of these is the inversion of ammonia. By comparing the properties (such as energies and vibrational frequencies) of ammonia at different stages of the inversion, we can gain valuable insight into this process.
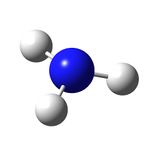
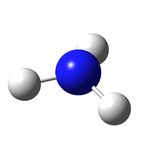
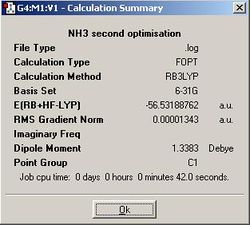
Firstly, the geometries of 3 different point groups of ammonia were optmised using B3LYP/6-31G. Ammonia is usually C3v. A C1 structure can be created by manually increasing the length of one of the N - H bonds in Gaussview. D3h is also selected because it is the symmetry of ammonia at the mid-point of its inversion so we are essentially looking at its transition state structure.
| D3h | C3v | C1 | |
|---|---|---|---|
| Optimised structure |  |
 |
 |
| Summary | 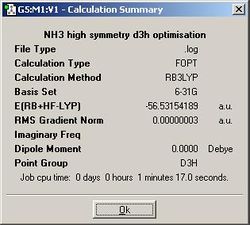 |
 |
 |
| N - H bond length (angstroms) | 1.00037 | 1.00591 | 1.00595 (x2), 1.00594 |
| H - N - H bond angle (degrees) | 120.000 | 116.251 | 116.163, 116.162, 116.158 |
In order to obtain correct results for the C1 structure, it had to be specified in the Gaussian input file that symmetry breaking was allowed. If this is not specified, then Gaussian restricts the calculation to the point group of the molecule.
Firstly we can see that the bond angles in the C3v is significantly off the expected pyramidal angle of approximately 107 degrees. We will try and improve on this later with a higher level calculation.
From the summary files, we can see that the D3h optimisation was the quickest, then C3v, then C1. This is because the high symmetry D3h restricts the calculation to fewer possible geometries, whereas once more geometries can be tested outside of D3h symmetry the calculation takes longer while the computer attempets to find a lower energy in the to the C3v subgroup. Similarly, the C1 subgroup takes even longer as even more, potentially lower energy geometries become accessible to the computer. This shows that calculation time can be shortened by assigining higher symmetry to a molecule if we already know its point group because Gaussian will not deviate from this point group unless explicitly allowed to.
Looking at the summary files further, we can see that the the C1 ammonia is indeed the lowest in energy. C3v ammonia is slightly higher in energy by 0.00452 kJ/mol, but this is so small that it is insignificant. More significant is the difference of 0.903 kJ/mol between the highest in energy D3h ammonia and C3v, for this is the energy barrier for inversion. Seeing as the room temperature energy, RT, is equal to 2.478 kJ/mol, this calculation predicts that there is more than enough energy to allow for rapid inversion of ammonia at room temperature.
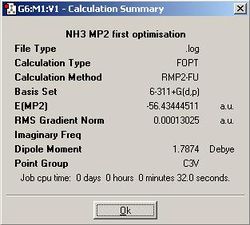
The incorrect bonding angle of C3v ammonia suggests that the calculation was not perfectly accurate. In order to see if we can improve on the bonding angle and additionally get a more accurate estimate of the energy barrier for the inversion of ammonia, the same calculations will be run for D3h and C3v symmetries using the more accurate MP2 method and 6-311+G(d,p) basis set.
Screenshots of the molecules are not shown because they look exactly the same as the previous ones to the human eye.
| D3h | C3v | |
|---|---|---|
| Summary |  |
 |
| N - H bond length (angstroms) | 0.99807 | 1.01287 |
| H - N - H bond angle (degrees) | 120.000 | 107.453 |
The bonding angle is now much closer to the expected 107 degree angle for a pyramidal molecule. In addition the N - H bond distance has decreased slightly. This is likely down to the fact that MP2 deals with electron correlation effects considerably better than the B3LYP method.
If we now find the difference in energy between the two structures, it is found to be 20.468 kJ/mol. This is very different from the value of 0.903 kJ/mol found using B3LYP/6-31G. It is in fact much closer to the experimental value[4] of 24.3 kJ/mol and quite significantly above RT (2.478 kJ/mol). The implication of this is that the more advanced MP2/6-311+G(d,p) has predicted the NH3 inversion does not readily occur at room temperature. However, we know that this process does in fact occur at room temperature. The reason for this is probably quantum mechanical tunelling which allows a system to go 'through' an energy barrier rather than having to go 'over' it and unlike the classic process, quantum tunelling is not temperature dependant. We will not go into great detail on quantum tunneling due due to time constraints for this experiment, but it is interesting that we have managed to demonstrate that such a process must be at work.
Another interesting thing we can do is to monitor the inversion process with a scan of an ammonia molecule moving through several different geometries in going from D3h to C3v. This cannot be done with a graphical interface such as Gaussview so the required file was downloaded from the course notes.
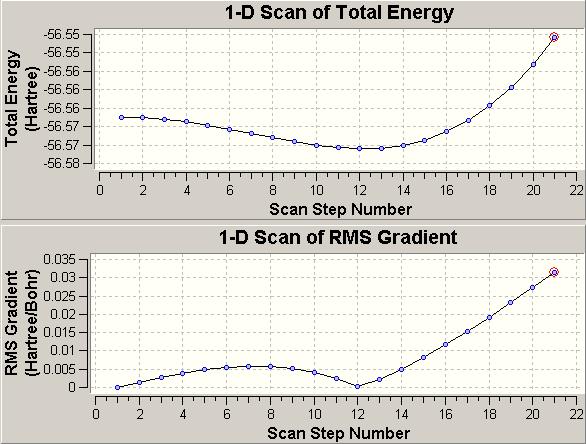
We can see that the energy originally started at a maxium at scan step number 1 with a gradient of zero (the D3h structure) and eventually reached a minimum at scan step number 12, where the gradient is once again zero (the C3v structure).
If we look at the N - H bond length at step number 1, it is 0.99867 angstroms and the bond angle is 120.000 degrees. At step number 12 the N - H bond length is 1.01525 angstroms and the bond angle is 106.828 degrees. These values are very close (exact for the D3h bond angle) to those obtained from the MP2/6-311+G(d,p) calculation earlier, demonstrating the value of this technique.
Vibrational Analysis
We can also run a vibrational analysis an both D3h and C3v ammonia in a very similar way as for BH3 earlier in this experiment.
D3h vibrations:
| Vibration number | Frequency (cm-1) | Intensity | Graphic | (D3h) Symmetry |
|---|---|---|---|---|
| 1 | -318.051 | 849.113 |  |
A"2 |
| 2 | 1640.59 | 55.9828 | 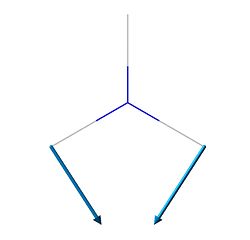 |
E' |
| 3 | 1640.59 | 55.9805 | 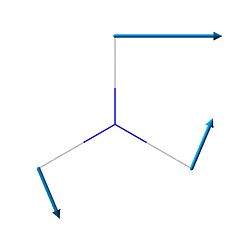 |
E' |
| 4 | 3635.71 | 0 |  |
A'1 |
| 5 | 3854.27 | 19.5951 | 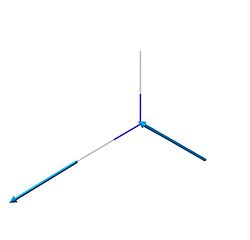 |
E' |
| 6 | 3854.27 | 19.5963 |  |
E' |
It can be seen that the vibrations are very similar to that of BH3 in both their form and their symmetry. Some of the exact frequencies are different, the most significant one being the negative frequency at -318.051 cm-1. This single negative frequency is characteristic of a transition state structure as the computer has found a negative second derivative in the potential energy curve, indicating a maximum energy (transition state) point. This vibration is also significant because if we look at the form of the vibration, it follows the path of inversion by constantly flipping with an umbrella-like motion through the planar D3h structure.
The D3h IR spectrum:
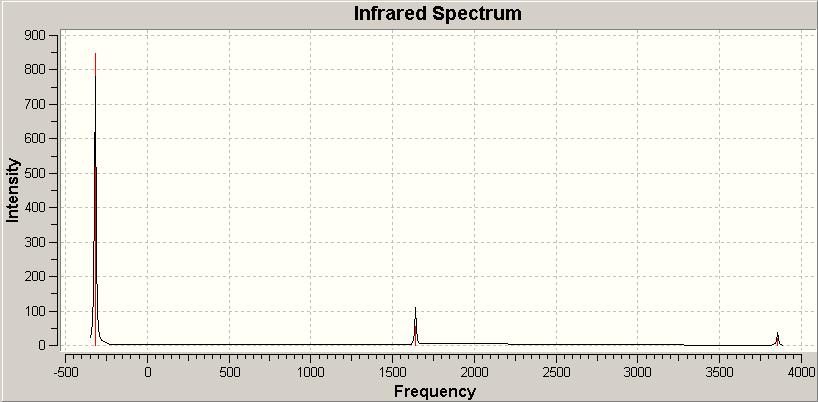
The IR spectrum also clearly shows the negative frequency, which is easily the most intense vibration.
We can now look at the vibrational frequencies of the C3v structure, for which there exists literature values which we can compare our frequencies to.
C3v vibrations:
| Vibration number | Frequency (cm-1) | Literature Frequency (cm-1)[5] | Intensity | Graphic | (D3h) Symmetry |
|---|---|---|---|---|---|
| 1 | 452.302 | 968 | 599.472 | 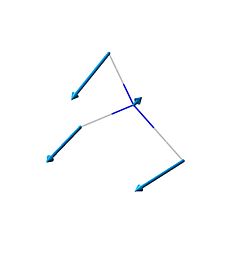 |
A1 |
| 2 | 1680.47 | 1626 | 41.7256 | 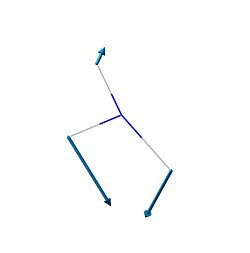 |
E' |
| 3 | 1680.47 | 1626 | 41.7245 | 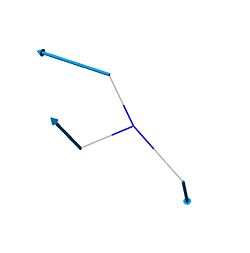 |
E' |
| 4 | 3575.43 | 3337 | 0 |  |
A1 |
| 5 | 3775.76 | 3444 | 7.0892 |  |
E' |
| 6 | 3775.76 | 3444 | 7.0884 | 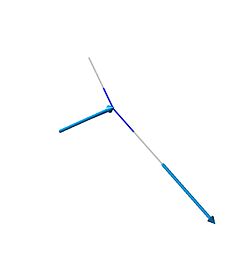 |
E' |
It can be seen that there are very noticeable difference with the literature, espeically with the major difference for vibration 1. The most likely explanation for this is that the calculation of B3LYP/6-31G was simply not a high enough level.
It should also be noted that once again, vibration 1, this time at 452.302 cm-1 is the vibration that follows the path of inversion.
The C3v IR spectrum:
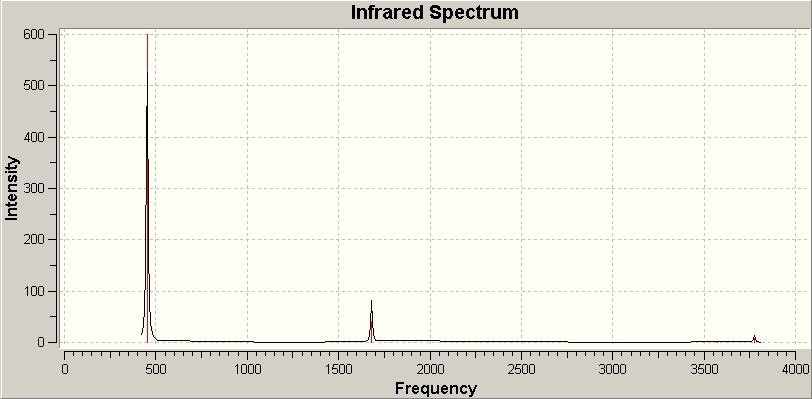
There's not much to add from the IR spectrum apart from the fact it clearly shows that all the vibrational frequencies are positive due to the fact the C3v ammonia is the ground state structure. This corresponds to a minimum in the potential energy curve, meaning a positive second derivative and only positive frequencies.
Mini-project - Investigating sulfur allotropes
An interesting area of study that is within our computational reach is the many allotropes of elemental sulfur. Not only are there many allotropes with different numbers of sulfur atoms, but each allotrope has a several accessible conformations. A selection of common conformations.
To start off with we will attempt to model S8 crown, which is well-known to be the most common allotrope of sulfur. As the molecule is fairly small compared to other examples which could have been chosen, the more accurate MP2 method was used together with the LANL2DZ basis set to apply a pseudo-potential on the core electrons on sulfur.
The structure was first drawn in ChemBio3D (as it is much easier to draw cyclic structures here) and then transferred into Gaussview. The calculation was initially run using the command line:
# opt mp2=full/lanl2dz geom=connectivity pop=full
However, an immediate problem arose. The S - S bond lengths were found to be 2.30365 angstroms which is much larger than the literature value of 2.055 angstroms[6]. The S-S-S angles were 106.945 degrees, which were also in disagreement with the literature value of 108.2 degrees[6], although not quite as dramatically.
At first it was thought that the optimisation was taking a route on the potential energy surface which led to an energy well that was not the deepest so the term "calcfc" was added the keywords so that the command line read:
# opt=calcfc mp2=full/lanl2dz geom=connectivity pop=full
What this does is instructs the computer to calculate all the possible gradients from the starting point of the potential energy surface so that it will pick the one with the steepest slope and hopefully lead to the deepest energy well. The hope was that this would now force the calculation to proceed down a different route on the potential energy surface then before, however, this lead to the exact same geometry.
After a discussion with Dr Hunt it was decided that the reason for this large descrepancy was the theory behind the calculation itself. Although the MP2 method does take into account electron correlation to some level, it does not do this accurately enough to model the S - S bonds correctly. The only solution would be to use a more complex method, but this would come with gread computational cost and would not be feasible, given the time limit for this experiment.
Out of interest, the optimisation was run using a PM6 semi-emperical (MOPAC interface) method and this gave a bond length of 2.035 angstroms which is much better match with the literature. This is hardly surprising, however, as semi-emperical methods rely on experimental results and as S8 crown is a well documented structure, the MOPAC interface is likely to have sufficient experimental data to make a good estimate of the S - S bond length.
When MP2 calculations were attempted on other allotropes, the following average S - S bond lengths were obtained:
S5 = 2.41763 angstroms
S6 = 2.32545 angstroms
S7 = 2.34111 angstroms
These are also far too high so it can be concluded that the methods avaliable to us in this experiment are not suitable to study bond lengths in sulfur allotropes. Instead we shift out attention to the energies of selected allotropes of sulfur, since even if the exact values obtained are incorrect, we can still examine relative stabilities as long as the same method and basis set is used.
The geometries, and hence energies (in Hartrees), of a range of allotropes and conformers will now be calculated using MP2/LANL2DZ.
| S5 | |||
|---|---|---|---|
| |||
| E = -49.58268529 |
| S6 chair | S6 boat | ||||||
|---|---|---|---|---|---|---|---|
|
| ||||||
| E = -59.5121012 | E = -59.49999900 |
| S7 chair | S7 boat | ||||||
|---|---|---|---|---|---|---|---|
|
| ||||||
| E = -69.43315249 | E = -69.42832433 |
| S8 crown (s8 point group) | S8 (C2v point group)) | S8 (Cs point group)) | S8 (C2 point group)) | ||||||||||||
|---|---|---|---|---|---|---|---|---|---|---|---|---|---|---|---|
|
|
|
| ||||||||||||
| E = -79.35903320 | E = -79.24192942 | E = -79.35158417 | E = -79.38085553 |
From the above data, the following can be deduced:
1) The S8 structures are the most stable. Of these, the S8 crown structure is the most stable.
2) Where there are possible chair and boat conformers, the chair conformer is the most stable.
3) Interestingly, for S6, an actual boat conformation exists, in contrast to cyclohexane which can only exist as a twist-boat.
4) An unusual isomer exists for S8 where a linear chain of sulfur atoms loops back on itself, owing to intramolecular interactions across the ends of the chain, presumably to remove electron defficiency.
As we have mentioned electron defficiency, it would be interesting to see what would happen if we removed electrons from an S8 cluster. An optimisation, molecular orbital, and charge distribution calculation was run on an S8 molecule, adding "pop=(full,nbo)" to the keywords to get both the molecular orbital and charge analysis. A 2+ charge was applied by adding the number 2 just above the atom coordinates in the gaussian input file:
%chk=andrew_S8_S8_2+_opt
%mem=650MB
%nproc=1
# opt=calcfc mp2=full/lanl2dz geom=connectivity pop=(full,nbo)
<blank line>
S8 S8 2+ opt
<blank line>
2 1
 S
 S                  1              B1
 S                  2              B2    1              A1
 S                  3              B3    2              A2    1              D1
The results are as follows:
S8 2+ |
A drastic change in geometry from neutral S8 is observable. Averaging at 2.30906 angstroms, the S - S bond lengths are almost the same as in S8 crown, but what is evidently different are the trans-annular S - S distances. In S8 they are 5.23584 angstroms across all directions which is a very large distance. For the doubly charged species, they are much smaller at 4.12226 and 3.71237 angstroms. We can use the charge distribution and MO calculation to rationalise this change in geometry.
| S8 crown | S82+ | |
|---|---|---|
| Charge distribution | 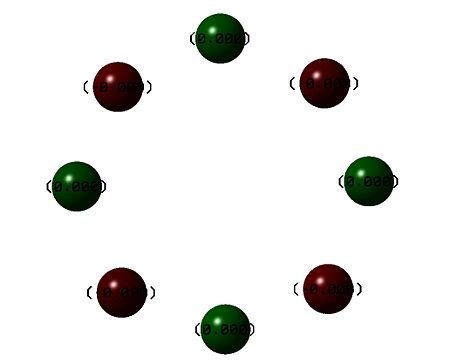 |
 |
| Molecular surface (HOMO) | 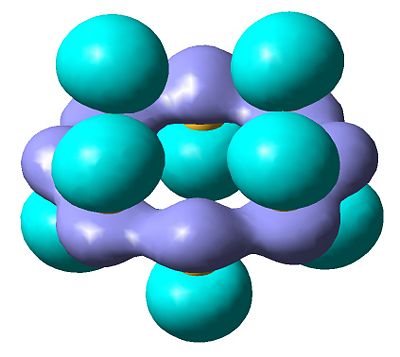 |
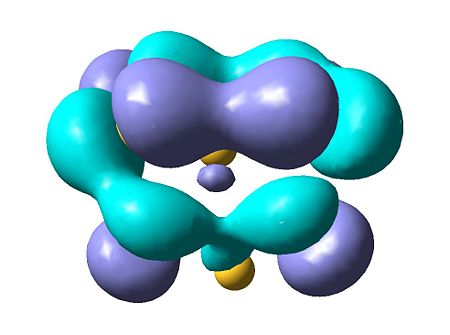 |
The results of the charge distrubution show the electron defficiency to be concentrated mainly on two of the sulfur atoms. If we also look at the HOMO of the cationic species, we can see σ type orbital has formed accross the ring, most likely in order to releive the electron defficiency. This orbital interaction holds the two 'bonded' sulphur atoms more tightly together, leading to the altered geometry we observe here.
Comparing to neutral S8, there is no net charge and therefore no polarisation so we do not observe any transannular bonding interactions which might interfere with the S8 symmetry.
It would have been interesting to remove further electrons to form an S84+ species or to add different atoms to the ring, such as nitrogen, and see what effect these have on the stucture but time has unfortunately run out. However, through this simple mini-project we have demonstrated a limitation of the computational techniques used in this experiment and the need to use higher level calculations to model certain systems accurately. In addition we have shown how charge and MO analysis can be used effecticely to lead to logical rationalisations for noticeable changes in structure.
Conclusion
This experiment has shown how computational methods are able to model real molecules and actually produce results very similar to those obtained experimentally. The experiment has also shown areas where the calculations fail and where higher level calculations would be required to obtain a useful result but despite this, computational chemistry has proven to be an invaluable tool in rationalising geometry and reactivity for real systems.
Note to marker: similarly with experiment 1, for some reason the jobs on the SCAN webpage would not publish but simply gave an error stating "Error - You cannot publish this job" despite the fact that the calculations themselves were successful. This is shown by the screenshot below.

