Rep:Mod:2ir208
Computational analysis of molecules belonging to the D3h point group
Computational modelling of BH3
Geometry and Bonding in borane, BH3, is analysed via computational modelling methods including an initial geometrical optimisation, a molecular orbital analysis and a frequency analysis.
Geometrical Optimisation of BH3
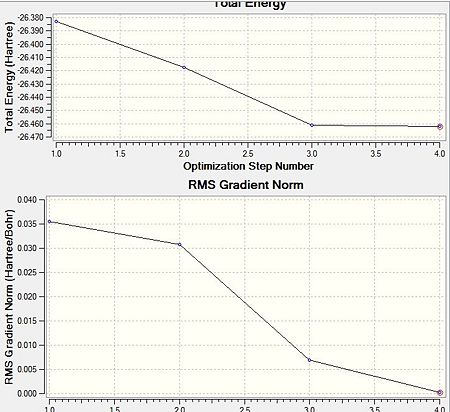
Geometrical optimisation is the pivotal initial step to the successful study molecular properties via computational techniques. Gaussian geometrical optimisation is a quantum mechanical method. The Schroedinger equation is solved for the electronic density and the energy assuming a given position of the nuclei in a first step (SCF part), and for the position of the nuclei in a second step(OPT part). The latter step involves repositioning of the nuclei to find the lowest energy geometry. BH3 is optimised using a RB3LYP method and 3-21G basis set whereby RB3LYP refers to the approximations made whilst solving the Schroedinger equation and 3-21G to a very low accuracy but quick basis set. The optimisation is performed on a trigonal planar BH3 molecule with initial 1.5 Angstrongs B-H bond length. The results of the optimisation are presented in the table below and the Gaussian output file is linked here File:BH3 MOLECULE 1ST OPTIMISQTION.LOG
| Opt R RB3LYP/ 3-21G | |
|---|---|
|
E(RB3LYP) /a.u.±0.0038a.u. |
-26.4623 |
|
E(RB3LYP) / kJmol-1±10 kJmol-1 |
-69477 |
|
RMS Gradient Norm /a.u. |
0.00021 |
|
R (B-H) / Angstrongs ±0.01 |
1.19 |
|
θ (H-B-H) ̊±0.1 ̊ |
120.0 |
 |
 |
Molecular Orbital analysis
Molecular Orbital Analysis

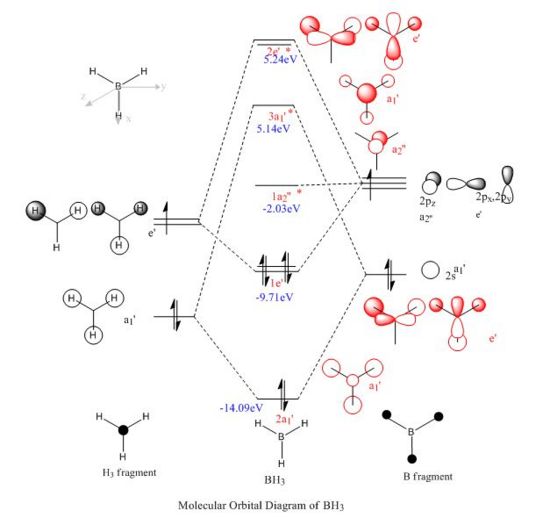
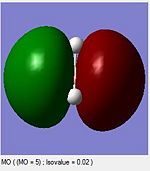
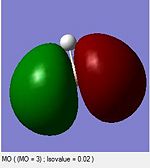
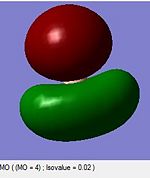
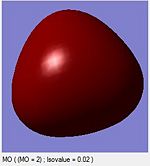
A computational molecular orbital and natural bond orbital analysis is performed on the previously optimised molecule.The output file is linked hereDOI:10042/to-6589 . BH3 is trigonal planar and belongs to the Dh3 point group its symmetry elements are depicted in the attached figure, where the axial system for the following molecular orbital diagram is also defined. A molecular orbital diagram for BH3 is constructed using a qualitative linear combination of atomic orbitals method (LCAO) of an H3 fragment and a boron fragment (The first molecular orbital corresponding to the 1S B atomic orbital is not shown on the molecular orbital diagram)
 |
 |
 |
 |
 |
 |
 |
The highest occupied molecular orbital (HOMO) is is a degenerate e’ MO whereas the lowest unoccupied molecular orbital (LUMO) is a non bonding pz orbital on the B atom. The LUMO is relatively low in energy since it is the non bonding pz orbital of an electropositive element rather than an antibonding MO. The low energy of the LUMO dictates the reactivity of BH3 as a lewis acid. BH3’s propensity to accept electrons form species with higher energy HOMOs (bases) is due to the low energy of the LUMO. Furthermore, donations into the LUMO have no effect on the overall bonding in the molecule as is non bonding with respect to the H3 fragment.
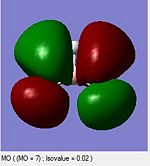
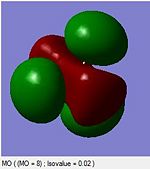
Overall the LCAO and computed MO’s are similar regarding all aspects of shape, phases and symmetry. Nonetheless the molecular orbital diagram is solely a schematic representation of the information from computationally solving the Schroedinger equation. Mathematically a LCAO is given by the general formula Ψ Γ=N( c1 Ψ 1 +c2 Ψ 2...cn Ψ n)= NΣ ci Ψ i whereby Γ corresponds to the symmetry label for the MO, N to the normalisation criteria, the coefficients c to the magnitude of the of the contribution of each atomic orbital, and i to an index running over all contributing AOs forming the basis set. On a qualitative molecular orbital diagram the relative contribution of each AO is emphasized by depicting the individual AO components rather than combining them. This is therefore willingly different from real molecular orbital, which are delocalised. Ultimately, molecular orbitals are regions of expected electron density, and despite being overly pictorial molecular orbital diagrams allow such predictions with remarkable accuracy. Such qualitative approach to solving the Schroedinger equations is a simple and useful method to predict the location of electron density regions ie. bonds as well as their relative energies, from which reactivity may be rationalised.
Natural Bond Orbital Analysis
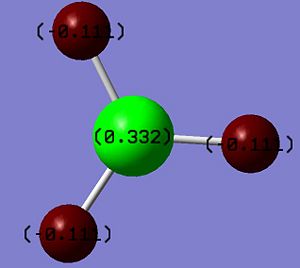
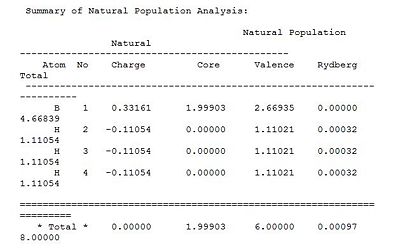
The Natural bond orbital analysis provides a much more theoretical description of bonding namely the "organic " picture of 2e-2c bonding and spn hybridisation. The main features of the analysis are shown as from the Gaussian output file. The involved calculation of atomic charges generates a Lewis acidic/positive B centre surrounded by negative Hydrogen atoms. This is represented both qualitatively by the colours of the atoms and the numerical values of the atomic charges (0.3312 and -0.1104 for Band H respectively). In the Gaussian output file this section is titled ‘Summary of Natural Population Analysis’.
 |
 |
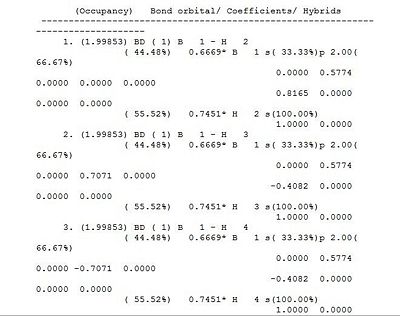
The section titled "Bond orbital/ Coefficients/ Hybrids” provides a description of Bonding in the molecule, whereby the electron density of the whole molecule divided into atomic like orbitals used to form 2e-2c bonds. In first three bond, namely between B and H, 44.49% of each bond is contributed from the B orbitals which have a hybridisation of 33%s+66%p, while 55.51% of each bond comes from the H orbital which is 100%s. The B atom is therefore forms 3 sp3 hybrid orbitals which each interact with the sAO of one hydrogen atom. Orbital 4 corresponds to the core 1sAO of boron whilst Orbital 5 corresponds to the boron lone pair ( 100%p), which points out of the plane. A summary of the population, occupation and energy of the bonds is provided in the ultimate “Natural Bond Orbitals (Summary)” section.

Vibrational analysis of BH3
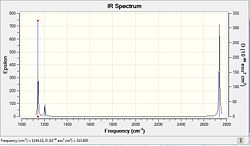
A Frequency analysis is performed on the optimised molecule to investigate the vibrational modes and infrared spectrum of BH3DOI:10042/to-6963 . BH3 has 6 vibrational modes, not all of which are IR active. Only vibrational modes which result in a change in dipole are observed on the IR spectrum, explaining why the IR spectrum does not exhibit 6 peaks. As rationalised in t he table below, the symmetric stretching vibration is fully symmetric ( a1’) and therefore not observed on the spectrum. Furthermore, e’ and e’’ vibrational modes are degenerate such that out of 4 vibrational modes with approximately equal frequency and intensity only 2 peaks are observed on the IR spectrum. Overall then, the IR spectrum exhibits 3 peaks at 1144cm-1, 1204cm-1 and 2737cm-1 corresponding to the a2’’, e’ and e’’ vibrational modes respectively.
Vibration |

The "Low frequencies" are the motions of the center of mass and of much smaller magnitude than the normal vibrational modes. Whilst the largest zero frequency is 1 order of magnitude smaller than the vibrational modes it is not quite as close to zero as ought be in a more accuracy of the basis set used. Experimental data for BH3 vibrational frequencies is not easily obtained since BH3 readily dimerises to B2H6. Kaldor et.al [1] reported peaks at 1125cm-1, 2808cm-1 and 1604cm-1 whilst Kawaguchi and co-workers[2] reported values of 1141cm -1, 2602 cm-1 for the a2’’, e’’ and e’ respectively. The computed IR spectrum, which exhibits 3 peaks at 1144cm-1, 1204cm-1 and 2737cm-1 corresponding to the a2’’, e’ and e’’ vibrational modes respectively is thus in reasonable but not good agreement with literature data. Again this is mainly due to the low accuracy of the method and basis set used.
Modeling of TLBr3
Geometrical optimisation
Geometrical optimisation of quantum mechanically more complex molecules such as TlBr3 for instance requires the use of larger basis set and pseudo potentials. Heavier element atoms with many electrons exhibit relativistic effects, which may not be recovered by the standard Schroedinger equation. Functions, which mode the core electrons of an atom are known as effective core potential or pseudo potential allows to recover some of the afore mentioned effects. The underlying assumption for the use of pseudo potentials is that only valence electrons are involved in bonding interactions.
Consequently, TlBr3 is optimised using RB3LYP method and an option LanL2DZ, which involves both a medium level of accuracy basis (D95V) set for the valence electron and a pseudo potential for the core electrons (Los Alamos Electron core potential). A higher level of theory is used in this optimisation compared to the previous one. The basis set involves more functions, and more specialized ones such as those that diffuse electron density to extend out and away from the molecule or polarization ones. The herein presented calculation further involves a very tight restriction of the geometry to the D3h point group during the optimisation process. The optimisation results are presented below and the Gaussian output file linked here File:TLBR3OPTIMISATION2.LOG.
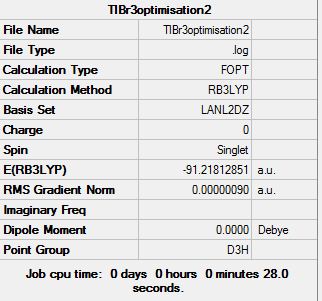
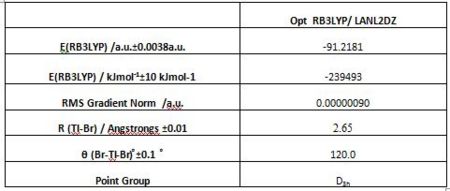
The Tl-Br bond lengths (2.65 Angstrongs) are relatively close to that reported in literature 2.512 [3]but not perfectly matching. Using a medium level of accuracy method basis set means that the result will not be perfectly accurate, and is, as expected, reflected by the result. Optimised molecules as displayed by the Gaussview software do sometimes omit existing bonds. Gaussview is tuned so as to show solely those bonds that are within a certain range defined for an atom pair. As a consequence, when the optimised bond length is greater than aught be according to the Gaussview database, no bond is displayed. This does however not mean that the bond is not real, for bonds are hardly lines joining two atoms as represented by Gaussview, any modelling software, or indeed any conventional pictorial view. In fact “physical chemical bonds” are but a convenient fiction used to depict the regions of “expected high electron density” resulting from the simultaneous attraction of electrons by several nuclei. The optimised molecular geometry and therefore equilibrium bond length ultimately generate, by atomic orbital overlap, the lowest energy electron configuration for molecular orbitals.
Vibrational Analysis of TlBr3
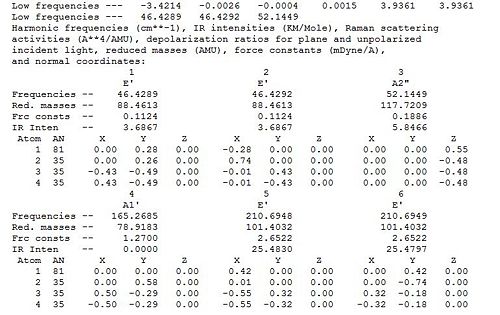
A frequency calculation was subsequently performed on the optimised TlBr3 molecule in order to confirm that the optimised configuration is indeed the lowest energy one and not a transitions state. The optimised geometry is a minimum on the potential energy surface, and therefore obtained from equating the first derivative of the potential energy surface function to zero. Nonetheless, energy maxima (transition states) also have a slope of zero. Furthermore, depending on the starting geometry and accuracy of the optimisation method, a local energy minimum may mistakenly be taken as the overall lowest energy point of the surface. This implies that one must confirm optimum geometry obtained is indeed the lowest energy point of the energy surface and not a transition state or a local minimum. A frequency analysis allows to make sure that the optimised geometry is indeed the critical point of the energy surface and is thus an essential step in computational modelling. A frequency analysis is in essence the second derivative of the potential energy surface, and thus allows to distinguish maxima from minima since the former have positive frequency values and the latter negative ones. Obtaining negative frequencies would mean that the obtained geometry is not the critical lowest energy one, and that an optimisation must be performed again to proceed to further analysis. Since the optimisation and vibrational analysis are the first and second derivative of the potential energy surface respectively, it follows that one must use the same basis set for both calculations. Taking the curvature of the optimisation function in the vibrational analysis would otherwise not provide a consistent analysis. The same basis set must also be used because retaining the same level of accuracy in the calculations is crucial. Results of the frequency analysis are presented below.DOI:10042/to-6963
Vibration |

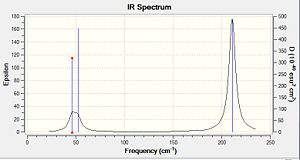
Since TlBr3 belongs to the D3h point group (as BH3) the same vibrational modes are observed as for BH3.The IR spectrum exhibits three peaks since one vibrational mode is totally symmetric and there are two degenerate pairs. Literature values of the a1 stretching frequency and e’ frequency have been reported as 203 cm-1239 cm-1 [4]respectively, which are both about 40cm-1 higher the the values here computed. This suggest that our computation is reasonable but not very accurate due to the computational method and basis set used. Low frequencies are observed at -3.4214, -0.0026, -0.0004, 0.0015, 3.9361 and 3.9361 cm-1 respectively whist the lowest real frequency is seen at 46.3 cm-1. As low frequencies are about an order of magnitude smaller than the real frequency and quite close to zero , it is suggested that the computed optimised geometry is reasonable.
An Organometallic complex: Cis- and Trans-[Mo(CO)4(PCl3)2]
Disubstituted molybdenum tetracarbonyl complexes Mo(CO)4L2 exhibit cis- and trans-stereoisomerism. Geometrical difference results in differing thermodynamic stability and vibrational modes for the two forms. Mo(CO)4PCl3 is used as a model for complex with regards to the es of the general form Mo(CO)4L2 where L=PR3, in order to facilitate computations.
Geometrical Optimisation
Optimised structures of the cis and trans complexes and their relative energy
Mo(CO)4PCl3 was optimised initially using a RB3LYP method, a LANL2MB basis set and a loose convergence criteria, after which the ligand orientation of the optimised geometry was altered to ensure the critical conformational energy minimum is reached in further optimisation steps. The PCl3 orientation adjusted to optimised the dihedral angle with regards to the carbonyl group. In the cis conformer, one Cl atom should point up parallel to the axial bond and the other down, whilst in the trans conformer both PCl3 groups should be eclipsed and one Cl of each group parallel to one Mo-C bond. Ligand orientation is shown in the figure bellow. A second optimisation was then perform using a basis set with a higher level of theory namely , LANL2DZ as well as a much tighter convergence criteria. Nonetheless, as the latter basis set only includes a minimal basis set for the P atom which for instance likes to be hypervalent and use its low lying d-orbitals, a further optimisation was carried out. The final optimisation results are presented below . (transDOI:10042/to-6966 cisDOI:10042/to-6967 )
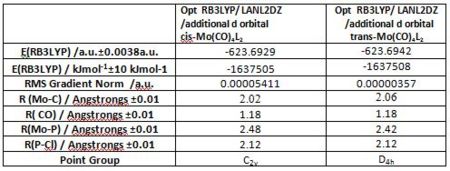
Fundamentally the cis and trans isomers exhibit different symmetry point groups. Furthermore, their Mo-C and Mo-P bonds differ in length. For instance the Mo-P bond is longer in the cis isomer than it is in the trans isomer, whilst the Mo-C bond is longer in the trans isomer than in the cis isomer. Mo-C and Mo-P length have been reported for Mo(CO)4(PPh3)2 to be 2.552[5] Angstrongs and 1.997[6] Angstrongs respectively in literature. This compared quite will with the computed values, taking into consideration that Cl is less bulky than PH3. That the Mo-P bond is longer in the cis isomer may be rationalised considering that it is more sterically hindered.
Relative energies of the complexes
The trans isomer is revealed to be more thermodynamically stable than the cis isomer. The energy difference of the two isomers is nonetheless very small 3kJ/mol and comes within the error of the computational method used. The two isomers are so close in energy because PCl3 is not a particularly bulky ligand. Whils both cis and trans stereochemistries are observed, more unfavourble steric interactions are present in the cis isomeric form. Overall then, and particularly in the presence of bulky ligands, the trans derivative has been shown to be thermodynamically more stable.
Vibrational analysis and infrared spectroscopy
Vibrational analysis
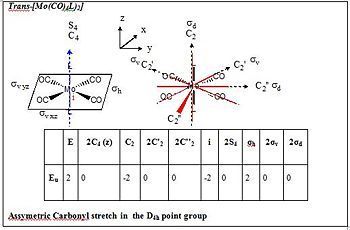
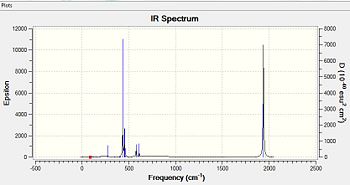
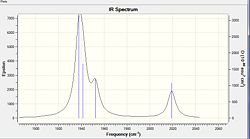
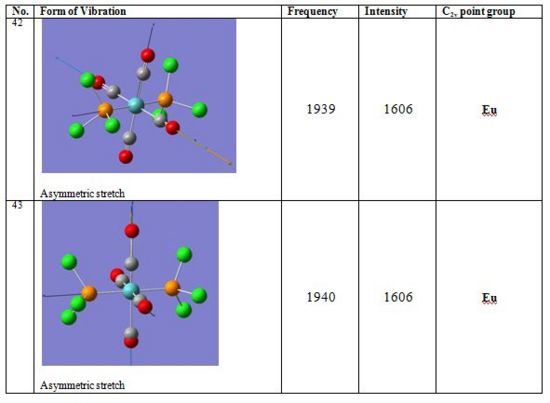
A vibrational analysis is computed for both isomers as the Carbonyl stretching region provides informations about the nature of geometrical isomerism. Cis- and Trans- isomers exhibit different vibrational modes due to their differing symmetry and thus point group. Whilst a Cis complex displays 4 active carbonyl stretching modes having a C2v symmetry, the trans complex of D4h symmetry shows 1 band solely. Only vibrations that result in the rythmical change in the dipole moment of the molecule are observed in the IR spectra. The Trans complex does not show many such vibrations due to its greater symmetry. The results of the frequency analysis for the carbonyl stretching modes as well as the resulting IR spectrum are presented for both isomers .(transDOI:10042/to-6616 cisDOI:10042/to-6632 )
 |
 |
|}{|
Vibration |
|}

|}{|
Vibration |
|}
In the cis complex, symmetric and asymmetric stretches are exhibited for the trans pair of carbonyls and for the cis pair respectively. This explains the presence of 4 bands in the carbonyl stretching region. Considering that in most carbonyl complexes trans pairs of carbonyl groups have stronger force constants than cis pairs, the highest frequency band at 2019cm-1 in cis complex corresponds to the symmetric stretch of A1 (a) symmetry.
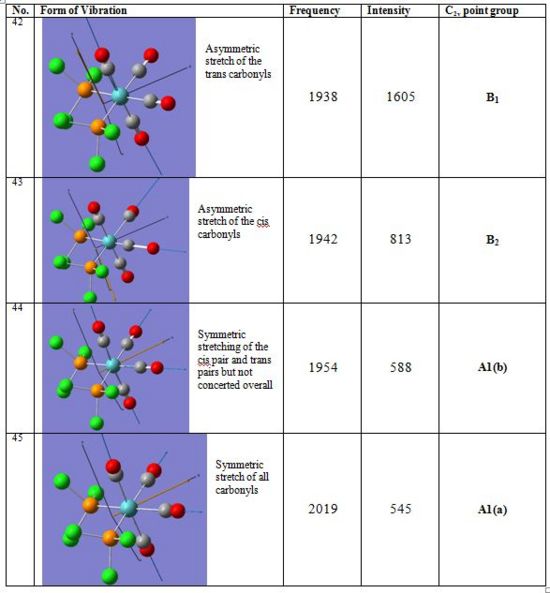
In the trans complex however only one vibration is IR active since all carbonyl groups are related by symmetry. Trans-[Mo(CO)4(PCl3)2] therefore exhibits only one intense band at 1939cm-1 which corresponds to the asymmetric stretching of two trans carbonyl groups and has Eu symmetry. Such asymmetric stretching vibration is found in the Cis-[Mo(CO)4(PCl3)2] isomer at 1938cm-1.
Results for last year’s experiment (5 S Identification of stereochemical isomers of Mo(CO)4L2 by infrared spectroscopy) as well as literature data are presented below. For both complexes the computed IR stretching frequencies for Mo(CO)4(PCl3)2 correspond quite well to those reported in literature for Mo(CO)4(PPh3)2. Overall slightly higher stretching frequencies are computed here due to the P-Cl force constant being higher than P-R one. Further error is due to the medium level accuracy of the method and basis set.

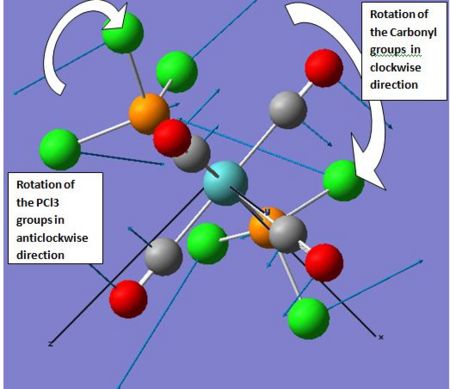
Whist no negative frequencies are exhibited by any of the two isomers, low frequencies are observed in both cases. The latter correspond to near rearrangements of the ligand groups around the molybdenum centre. The first three modes of the cis isomer correspond to rotations of the of the carbonyl and PR3 groups in opposite directions as depicted in the diagram below. Ultimately this suggests cis-trans isomerisation at room temperature and is readily observed for sterically demanding ligands. Such intramolecular Isomerisation mechanism is in fact referred to as “Bailar-twist isomerisation” and is explained below.
Isomerisation
At room temperature, it is observed that the cis form readily isomerises to the trans form, the isomerisation process being dependent on the relative bulkiness of the PR3 group.

In cis-[Mo(CO)4(PPh3)2], isomerisation to the trans isomer is purely dissociative and involves an initial Mo-P bond cleavage such that an intermediate of lower coordination number is produced. According to the ground-state geometry of the five-coordinate intermediate [Mo(CO)4(PPh3)] the remaining phosphine ligand preferentially occupies an equatorial position in the square- pyramidal structure. This is for instance the driving force for the dissociation of phosphineand known as Brown's cis-labilization argument[7]. The phosphine ligand comes in again to occupy the position trans to the first phosphine.
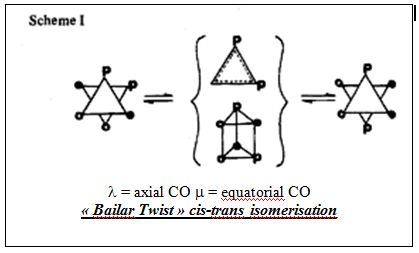
Whilst, the cis-trans isometisation of the molybdenum tetracarbonyl distriphenylphosphine complex occurs via a dissociative process, cis-trans isomerisation hinted by the low frequency ‘vibrational modes’ of the herein presented computation occurs via an intramolecular non dissociative process. In the case of the molybdenum tetracarbonyl distri-n-butyl complex, such isomerisation process has has been established experimentally through a kinetic study of the reaction. A spectrocopic spectroscopic analysis of the isomerisation whereby the initial cis isomer would have one of its axial carbonyl groups stereospecifically labeled 13CO further confirmed this isomerisation process. It would indeed be inferred from IR as well as 13C NMR that no intramolecular carbonyl ligand exchange is observed in advance of formation of the trans isomer. The isomerisation has been described as a ‘non-bond-breaking’ (whether Mo-C or Mo-P) mechanism. This process, known as the “Bailar Twist”[8], has been thought to proceed through a trigonal-prismatic intermediate/transition state and is illustrated. The trigonal- prismatic intermediate is afforded by means of a 60° clockwise rotation of the octahedral faces and does not equilibrate axial and equatorial carbonyl ligands. Such isomerisation is more energetically favourable a mechanism than a dissociative process would be. Further, the activation energy is slightly lower for the latter process than for the the dissociative loss of phosphine ligands in cis-[Mo(CO)4(PPh3)2].
The dissociative loss of the phosphine ligand strongly correlates to the steric requirement of the phosphine ligand as determined by its cone angle[9](measure of the size of a ligand and is defined as the solid angle formed with the metal at the vertex and the hydrogen atoms at the perimeter of the cone). Whereas PPh3 has a 145° cone angle, in PnBu3 the cone angle is 132°. Due to unfavourable electrostatic interactions and sterical hindance bulky ligands such as PPh3 may be readily lost whilst small ligands do not undergo dissociative loss with such ease. All in all, Mo-P bond cleavage is a more favorable process for stereochemical re-arrangements than transformation to a trigonal-prismatic intermediate or transition state where steric interactions are greatly enhanced.
Mini Project:A structural investigation of Heterocyclic Silicon and Germanium derivatives.
Hexamethylcyclotrisiloxane and hexamethylcyclotrisilthiane as well as their parent germanium compounds are investigated here for their structural properties. A geometrical optimisation is initially performed on all four compounds to determine their structural parameters. A natural Bond orbital analysis is then performed so as to compare bonding in the oxide and sulphide derivative. Finally a frequency analysis is performed to confirm the structural assignments.
Structural Investigation
Geometrical optimisation results
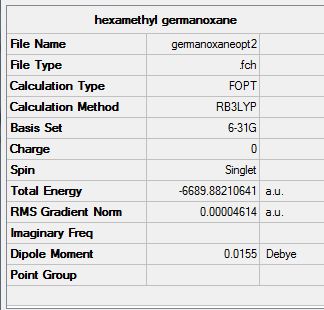
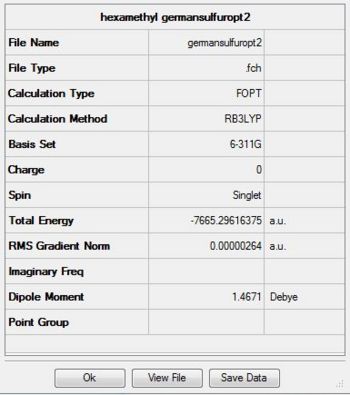
Hexamethylcyclotrisiloxane and hexamethylcyclotrisilthiane and their parent germanium derivative are optimised via a RB3LYP method using initially 3-21G basis set and in a second step using a 6-311G basis set. All starting configurations were planar with the methyl groups eclipsed. The initial bond lengths were approximated using literature reported values. The optimisation results for all four structures are presented below. (Si-ODOI:10042/to-7097 Si-SDOI:10042/to-7098 Ge-ODOI:10042/to-7095 Ge-SDOI:10042/to-7096 )
 |
 |
 |
 |
|
|
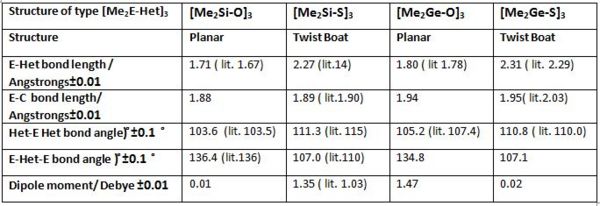
Overall, the calculated data corresponds quite well with literature reported values for the four compounds. This suggests that the computations are reasonable and further analysis may be performed on the obtained structures.
Comparing the oxide and sulfide derivatives of silicon and germanium respectively, it is observed that bonds are shorter for silicon compounds than for germanium ones. This is easily rationalised considering than elements lower down the group have more diffuse orbitals and there orbital overlap is not as strongs as for earlier elements. More crucially however, the results show that whilst hexamethylcyclotrisiloxane and hexamethylcyclotrigermanoxane are planar hexamethylcyclotrisilthiane and hexamethylcyclotrigermanthiane deviate from planarity and exhibit twist boat structures. Deviation from linearity for cyclic sulphide compounds and other heterocyclic silicon compounds has indeed been reported in literature.(Si-O[10], Ge-O [11], Si-S [12], Ge-S[13] ) Nonetheless Masatoki Yokoi et. al. [14] reported that hexamethylcyclotrisilthiane would perhaps show a greater propensity to be in its chair conformation at the hand of electron fraction studies. Whilst confirming teh deviation from linearity, the Dipole moment computed here(1.35) is also significantly larger than the value extimated(1.03)by Y. Kurita et. al.[15], which may suggest hat the computed structure is not in fact optimal. [16] Since the twist boat is usually considered as an intermediate between boat and chair conformations a further optimisation was attempted on the sulphide derivatives starting form a near chair conformer. The optimisation was however unsuccessful in both cases and twist boats were obtained again. Crystal structures of (R2E-Het)3 are in fact only known for few cyclotrisilthianes with large substituents such as trans-(PhMeSi-S)3 and tin chalcogenides (Me2SnS)3, and do adopt unusual twist-boat conformer due to the steric demand of the substituents and the tin atoms. [17]
This suggests that relative steric hindrance induced by the starting orientation of the substituents at Si and Ge in the herein presented computation is responsible for the obtained twist boat optimised structure. A more staggered orientation of the methyl substituents may perhaps have yielded the desired chair conformation.
Natural bond orbital analysis
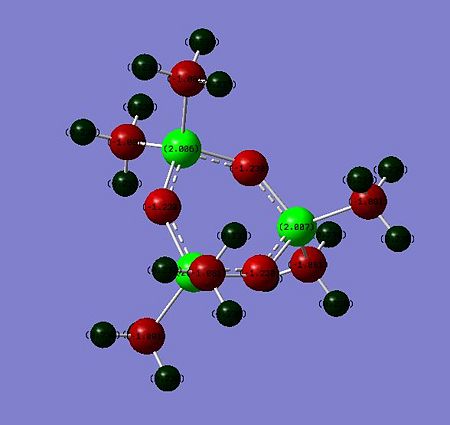
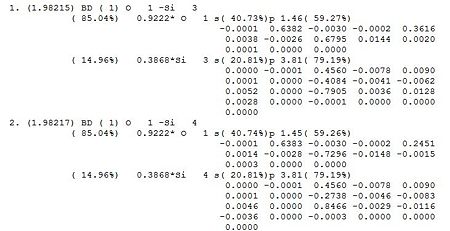
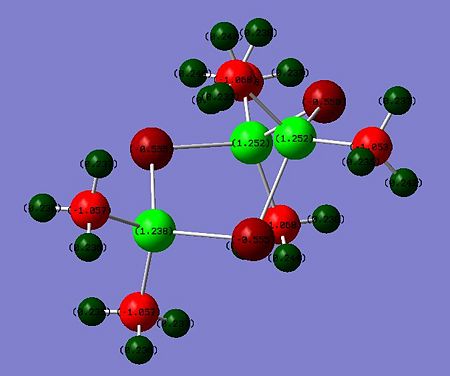
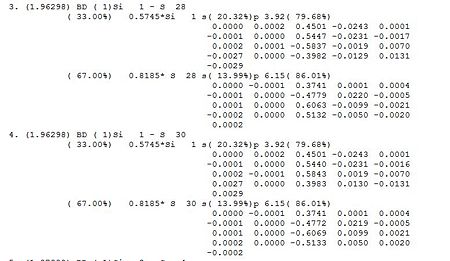
The natural Bond analysis (Si-ODOI:10042/to-7093 Si-SDOI:10042/to-7094 )of hexamethyltrisiloxane and hexamethyltrisilthiane show fundamentally that in the former case the heteroatom contributes more the ring bonding than in the latter case. When considering the first few natural bond orbitals, one may see that whereas a Sulfur atom contributes on average 67% to a Si-S bond an Oxygen atom contributes in average 85% to an Si-O bond. This is allegedly because of the oxygen contributing orbitals are lower in energy than the silicon. The hybridization pattern of the contributing heteroatom orbitals differs significantly. The Oxygen orbitals contributing to the ring bonding bonding exhibit a much greater s character than in the sulphur case. O is closer to sp2 hybridisation whereas S is closer to sp3 hybridisation. This explains why Gaussview depicted a planar semi-aromatic structure for hexamethyltrisiloxane. For hexamethyltrisilthiane, a chair conformer likening that of cyclehexane is preferred due to the near sp3 hybridisation at Sulfur. The deviation from planarity for cyclic silthiane and germanothiane derivatives may thus be explained at the hand of an NBO analysis. A Molecular orbital analysis was conducted for the siloxane derivative, the latter was nonetheless not conducive to significant interpretations.
 |
 |
 |
 |
Vibrational analysis of Cyclic hexamethyloxane and thiane derivatives of Silicon and
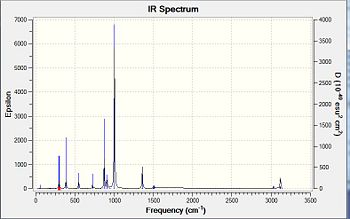
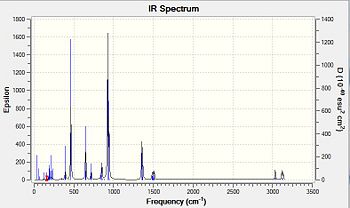
A vibrational analysis was performed on all compounds. Nonetheless considering the differing structures obtained in the preceding optimisation steps, cyclic oxane derivatives and the parent thianes derivatives could not be compared with each other. The Infrared spectra and comparative results tables are presented below.Ge-ODOI:10042/to-7091 Si-ODOI:10042/to-7092 Ge-SDOI:10042/to-7089 Si-SDOI:10042/to-7089

Vibration |
Vibration |
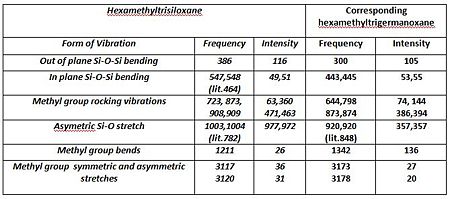
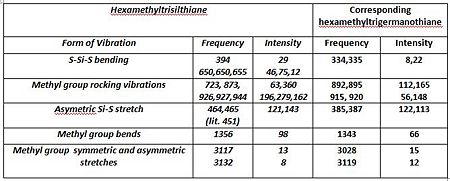
The main interpretation is that Germanium derivatives exhibit lower stretching and bending frequencies than the corresponding silicone compounds, due to the lower bond order of Ge—S and Ge-O bonds. Overall one may also observe that these absorptions occur at lower frequencies in the thiane derivatives than in the oxane ones. As afore mentioned, greater obital diffusivity going down the group rationalises this observation . One may perhaps have expected germanothiane Ge-S absorptions to be less shifted down than germanoxane ones, due to a better orbital a size and energy match of elements in the same period. This is however not observed here. The computed values correspond quite well to those reported in literature( Ge-S[18], Si-S [19], Si-O [20] but not perfectly due to the relative accuracy of the basis set and computational method used, particularly in the optimisation steps. Negative frequencies have not been observed cyclothiane derivatives, as one would expected for a a high energy intermediate, which is the usual description of twist boat conformers. The may however, be a luck factor rather than a perfect optimisation. Regarding the hexamethyl germanoxane compounds a few negative frequencies were obtained suggesting the the optimisation of the compound could be further improved.
References
- ↑ A. Kaldor and R. F. Porter, J. Am. Chem. Soc., 93 (1971) 2140 DOI:10.1021/ja00738a008
- ↑ K. Kawaguchi, J. Chem. Phys., 96 (1992) 3411DOI:10.1063/1.461942
- ↑ A.M. Glaser, J. and J ohansson, G. Caminiti, Acta Chem. Scand. A 35 (1981)125 639.}
- ↑ Spectrochimica Acta A,41,10,1985 1235} DOI:10.1016/0584-8539(85)80136-7
- ↑ Cortes-Figueroa, M. S. Leon-Velaguez, J. Ramos, J. P. Jasinki, D. A. Keene J. D. Zubkowski, E. J. Valente, Acta Cryst. C56 (2000) 1435.}
- ↑ M. A. Ardon, P. D. Hayes, G. Hogarth, J. Chem. Edu. 79 (2002) 1249}
- ↑ D. J. Darensbourg, R. L. Kemp, Inorg. Chem. 1978, 17, 2680DOI:10.1021/ic50187a062
- ↑ D. J. Darensbourg, Inorganic Chemistry, 1979, 18, 142680DOI:10.1021/ic50191a003
- ↑ D. J. Darensbourg, Inorganic Chemistry, 1979, 18, 142680DOI:10.1021/ic50191a003
- ↑ J.M. Nedelec, L.L. Hench Journal of Non-Crystalline Solids 255 (1999) 163 }
- ↑ Masato Nanjo, Takaomi Sasage and Kunio Mochida,Journal of Organometallic Chemistry 667, 1-2, 3 2003, 135DOI:10.1016/S0022-328X(02)02157-5
- ↑ Masatoki Yokoi, Terunosuke Nomura, Kazuo Yamasaki J. Am. Chem. Soc., 1955, 77 (17), pp 4484DOI:10.1021/ja01622a011
- ↑ J. BelBruno and Andrei BurninPhys. Chem. Chem. Phys., 2010, 12, 8557DOI:10.1039/C003704D
- ↑ Masatoki Yokoi, Terunosuke Nomura, Kazuo Yamasaki J. Am. Chem. Soc., 1955, 77 (17), pp 4484DOI:10.1021/ja01622a011
- ↑ Y. Kurita, LI. Kondo, Bull. Chem. SOC. Japan, 27, 161,1954}
- ↑ K. Kawaguchi, J. Chem. Phys., 96 (1992) 3411DOI:10.1039/C003704D
- ↑ U. Herzog, G. Rheinwald, Journal of Organometallic Chemistry 627, 1, 2001, 23DOI:10.1016/S0022-328X(01)00707-0
- ↑ M. P. Brown1, R. Okawara1 and E. G. Rochow, Spectrochimica Acta 16, 5, 1960, 595DOI:10.1016/0371-1951(60)80019-7
- ↑ L.E. Gusel'nikov, V.V. Volkova, V.G. Avakyan, N.S. Nametkin, M.G. Voronkov, S.V. Kirpichenkoand E.N. Suslova ,Journal of Organometallic Chemistry 254, 2, 1983, 173DOI:[https://doi.org/10.1016/S0022-328X(00)99104-6 10.1016/S0022-328X(00)99104-6 ]
- ↑ L. L. Hench and J. K. West, Annu. Rev. Mater. Sci. 1995,25, 37}
