Rep:Mod:2cpc112
Transition States and Reactivity
This computational exercise concentrates on determining the optimised transition state structures for a number of chemical reactions. A Transition State refers to the highest energy point on the Potential Energy Surface (PES) between the reactants and products of a particular reaction i.e. it is the highest energy point on the reaction pathway. If the transition state structure may determined it allows access to a wide range of information relating to the reaction, therefore the study of transition states and potential energy surfaces by computational methods is of great importance. Computational analysis gives access to both important quantitative and qualitative data, for example the activation energy of a reaction (very important to reaction kinetics) and the mechanism by which it proceeds. In order to highlight the advantages of computational analysis the outputs of the calculations shall be compared to both the literature and qualitative means of analysis throughout this report, particularly molecular orbital theory and its variants. Although the quantitative outputs are generally of relatively high accuracy they are somewhat limited by the approximations which must be made to apply the method. Therefore, there is often significant disparity between the output data obtained via alternative computational methods and they are not a reliable metric with which to assess the accuracy of data obtained by experimental methods. Despite this, the qualitative conclusions which may be made from the data are still of great relevance and allow us to elucidate reaction mechanisms and thermodynamic properties in a manner not previously possible. This computational exercise specifically aims to elucidate mechanistic information on the Cope Rearrangment of 1,5-Hexadiene and various Diels-Alder cycloadditions via the Gaussian programme. There are three primary computational techniques which will be applied during this analysis: Basis Sets, Independent Particles Model and the Electronic Structure method.
Exact analytical solutions to the equations which characterise two-body systems of large molecules are simply not possible to obtain even by modern computational methods, therefore a series of approximations and simplifications must be made [1] A molecule in this case might be considered as an ensemble of its constituent particles which will therefore be characterised by a dynamical equation. However, great difficulty arises in the separation of variables required to solve this equation analytically. The variables may however be approximately separated by considering the physical characeristics of the molecule, allowing computational methods to be applied in order to determine an approximate solution of the dynamical equation [1] . An obvious example of this is the Born-Oppenheimer approximation which states that nuclear motion is independent of the electronic motion (Are they really independent? One must be careful in making such statements. Why do 2 nuclei come close together to form a diatomic molecule? Why do you use the expression "potential energy surface for the nuclei" below? João (talk) 12:58, 21 April 2015 (BST)). By defining the electronic wavefunction with respect to nuclear position, the PES of the nuclei may be determined allowing us to solve for nuclear position [2]. However, with regards to transition states it proves very difficult to identify their structure utilisng either a molecular mechanics or force-field approach due to the nature of reactions in which bonds are formed/broken as they may not be characterised by a single force-field energy function. Therefore, transition states are best studied utilising electronic structure methods, in particular independent particle methods as described below. As a result in this computational exercise the Cope Rearrangement of 1,5-Hexadiene and various Diels-Alder cycloadditions are investigated by application of electronic structure calculations.
The key point to emphasise from the independent particle model in this case is that an individual electron is assumed to be unaffected (independent) by the movement of other electrons. Instead, electron-electron interactions are considered as an average property encompassing the entire molecular system [1]. This has previously proved to be a relatively accurate and time-efficient technique. The approach is commonly referred to as the Hartree-Fock theory and many electronic structure methods (as defined above) are based on this assumption. Perhaps as a result of its widespread applications there have been a variety of electronic structure methods developed using Hartree-Fock theory, however, they can be split into two broad categories: semi-empirical and ab initio. Semi-Empirical methods supplement the computational method by introducing parameters from experimental data in order to reduce the computation power required. Ab initio is a reference to the derivation from quantum mechanical principles in these methods which utilise an increased number of orbital determinants in order to optimise the determined structure[1] (The Hartree-Fock method (and others) is a single determinant method and is an ab initio method. What distinguishes ab initio ans semi-empirical methods, is that in the former case one calculates all quantities from first principles, for example orbital overlap integrals are calculated numerically, whereas in the later case one uses some quantities are parametrized with values chosen to give good results. João (talk) 12:58, 21 April 2015 (BST)) . Examples of both generic approaches will be illustrated below.
It is possible to utilise a relatively wide range of basis sets on the Gaussian programme, however, that which is applied will depend on the required accuracy of the approximated molecular orbitals, the basis function necessary to complete this task and the extent of the basis set in question. The accuracy of the approximated molecular orbital calculations is dependent on number of functions which comprise the initial basis set, however, it is necessary to also consider the computational power required to complete the calculations as this rises with linear dependence to the fourth power of basis set size [1] As computational power equates to increased cost it is often necessary to compromise between the accuracy of calculations and the computational power/cost required. Despite this, there are other ways in which the accuracy of calculations may be increased without the need to increase the size of the basis set, for example as sensible choice of basis function to represent the molecular orbitals may have a large impact on accuracy. Primarily, there are just two categories of basis function applied to electronic structure calculations: Slater basis functions (STOs) and Gaussian basis functions (GTOs). As it would be assumed, GTOs are more suitable for use in the Gaussian programme previously specified for use in this exercise. The primary advantage of GTOs in comparisons to STOs is the possibility of solving its associated integrals by analytical methods [2] Therefore GTOs may be combined in a linear manner in order to represent STOs, reduing the processing time required as the speed of analytical integration more than makes up for the increased number the increased number of GTOs. The basis set etc will be specified for each calculation performed in the following computational exercise.
The Cope Rearrangement of 1,5-Hexadiene
The Cope Rearrangement is a [3,3]-Sigmatropic reaction first reported in the literature by Cope et al. in 1940 [3]. It may further be defined, by application of the Woodward-Hoffman rules as a 4n+2,thermally allowed pericyclic reaction and is predicted to proceed via a transition state of Huckel topology in a suprafacial manner. Alternatively, this reaction may be initiated by light to proceed via a transition state of Mobius topology in an antarafacial manner. The reaction scheme of the Cope Rearrangement of 1,5-Hexadiene is presented below:
Fig 1: Reaction Scheme for Cope Rearrangement of 1,5-Hexadiene
The Cope Rearrangement has been studied in great deal in the literature (Computationally and Experimentally) with the general conclusion being that it proceeds via a concerted (pericyclic) mechanism. It has previously been computationally determined that the transition states through which the concerted mechanism proceeds resemble boat and chair conformations respectively, however, it has been reported that the chair conformation is of lower energy (Reference? João (talk) 12:58, 21 April 2015 (BST)). This computational exercise aims to extend the previous computational work to identify/characterise localised minima and saddle points on the potential energy surface (PES) via Hartree-Fock (HF) and Density Function Theory (DFT) analysis. In a further quantitative regard, the activation energy of the Cope Rearrangement is also calculated with comparison to the literature. [4]
Optimisation of Reactants and Products
The optimisation of the reactants and products was performed utilising the 3-21G basis set which an example of a Pople basis set or more generally a contracted basis set [5] . The physical meaning of this is that core type orbitals contribution to electronic structure are assumed negligible (If they are negligible why do you consider them at all? João (talk) 12:58, 21 April 2015 (BST)) thereby reducing the processing power required for calculation, in turn reducing computational expense. It has been proven in the literature that valence electrons have a much greater contribution to molecular structure and this allows us to give precedence to their influence in the calculations. In order to achieve this, core orbitals were isolated and they were represented by the LCAO approach as opposed to the more physically accurate representation of the variational principle (LCAO and the variational principle are not mutaully exclusive. In fact one uses the variation principle to determine the orbital coefficients in an LCAO approach. João (talk) 12:58, 21 April 2015 (BST)). There are two categories of Pople basis set, those of split valence and those of triple-split valence and the 3-21G is an example of the former. The '3' is representative of the total number of orbitals which are combined in a linear fashion to simulate the core orbitals. The presence of two number preceding the 'G' is indicative of the split valence basis set, with the '2' representing the number of basis functions required to simulate the core orbitals and the '1' representing the number of basis functions required to simulate the valence orbitals (You mentioned previously that in this basis set 3 gaussian functions were used to represent core orbitals. The 2 and 1 indicate that your valence orbitals are represented by 2 sets of functions, one formed by 2 contracted gaussian functions and another formed by 1 gaussian function. João (talk) 12:58, 21 April 2015 (BST)). Simplistically, the 'G' indicates that this is a Gaussian basis set, however, it of greater importance than just this as it is necessary to differentiate between the basis functions appearing before it and the following polarised functions.
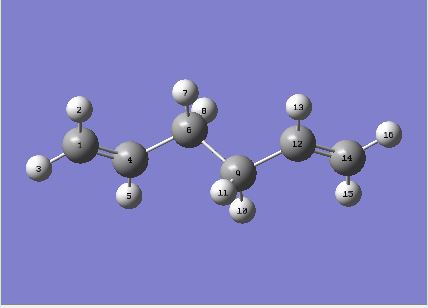
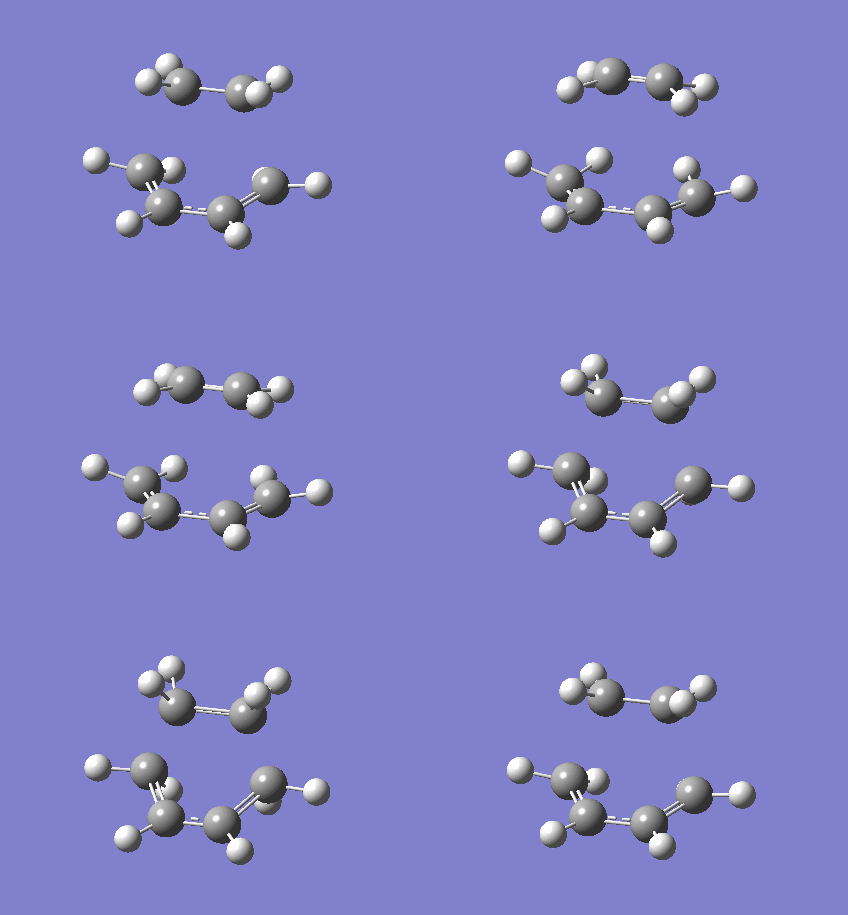
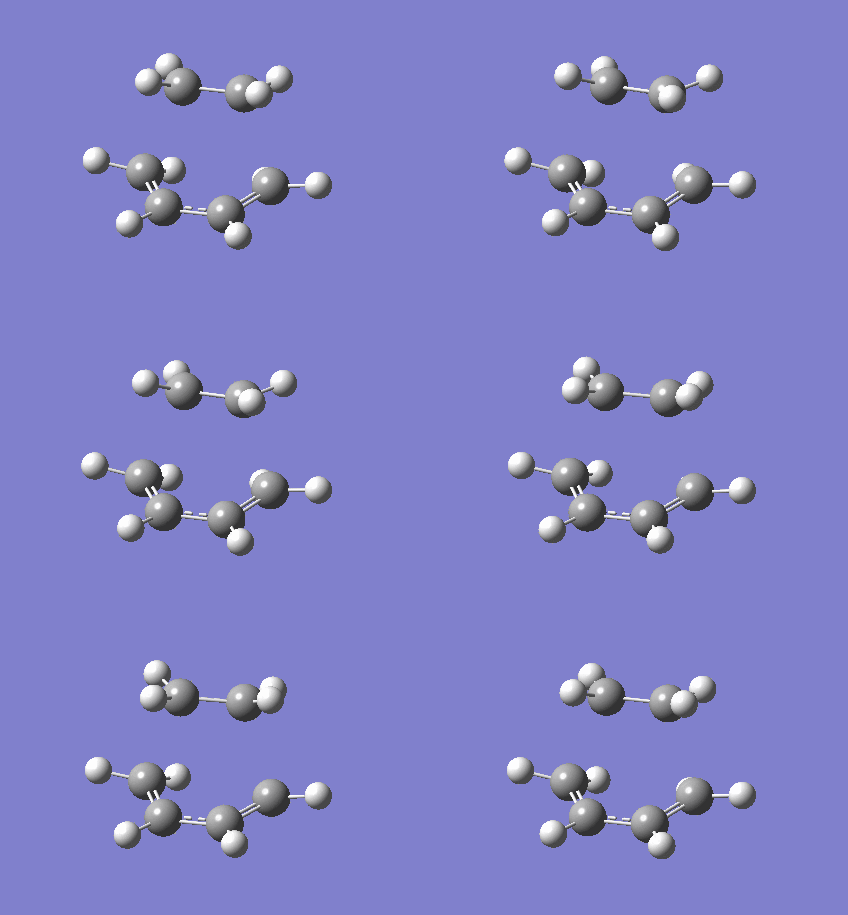
Initially optimisation calculations were performed, utilising the 3-21G basis set discussed above, on numerous Gauche and Anti conformations of 1,5-Hexadiene (Data presented in Table 1.). The respective energies of the lowest energy Gauche and Anti conformers were -231.69266 Hartree (a.u.) and -231.69260 Hartree (a.u.) which converts to -145389.37 kcal mol-1 and -145389.33 kcal mol-1 respectively (This conversion is important in order to compare to the literature as will be done later in this report). Although the precision of these calculations is very good it is important to note that the large number of significant figures to which the energy values are reported is a crude indication of their accuracy. Consequently the symmetrise function of Gaussian was used to determine the point group of the different conformers which were C1 and C2 respectively. Chemical intuition would lead us to expect the Anti conformation to be of slightly lower energy due to the dihedral angle of 180° between the central carbons in comparison to a dihedral angle of 60° in the Gauche conformation making stereoelectronic repulsion of the vicinal groups more likely in the Gauche conformer. However, the calculated energies contradict this statement, indicating the Gauche conformation to be of slightly greater stability. The following table (Table 1.) shows the optimised structures and energy values of various conformers of 1,5-Hexadiene in addition to their symmetry label. All optimisations in this case were performed to the Hartree-Fock (3-21G) level of accuracy.
| Conformer | Structure | Point Group | Energy(Hartrees) HF/3-21G |
Relative Energy(kcal mol-1) | ||
| Gauche (1) |
|
C2 | -231.69153 | 0.71 | ||
| Gauche (2) |
|
C1 | -231.68916 | 2.20 | ||
| Gauche (3) |
|
C1 | -231.69266 | 0.00 | ||
| Gauche (4) |
|
C2 | -231.69167 | 0.62 | ||
| Anti (1) |
|
C2 | -231.69260 | 0.04 | ||
| Anti (2) |
|
Ci | -231.69254 | 0.08 |
Table 1:Optimised structures and energy values of 1,5-Hexadiene
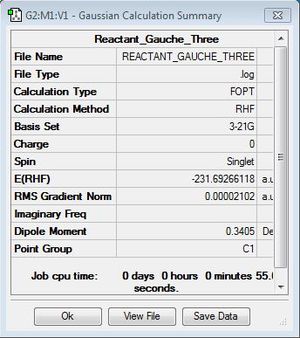
It is possible to confirm the convergence and therefore successful optimisation with respect to energy in these cases by inspecting the output log file and results summary. In order to demonstrate this, the relevant data for the Gauche (3) conformation is presented below:
    Item                  Value      Threshold  Converged
Maximum Force            0.000049     0.000450     YES
RMS     Force            0.000013     0.000300     YES
Maximum Displacement     0.001576     0.001800     YES
RMS     Displacement     0.000494     0.001200     YES
Predicted change in Energy=-4.987062D-08
Optimization completed.
   -- Stationary point found.
(The output above indicates that you found a structure for which the gradient of the electronic energy as a function of nuclear displacement is zero (a stationary point). Is that the same as a minimum on a potential energy surface? João (talk) 12:58, 21 April 2015 (BST))
Fig 2:Output log file data for Gauche (3) conformer
Fig 3:Summary Table for Gauche (3) conformer
It may now be assumed that the calculation has successfully converged to an optimised structure in any further calculations, however, in any case this may be checked in the same manner as above. This process is not repeated for every calculation as it would be a very time-consuming process. The optimised structure above, as mentioned previously, is of Gauche conformation as opposed to the marginally higher energy Anti conformations also shown, however, as of yet it has not been possible to identify a global minimum. It is evident that further analysis is required as free rotation about the central C-C bonds yields a number of local minima corresponding to a series of Gauche and Anti structures including those identified above.
Energetic Comparison
Table 1. above indicates that the difference in energy between the lowest energy and highest energy conformer is 2.20 kcal mol-1 which is clearly a significant discrepancy. However, the observation of the Gauche conformer being of greater stability in contrast to our predictions does not necessarily mean that the results ought to be discarded. A potential explanation of our experimental observation was reported by Rocque [6] and suggests the presence of stabilising Hydrogen-bonding interactions between the π-system of the olefin and the vinyl hydrogens. With the evidence presented it is not possible to conclude whether this effect is responsible or not as although it has been reported in many organic systems the general magnitude is generally relatively small in comparison to the energy discrepancies discussed here.
It has proven extremely difficult to definitively locate a global minimum amongst the potential conformations shown in Table 1 which in themselves represent six local minima (twenty-Seven potential conformations exist (Ten energetically distinct) but not all are presented as this is not within the scope of this exercise - see Gung's paper for further information on potential structures [7] ). Analysis of the current literature also fails to yield a conclusion as the energy differences observed are generally very small, however, electron diffraction investigations have indicated the Anti-conformation to be of marginally lower energy. Therefore, despite the quantitative outcomes from the computational model, it is unreasonable to compare the energies of the optimised Gauche and Anti conformers (Why? You made a calculation that has some approximations, which means that you may be overestimating some factors with respect to others. But you still can analyse your results. Your results tell you that a gauche conformation is lower in energy that all anti conformations. You can rationalize why that is so. Of course you should compare with experiment and check if the reason you found is a true physical effect or an artifact of the calculation. João (talk) 12:58, 21 April 2015 (BST)). This is due to the inaccuracy present in the Gaussian optimisation. Energetic comparison is unjustified as the energy values lie within the range of experimental error due to the programme itself i.e. the different conformations must be assumed degenerate. Our chemical intuition would expect the existance of a global minimum on the PES of 1,5-Hexadiene (Is the existance of the global minimum a matter of chemical intuition or a mathematical truth? (We are considering the potential energy surface in the region where atomic distances are within the molecular range.) João (talk) 12:58, 21 April 2015 (BST)), however, it is impossible to locate the minimum within the confines of Gaussian's experimental error. There are no immediately obvious factors which allow us to conclude the greater stability of a single conformation over another as energetic stability can be dependent on a range of stereochemical factors, for example the Gauche and Anomeric effects. Therefore, it is reasonable to conclude that a global minimum is in existence, however, its location may not be elucidated by the current computational method.
Density Functional Theory (DFT) Approach
In some situations the Hartree-Fock 3-21G approach is simply not accurate enough. In these situations Density Functional Theory (DFT) may be applied to optimise the system at a higher level, however, it is worth noting that this requires significantly greater computational power and hence expense, wherein lies the advantage of the HF methodology. Within this categories many analyses may be preformed, however, the B3LYP semi-empirical method is particularly useful. Despite the clear advantages of DFT it is important to note that this is not a faultless approach and there is no system in place to ensure the convergence of the calculation to an exact value. However, for this instance it is assumed that the error resulting from this is negligible (Why would you consider the error negligible? Approximations in the calculations exist, and we should acknowledge it. That does not mean is useless. João (talk) 12:58, 21 April 2015 (BST)). In addition to the higher level of theory applied in this example, the basis set is also changed to 6-21G* which consists of six Gaussian orbitals and hence is more representative of the core electronic orbitals (It is actually 6-31G*, so you not only have a better description of core electrons but you also have more functions describing valence electrons, including polarization functions. João (talk) 12:58, 21 April 2015 (BST)).
Therefore the next step of this computational exercise was to optimised the Anti (2) conformer of 1,5-Hexadiene (Table 1.) to a higher level of theory. This calculation is required to determine the total Cope rearrangement activation energy and also allows comparison of the activation energies determined at the H-F (3-21G) and B3LYP (6-21G) theory levels. The optimised structure of Anti (2) conformation is presented in figure 4 below for the B3LYP (6-31G*) system and the reported energy was -234.55971 Hartree.
Fig 4: Optimised Anti (2) conformer |
The two structures of conformation Anti (2) optimised via the Hartree-Fock/3-21G and B3LYP/6-21G* approaches are compared below in reference to the literature [????] (determined by electron diffraction studies) in order to give an indication of the bond length validity. The bond positions are defined by the accompanying atom labelled structure, however, it is important to not that as the molecule is symmetric the C1-C4 bond length is equivalent to the C12-C14 bond length etc, therefore, only one of each is explicitly labelled. Table 2. gives a detailed comparison of C-C bond lengths whereas Table 3. refers to the dihedral angles observed in the optimised structures:
| Bonding Atoms | H-F/3-21G Bond Length (Å) | BY3LYP/6-21G* Bond Length (Å) | Literature Bond Length (Å)[?????] |
| C1 - C4 | 1.316 | 1.338 | 1.340 |
| C4 - C6 | 1.509 | 1.507 | 1.508 |
| C6 - C9 | 1.553 | 1.555 | 1.538 |
Table 2: Table 2. Comparison of C-C bond lengths
| Bonding Atoms | H-F/3-21G Dihedral Angle (°) | BY3LYP/6-21G* Dihedral Angle (°) |
| C1 - C4 - C6 - C9 | -114.643 | 118.795 |
| C4 - C6 - C9 - C12 | 179.989 | 180.000 |
| C6 - C9 - C12 - C14 | 114.663 | -118.796 |
Table 3: Dihedral angles observed in the Optimised Structures
Fig 4: Labelled structure of Anti (2) conformer to assign above tables
It has been reported in the literature that the Hartree-Fock method generically underestimates the length of bonds [1] and this data is supported in table 2. as the bond lengths for the sp2 carbons in particular are far below the electron diffraction value [8] In contrast, the DFT method appears to have been relatively accurate in this regard. However, elsewhere in the molecule there are no obvious trend observed in the bond length data. In reference to Table 3. the only immediately obvious point of interest is that the dihedral angles determined via the DFT method appear to be much closer to 120° between the sp2 and sp3 carbon substituents. It may be tentatively concluded that the DFT method demonstrates improved correlation to the literature, however, there is only limitted evidence on which to base this conclusion so it is not firm. (Overall how do the DFT and HF structures compares to each other? Very different? João (talk) 12:58, 21 April 2015 (BST))
Frequency Analysis and Thermodynamic Properties
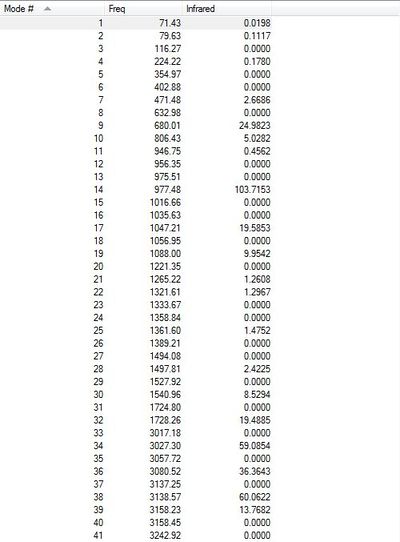
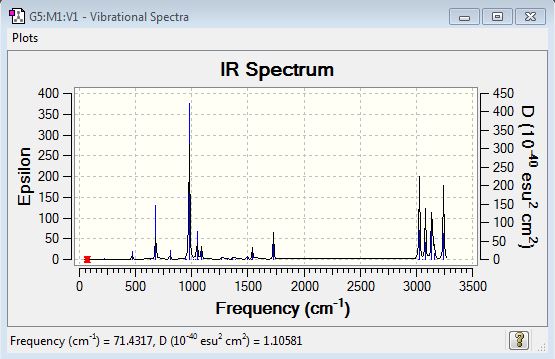
A further frequency analysis was performed on the B3LYP/6-21G* optimised structure of the Anti (2) conformation in order to determine the thermodynamic properties of the molecule and confirm whether or not a true energy minimum has been identified. If the conformer has been optimised to a minimum we would expect not to see any imaginary frequencies as these will occur in the situation where the second derivative of the energy from the PES is negative (ie. the force constant is negative). It is obvious that if this were the case the PES would be observed to decrease in energy value in some direction from the point identified therefore rendering this not to be an energy minimum. Figure 6 below presents the data from the vibrational spectrum and clearly shows no imaginary frequencies so it may be concluded that a true energy minimum has been identified. If the value in the'Infrared' column is non-zero then the vibrational mode is responsible for a variation in the total dipole moment of the molecule and is hence IR-active.
Fig 6: IR Vibration Table for Anti (2) conformer
Fig 7: IR Spectrum for Anti (2) conformer
As mentioned previously, the secondary aim of the frequency analysis was to quantify some of the thermodynamic properties of the conformer and the values obtained are presented below in Table 4. The sum of the electronic and thermal energies shall be applied at a later stage in the analysis to determine the activation energy of the Cope Rearrangement and therefore it is this value that is of greatest importance. It was suggested to repeat the frequency analysis at 0K in order to compare the thermodynamic data under alternate temperature conditions, however, it was not possible to perform the frequency calculation at precisely 0K in Gaussian and therefore the analysis was performed at 0.01K. Despite this slight inconvenience, as expected the thermal contribution to energy became negligible such that all of the thermodynamic parameters presented became essentially equal to the sum of the electronic and zero-point energies.
| Energy Parameter | Initial Value (Hartree) | Low Temperature Value (Hartree) |
| Sum of Electronic and Zero-point Energies | -234.484751 | -234.484542 |
| Sum of Electronic and Thermal Energies | -234.477536 | -234.484542 |
| Sum of Electronic and Thermal Enthalpies | -234.476591 | -234.484542 |
| Sum of Electronic and Thermal Free Energies | -234.515794 | -234.484542 |
Table 4: Thermochemical data for Anti (2) conformer at 298.15K and 0.01K
Optimisation of the Chair and Boat Transition Structures
There were two methodologies applied to optimise each of the transition states; the boat transition state and the chair transition state. The chair transition state was initially optimised utilising the Berny method followed by the redundant coordinate method in which some interatomic distances were frozen. The Berny methods name is derived from the computational chemist who pioneered it, Berny Schlegel. The boat transition state was optimised utilising both the QST2 and QST3 methods in which both the reactants and products are specified, in addition to a proposed transition state structure in the case of QST3, and the structure interpolated between these points to identify the energy maximum which corresponds to the respective transition state.
Berny Transition State Calculation
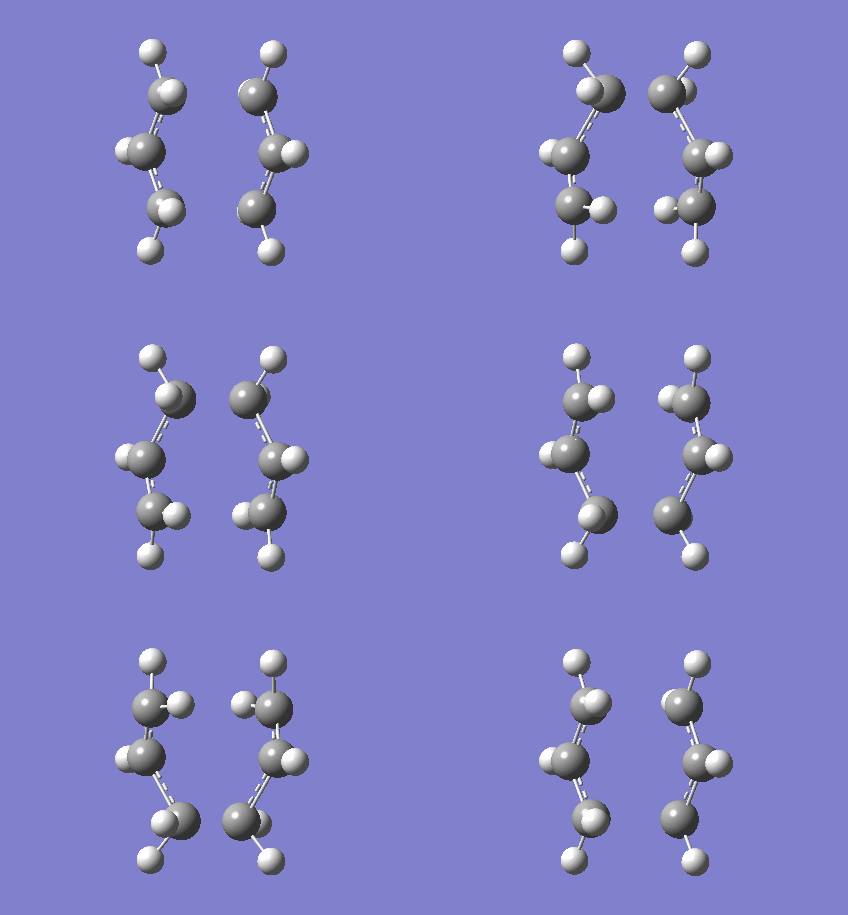
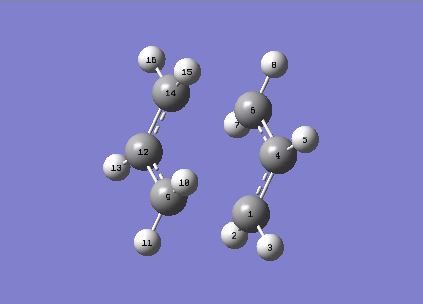
Initially an allyl fragment with two symmetrical C-C bonds of order 1.5 was created in Gaussview and optimised as above utilising the Hartree-Fock/3-21G methodology, yielding the structure shown below (figure 8). A new molecule group was constructed in Gaussview consisting of two optimised allyl fragments arranged in an approximate chair conformation. This guessed transition state structure was then optimised via the Berny methodology as mentioned previously by analysis of the bonding force constants. The optimised structure is shown below (figure 9) with a C-C separation of 2.020Å between the terminal carbons of the initial allyl fragments. In addition, a frequency calculation was also performed to confirm the identification of true transition state and an imaginary frequency (negative) observed at -817.95 cm-1 which is demonstrated in the animation below (figure 10):
Fig 8: Optimised Allyl Fragment |
Fig 9: Optimised Transition State (H-F/3-21G) |
Fig 10: Imaginary Frequency observed at -817.95 cm-1
Redundant (Frozen) Coordinate Transition State Calculation
In this approach the C-C separation between the terminal carbons of the initial allyl fragments was frozen to a value of 2.20Å in contrast to the value of 2.020Å determined from the optimisation above. Despite the obvious disparity it was deemed suitable to lock the coordinates in this position for the first step of the analysis. The structure was then optimised under these constraints before releasing them in order to perform a further optimisation. In this case the bond-forming process was investigated to yield the chair transition structure described previously. In this analysis the C-C separation was eventually determined to be 2.021Å which allows the conclusion that within the realms of experimental error the two approaches identify the same chair transition state structure. The structure of the optimised chair structure is shown below in figure 11:
Fig 11: Optimised Chair Transition State |
Comparison
It is immediately evident that the bond lengths determined via the frozen coordinate method are generally slightly greater than those determined via the Berny method as detailed by the data in Table 5. The H-H separations included in this table are shown in order to highlight the potential effects of 1,3-diaxial interactions which may either raise the energy of the transition state due to biaxial repulsion or lower the energy if attractive Van-der-Waals interactions manifest themselves at this internuclear separation. In this regard it is observed that both the redundant coordinate and Berny optimisations yielded significantly greater internuclear separation for these hydrogens than those present on the remainder of the allyl fragment.
| Bond | Berny Optimisation (Å) | Redundant Coordinate Optimisation (Å) |
| C14 - C6 | 2.02037 | 2.02068 |
| H15 - H8 | 2.54597 | 2.54531 |
| H16 - H8 | 2.63156 | 2.63173 |
| H15 - H5 | 2.92180 | 2.92225 |
Table 5: Comparison of Bond Lengths in Chair transition structure determined by Berny and Redundant Coordinate Methods
Fig 12: Optimised Chair transition state with atom labels to assign table above
QST2 Transition State Calculation
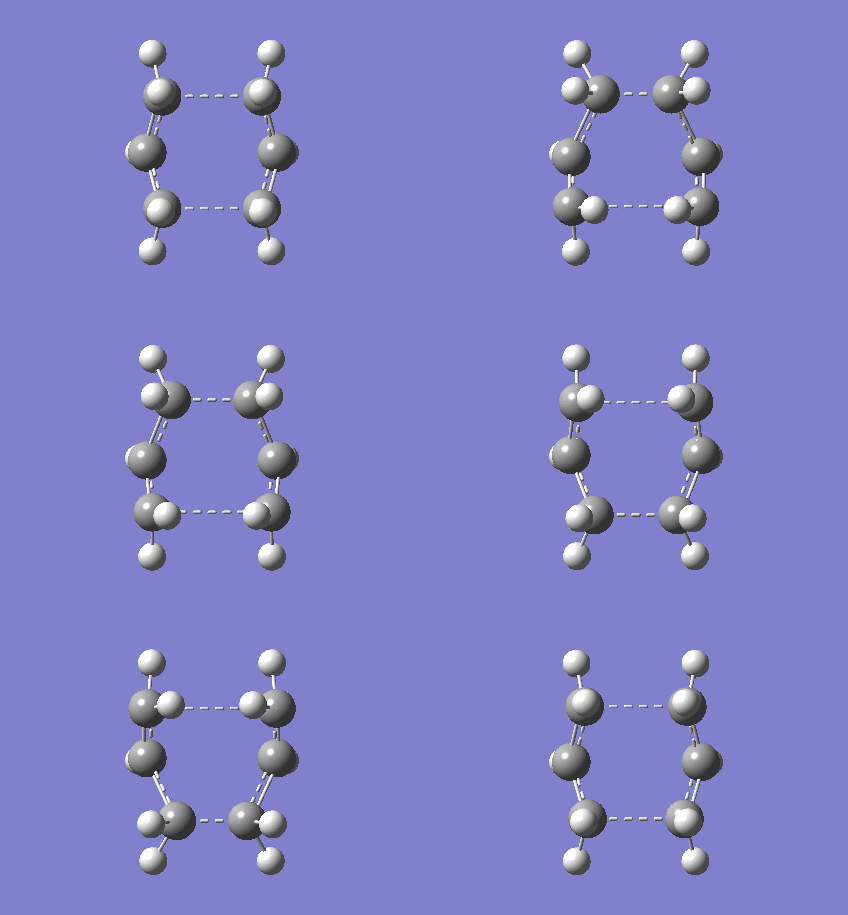
In simplistic terms, the QST2 methodology interpolates between the reactants and products of a reaction essentially probing the PES in order to identify the energy maximum corresponding to the transition state structure. Although this is theoretically a simple process, it is important that the optimised structures of the products are carefully entered into the system and the atoms labelled suitably. In this case, the reactants and products were essentially equivalent conformers of 1,5-Hexadiene yet inverted in terms of atom labelling so it was important to ensure consistency across the two. What this does is to define certain characteristics of the system to differentiate the reactant from the product and this is maintained throughout the calculation as other parameters are optimised to identify the transition state. Furthermore, it is important that the reactant and product demonstrate significant resemblance to the expected transition state. Initially the optimised 1,5-Hexadiene structure was applied, however, this was unsuccessful (In which way was the calculation unsuccessful? Didn't you obtain a transition state? João (talk) 16:08, 21 April 2015 (BST)) and therefore the reactant/product structure had to altered to bear greater resemblance to the boat transition state desired. The optimised boat-conformation transition state is demonstrated in figure 13 and the C-C separation of the terminal carbons in this case was 2.140Å.
Fig 13: Optimised Boat Transition State |
As previously further frequency analysis was also performed in order to assess the validity of the transition structure. An imaginary (negative) frequency was observed at -840.03 cm-1 and is animated in figure 14 below. It is obviously representative of the Cope Rearrangement which we are investigating in this exercise so the QST2 analysis appears to have been relatively successful.
Fig 14: Imaginary Frequency observed at -840.03 cm-1
QST3 Transition State Calculation
The QST3 methodology is a logical extension of the QST2 methodology discussed above. In this case an approximate geometry for the transition state is also provided to the Gaussian programme, allowing a much wider margin for error in the input structures which, as described above, is often problematic. As previously a boat transition state structure was obtained with only marginal differences observed to that determined by the QST2 calculation. This structure is shown in figure 15 below:
Fig 15: Optimised Boat Transition State (QST3) |
Comparison
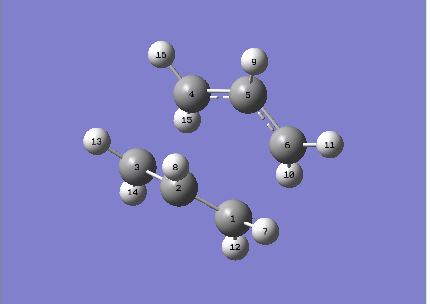
The optimised bond lengths from both the QST2 and QST3 calculations are presented in Table 6 below. Comparison of the data in this table yields the conclusion that the identified boat transition structures are nigh on identical within the realms of experimental error.
| Bond | QST2 Optimisation (Å) | QST3 Optimisation (Å) |
| C1 - C6 | 2.13994 | 2.14019 |
| C2 - C5 | 2.77974 | 2.77974 |
| H8 - H9 | 3.13494 | 3.13494 |
Table 6: Comparison of Bond Lengths in Boat transition structure determined by QST2 and QST3 Methods
Fig 16: Optimised Boat transition state with atom labels to assign above table
The Intrinsic Reaction Coordinate (IRC)
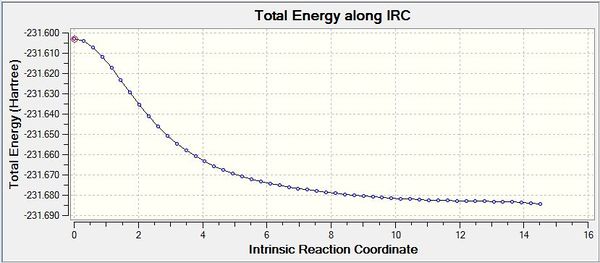
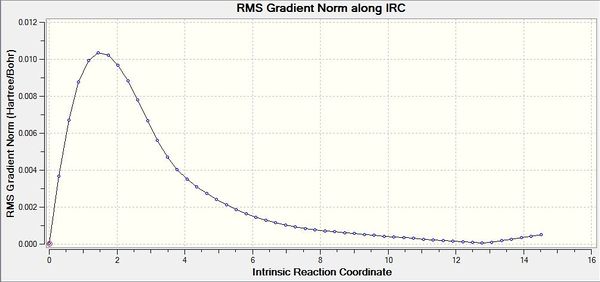
The Intrinsic Reaction Coordinate (IRC) is a method in which a series of positions on the PES of maximum energy gradient are taken sequentially in order to identify a local minimum. The IRC or steepest descent method is a useful method of specifically probing the important region of the PES, in particular for locating minima on the PES (Is the purpose of an IRC calculation to find a local minimum on the potential energy surface? Why not doing an optimization instead in this case? João (talk) 16:08, 21 April 2015 (BST)) if the transition state structure is given, as in this case. IRC calculations were performed on both conformations of the optimised transition state; the boat and the chair. This was done to the same theory level as in the transition state calculation in order to retain consistency. In the calculation set up it was specified that the force constant would always be calculated and fifty sampling points ought to be completed, however, the IRC calculations converged after sampling 44 times for the Chair and 51 times for the Boat. It is also important to note that the IRC calculation was only run in the forwards direction due to the Cope Rearrangement being thermoneutral i.e. the PES would be symmetrical about the transition state maximum. Therefore it would be predicted that if we were to repeat the calculation in the backwards direction the same conformation ought to be attained. In both cases, after further optimisation the Gauche (4) conformer from Table 1. was identified as the point of convergence from either transition state. The convergence towards an energy minimum may be confirmed by analysis of the RMS gradient chart shown in figures 18 and 20. It is clearly observed that the gradient converges towards a zero value confirming that a minimum energy point has been identified (Could it be a saddle point? João (talk) 16:08, 21 April 2015 (BST)). The IRC graphs obtained from both the boat and the chair transition states are shown in figures 17 and 29 respectively:
Fig 17: IRC initiated from the Boat Transition State
Fig 18: IRC RMS Gradient Graph for Boat Transition State
Fig 19: IRC initiated from the Chair Transition State
Fig 20: IRC RMS Gradient Graph for Chair Transition State
The IRC calculation was repeated for the Chair transition state as it is often observed that the IRC does not converge to a true energy minimum. The first change was to optimise the final structure obtained from the IRC and the structures obtained in this case are shown in figures 21 and 22 for the Boat and Chair transition states respectively. This did show a significant improvement, however, it is worthy of note that the IRC optimised structure was in fact relatively close to the optimised Gauche (4) conformation mentioned previously. Secondly, the number of sampling points specified was increased to 100, however, this had no impact on the optimised structure because, as mentioned above, the calculation converged after 44 sampling points.
Fig 21: Optimised IRC Output Structure (Boat Transition State) |
Fig 22: Optimised IRC Output Structure (Chair Transition State) |
Activation Energy of the Cope Rearrangement of 1,5-Hexadiene
The primary aim of this entire exercise was to use the optimised reactant and transition structures to determine thermodynamic properties of the Cope Rearrangement, in particular the activation energy. This was achieved utilising the Anti (2) confirmation of Ci symmetry as the reactant/product reference due to this being the conformation from which the boat transition state was identified. The data acquired previously concerning the magnitude of the electronic and thermal energy etc is shown in Table 7 for all levels of theory and conformations and the relevant activation energies calculated below in Table 8. It is worthy of note that for both the boat and chair transition states a single imaginary vibration was observed at both levels of theory indicating that the determined geometries are in relatively good agreement. Despite this, there is significant disparity in the calculated activation energies and by comparison to the literature [4] it may be concluded that the values determined by the DFT method are of greater accuracy. The final point of note is the general trend for activation energies to be marginally higher at 0K in comparison to ambient temperature. (What could be a reason for that? João (talk) 16:08, 21 April 2015 (BST))
| HF/3-21G | B3LYP/6-31G* | |||||
|---|---|---|---|---|---|---|
| Electronic energy (Hartree) | Sum of electronic and zero-point energies (Hartree) | Sum of electronic and thermal energies (Hartree) | Electronic energy (Hartree) | Sum of electronic and zero-point energies (Hartree) | Sum of electronic and thermal energies (Hartree) | |
| 0 K | 298.15 K | 0 K | 298.15 K | |||
| Chair Transition State | -231.619322 | -231.466698 | -231.461339 | -234.571962 | -234.430444 | -234.424463 |
| Boat Transition State | -231.602802 | -231.450930 | -231.445302 | -234.492902 | -234.418534 | -234.411900 |
| Reactant (Anti (2)) | -231.692535 | -231.539539 | -231.532566 | -234.559706 | -234.484542 | -234.477536 |
Table 7: Thermochemical data for Anti (2) conformer
| HF/3-21G | HF/3-21G | B3LYP/6-31G* | B3LYP/6-31G* | Literature Experiment [4] | |
| 0 K | 298.15 K | 0 K | 298.15 K | 0 K | |
| ΔE (Chair)(kcal mol-1) | 45.707995 | 44.695156 | 33.946657 | 33.303467 | 33.5±0.5 |
| ΔE (Boat)(kcal mol-1) | 55.602413 | 54.758422 | 41.420218 | 41.185643 | 44.7±2 |
Table 8: Activation energy data for Anti (2)conformer
The Diels-Alder Cycloaddition
In this part of the exercise we shall consider a different, although related, system to that above. In this case we shall be investigating the Diels-Alder cycloaddition of cis-butadiene and ethene via computational methods. The product of this reaction is cyclohexene, however, it might also be referred to as the Diels-Alder adduct. The reaction scheme for this Diels-Alder cycloaddition is shown in figure 23 below:
Fig 23: Reaction Scheme for Diels-Alder cycloaddition of Ethylene and Cis-butadiene
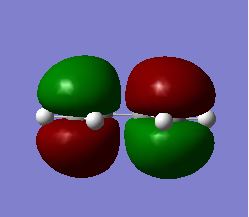
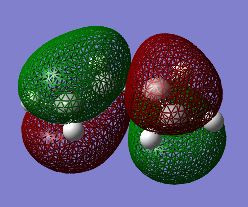
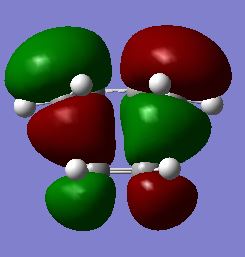
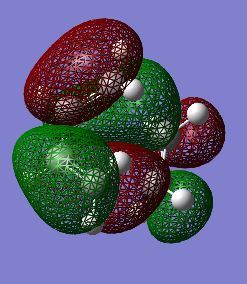
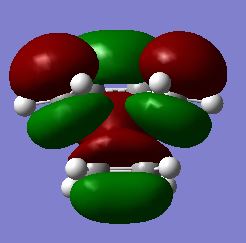
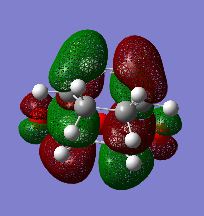
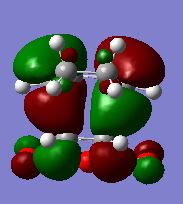
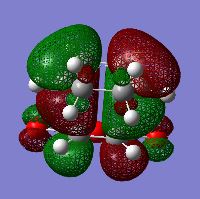
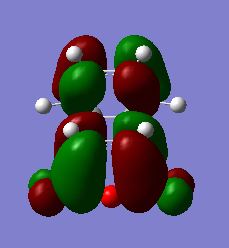
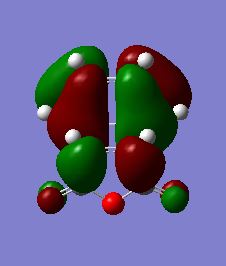
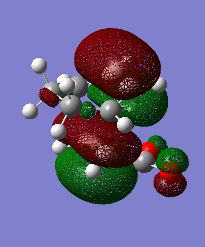
The first stage of this project was to consider the reactants themselves in this Diels-Alder cycloaddition, therefore the HOMO/LUMO of cis-butadiene were optimised in a semi-empirical manner via the Austin Model One (AM1) approach. The structures of the optimised HOMO and LUMO are shown in figures 25/26 and 27/28 respectively. It is readily observable that the HOMO of cis-butadiene is anti-symmetric with respect to the symmetry plane which bisects the central C-C bond whereas the LUMO of cis-butadiene is symmetric about this symmetry plane.
Fig 24: Optimised Structure of Cis-butadiene |
Fig 25: Optimised HOMO of Cis-butadiene (Solid View)
Fig 26: Optimised HOMO of Cis-butadiene (Mesh View)
Fig 27: Optimised LUMO of Cis-butadiene (Solid View)
Fig 28: Optimised LUMO of Cis-butadiene (Mesh View)
Secondly we must consider the other reactant, therefore the structure of Ethene was optimised via the same approach as for the cis-butadiene reactant.The optimised structure of Ethene is shown below in figure 29:
Fig 29: Optimised Structure of Ethene |
Frontier Molecular Orbital (FMO) Theory
Frontier Molecular Orbital (FMO) theory is an important methodology by which the outcome of chemical reactions may be predicted in a qualitative regard. FMO theory generically considers the interactions of the valence orbitals of the reactants, placing particular emphasis on the interaction of HOMO/LUMO. It is an extension of Molecular Orbital (MO) theory which predicts that a reaction is likely to take place if the relevant orbitals involved in the interaction are of similar energy and demonstrate a large degree of in-phase spacial overlap. The relevant orbitals will be of similar energy if the reactants are suitable for the desired reaction, whereas the degree of spacial overlap is related to the symmetry of the reactant orbitals etc. The Diels-Alder reaction in question (between cis-butadiene and ethylene) is governed by normal electronic demand i.e. the LUMO of the dienophile (Ethylene) interacts primarily with the HOMO of the diene itself (Cis-butadiene). As discussed previously these orbitals are both anti-symmetric with respect to the central symmetry plane.
Woodward-Hoffman Rules of Pericyclic Reactions
The Woodward-Hoffman (W-H) rules are a useful tool to determine whether a specific pericylic reaction will be allowed/disallowed under thermal or photochemical excitation and are derived from the orbital conservation theory. The Diels-Alder reaction is an example of a cycloaddition which itself comes under the broad umbrella of pericyclic reactions, therefore the Woodward-Hoffman rules are relevant in this case. The specific Diels-Alder reaction which we consider here may be defined as a 4n+2 cycloaddition which is thermally allowed and proceeds suprafacially via a transition state of Huckel topology. As this reaction is 'thermally allowed' it may be concluded that under thermal conditions the spacial overlap of the HOMO/LUMO orbitals concerned is relatively good and there is no substantial energetic barrier to reaction.
The Transition State Geometry and Reaction Pathway
As previously mentioned, we will initially consider the Diels-Alder cycloaddition of cis-butadiene and ethylene to form cyclohexene (the Diels-Alder adduct). The objective in this section of the exercise was to identify the optimised transition state structure to the AM1 level of theory and the result of this is illustrated in figure 30:
Fig 30: Optimised Diels-Alder Transition State |
The transition state structure above was confirmed to correspond to a true energy maximum (It is actually a saddle point. João (talk) 16:08, 21 April 2015 (BST)) (transition state) via frequency analysis, again to the AM1 level of theory. The frequency analysis reported a single imaginary (negative) frequency at -955.98 cm-1 to indicate the optimisation had been successful and this is illustrated in figure 31 below:
Fig 31: Imaginary Frequency observed at -955.98 cm-1
Observation of the animated imaginary frequency above confirms that this does in fact correspond to the concerted bond breaking/forming involved in the Diels-Alder cycloaddition. The motion of the carbons clearly indicates there is synchronised bond formation in this imaginary frequency, allowing a fairly deep insight to how this reaction might proceed. In contrast to this the lowest real (positive) frequency does not obviously provide any information as to how the reaction might progress. It is demonstrated in the animation below (figure 32):
Fig 32: Real Frequency observed at 147.32 cm-1
The next stage of the analysis was to redetermine the HOMO/LUMO for the transition structure, again to the AM1 level of theory. The results of this are shown in figures 33/34 and 35/36 which represent the HOMO and LUMO respectively:
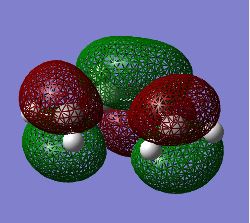
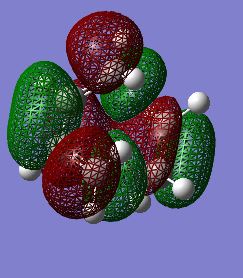
Fig 33: Optimised HOMO of transition state (Solid View)
Fig 34: Optimised HOMO of Transition State (Mesh View)
Fig 35: Optimised LUMO of Transition State (Solid View)
Fig 36: Optimised LUMO of Transition State (Mesh View)
Analysis of the above structures yields the conclusion that, as previously, the LUMO is symmetric with respect to the central symmetry plane whereas the HOMO is anti-symmetric in this regard. Another important piece of information to be gleaned from this structure is the interatomic distance between the terminal carbons of the two fragments which was determined to be 2.11935Å. The VdW radius of carbon is approximately 1.70Å [9] which is clearly far above half of the determined bond length yielding the conclusion that there must be a favourable interaction between the two resulting in the partial formation of a σ-bond in the transition state. The bonds which originated with a C-C bond order of two (all except cis-butadiene's central C-C bond) exhibit an optimised bond length of approximately 1.38Å in the transition structure whereas the bond which originated as a single C-C bond exhibits a bond length of approximately 1.40Å. It is immediately obvious that all of these bonds have a bond order which is intermediate between one and two via comparison to the respective literature bond lengths of 1.34Å and 1.54Å of a single and a double C-C bond respectively [10]. This is further indicative of a concerted reaction mechanism as at the transition state all of the newly formed C-C bonds are of similar length with the C-C separation at the point where a double bond is formed in the product being slightly decreased in comparison, suggesting that the transition state structure is slightly distorted towards the product side. This argument may be extended to say that the carbon centres in the transition structure will be intermediate between sp2 and sp3 hybridisation. The final piece of information which is important to state is that the HOMO of the Diels-Alder transition state (figure 33/34) is formed by the linear combination of the LUMO of the dienophile (Ethene) and the HOMO of the diene (cis-butadiene(figure 25/26)).
Activation Energy Calculation
The activation energy of the Diels-Alder reaction in question may be determined by comparison of the thermochemical properties of ethene, cis-butadiene and the optimised transition state. In order to obtain these quantities it was necessary to complete a frequency analysis to the AM1 level of theory on each of the relevant molecules. The sum of the thermal and electronic energies were calculated to be 0.080252 Hartree, 0.138573 Hartree and 0.259452 for Ethene, Cis-butadiene and the optimised transition states respectively. From the above data it was possible to determine the activation energy which was calculated to be 25.493564 kcal mol-1. Comparison of this to the experimentally determined value in the literature (27.5 kcal mol-1)[11] indicates that the AM1 method has been fairly accurate despite the relatively low level theory involved. It may be speculated that this perceived accuracy is a result of the semi-empirical nature of the calculation such that output values would be expected to lie in a similar range to the experimental (empirical) value.
Regioselectivity of the Diels-Alder Reaction
In the second section of the exercise we shall consider another Diels-Alder cycloaddition, this time between Maleic Anhydride and Cyclohexa-1,3-diene to form Bicyclo[2.2.2]oct-5-ene-2,3-dicarboxylic Anhydride as the Diels-Alder adduct. It may be more specifically defined (by application of the Woodward-Hoffman rules) as a 4n+2, thermally allowed process which proceeds suprafacially. There are two potential products, the exo and the endo which in turn correspond to two separate transition structures as will be discussed in greater detail below.
Exo/Endo Transition Structures
Both the Endo and Exo transition structures were optimised via the Berny methodology applied previously at the semi-empirical AM1 theory level with a subsequent frequency analysis confirming the successful identification of a transition structure. As in the previous Diels-Alder analysis the first stage was to optimise the reactants, the structures of which are shown below (figure 36 1,3 -Cyclohexadiene, figure 37 Maleic Anhydride):
Fig 36: Optimised 1,3-Hexadiene Structure |
Fig 37: Optimised Maleic Anhydride Structure |
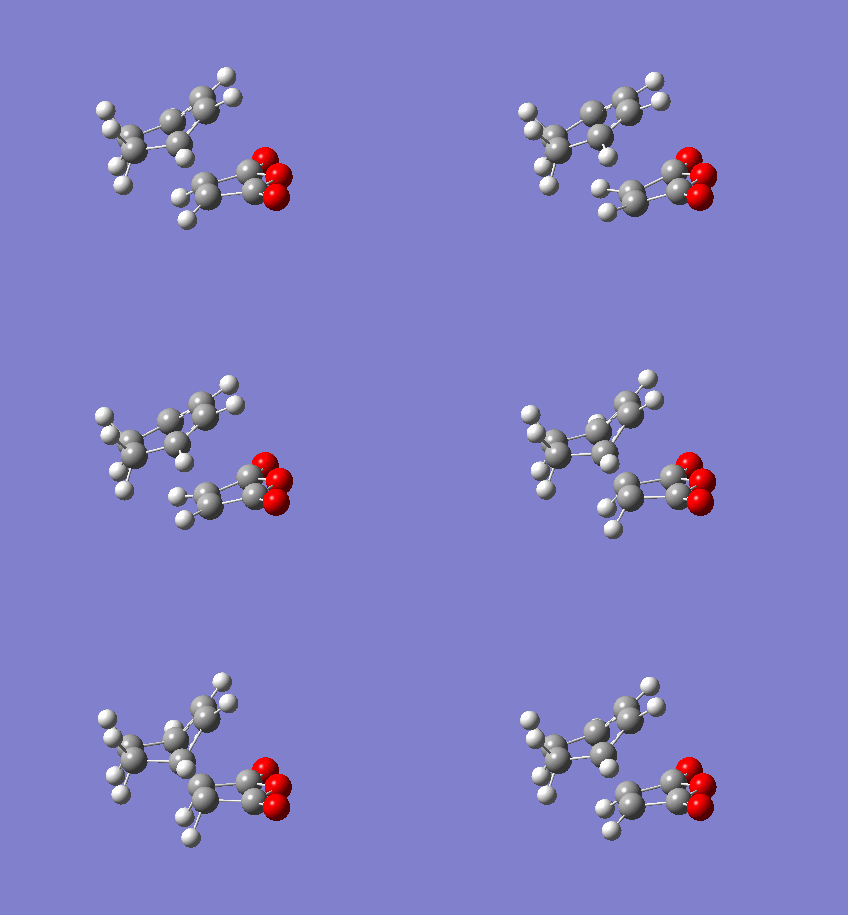
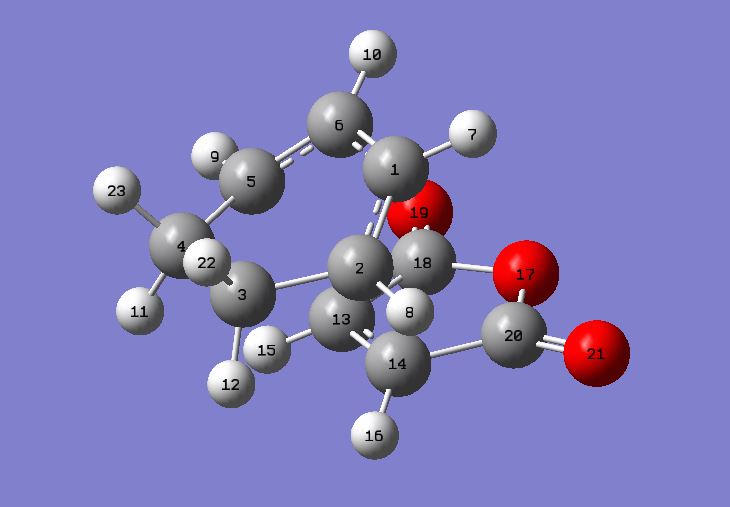
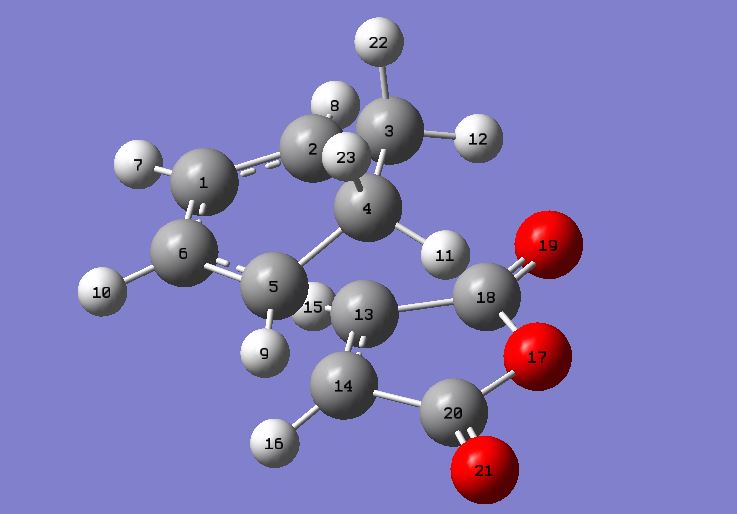
The structure of the transition states are defined in figures 38 and 39 which shown the optimised structures of the Endo and Exo transition states respectively:
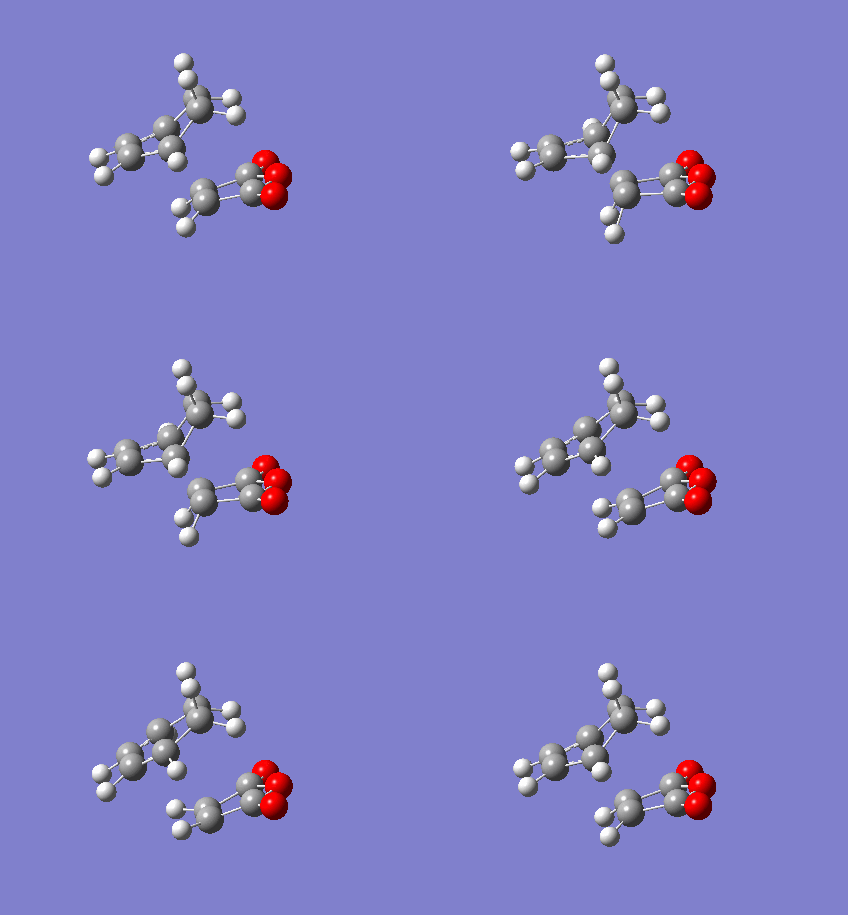
Fig 38: Optimised Endo Transition Structure |
Fig 39: Optimised Exo Transition Structure |
From the data presented in table 9 below it was calculated that the Endo structure is 0.001085 Hartree (0.680841 kcal mol-1) lower in electronic energy than the Exo transition structure. Furthermore, the sum of the electronic and thermal energies was 0.001198 Hartree (0.751749 kcal mol-1) greater for the Exo transition structure than for the Endo Structure. Therefore in general it may be concluded that the Endo transition structure is approximately 0.75 kcal mol-1 more stable than the Exo transition structure.
| Electronic Energy (Endo)(Hartree) | Sum of Electronic and Thermal Energies (Endo)(Hartree) | Electronic Energy (Exo)(Hartree) | Sum of Electronic and Thermal Energies (Exo)(Hartree) |
| -0.051505 | 0.143683 | -0.050420 | 0.144881 |
Table 9: Energetic Data Comparison data for Exo/Endo Transition States
As before a single imaginary (negative) frequency was observed in each case, confirming the convergence to a maxmimum. The imaginary frequency was observed at -806.20 cm-1 in the Endo transition state and -812.21 cm-1 in the Exo transition state. These imaginary frequencies are presented in figures 40 and 41 for Endo and Exo respectively and clearly correspond to synchronous bond formation as would be predicted for a concerted process such as the Diels-Alder cycloaddition:
Fig 40: Imaginary Frequency of Endo Transition State observed at -806.20 cm-1
Fig 41: Imaginary Frequency of Exo Transition State observed at -812.21 cm-1
Table 10 presents comprehensive structural data in relation to the transition states such that their structures may be compared and contrasted (Atom labelled transition structures are presented in figures 42 and 43 for reference to Table 10). The most striking aspect of this is that the internuclear separation in the breaking/forming bonds is larger in the Exo transition state than in the Endo transition state. This internuclear separation has a potentially large impact on the stability of the transition state. Despite there being many influences on the relative stability of the Endo/Exo structures, the dominating factor is probably demonstrated in Table 10. The internuclear separation of the carbonyl carbon and the sp2 fragment present in the endo structure (2.89Å) is comparable to that of the carbonyl centre and the sp3 fragment present in the exo structure (2.95Å). Due to the increased steric demands of the tetrahedral carbon centre there is increased steric strain in the exo structure which destabilises this transition state relative to the endo equivalent. In contrast to the steric repulsion observed in the Exo transition state, secondary orbital interactions are observed to stabilise the Endo transition structure, further widening the energy discrepancy. The presence of secondary orbital interactions as the prominent stabilsing effect in the endo structure has long been accepted in the literature, however, alternative explanations invoke the presence of attractive Van der Waals interactions (Reference? João (talk) 16:08, 21 April 2015 (BST)). Therefore, under kinetic conditions the Endo product often domninates as the reactions proceeds to this product via a lower energy reaction pathway, however, it is in fact the Exo product which is thermodynamically more stable. Consequently, under thermodynamic conditions this is the product which is formed.
| Bond description (Endo) | Bond Length (Endo)(Å) | Bond description (Exo) | Bond Length (Exo)(Å) |
| C1 - C6 | 1.39724 | C1 - C6 | 1.39685 |
| C5 - C6 | 1.39305 | C5 - C6 | 1.39438 |
| C4 - C5 | 1.49053 | C4 - C5 | 1.48972 |
| C3 - C4 | 1.52297 | C3 - C4 | 1.52208 |
| C2 - C3 | 1.49053 | C2 - C3 | 1.48973 |
| C1 - C2 | 1.39305 | C1 - C2 | 1.39438 |
| C13 - C14 | 1.40849 | C13 - C14 | 1.41011 |
| C14 - C20 | 1.48923 | C14 - C20 | 1.48817 |
| C13 - C18 | 1.48923 | C13 - C18 | 1.48821 |
| C2 - C14 | 2.16239 | C2 - C13 | 2.17022 |
| C5 - C13 | 2.16239 | C5 - C14 | 2.17051 |
| C1 - C20 | 2.89222 | C4 - C20 | 2.94502 |
| C6 - C18 | 2.89222 | C3 - C18 | 2.94521 |
Table 10: Structural Data for Endo/Exo Transition Structures
Fig 42: Atom labelled Endo Transition Structure
Fig 43: Atom labelled Exo Transition Structure
Secondary Orbital Overlap
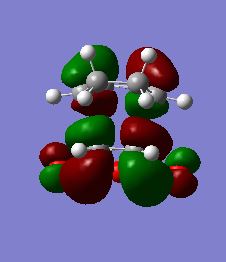
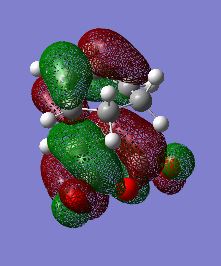
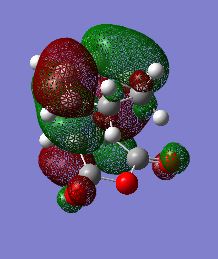
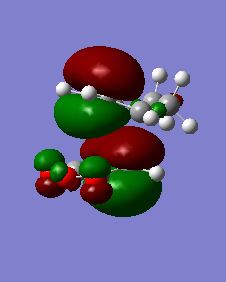
The HOMO/LUMO orbitals are presented here for the Endo Transition Structure (Figures 44/45/46/47) and Exo Transition Structure (Figures 48/49/50/51). These molecular orbitals may be qualitatively constructed by linear combination of the reactants frontier (valence) orbitals. It would be predicted from the discussion above that secondary orbital interactions would be evident between the carbonyl based orbitals and the sp2 carbon system of the 1,3-Cyclohexadiene in the HOMO of the Endo Transition Structure. However, there is no evidence for this observed in the HOMO of the Endo transition structure as might be predicted, giving somewhat of a misleading impression. Secondary orbital interaction must be present in order for Endo to be the kinetic product as we have proven previously, therefore the structure of the HOMO-1 was investigated and in this molecular orbital there is clearly a stabilising secondary orbital overlap as predicted. It is important to note at this point that the computational results may often be misleading in terms of their qualitative translation so in these cases it may often be more prudent to use qualitative MO theory to predict subtle behaviour such as this (Why would qualitative orbital theory provide a better description? Don't you expect you calculation to be more accurate? João (talk) 16:08, 21 April 2015 (BST)). However, while further analysis was required of occupied orbitals present below the HOMO, analysis of the HOMO-1 orbital of the Endo Transition State (Figures 52/53) clearly demonstrates an in-phase interaction between the relevant orbitals, explaining the secondary orbital interaction.
Fig 44: Optimised LUMO of Endo Transition State (Solid View)
Fig 45: Optimised LUMO of Endo Transition State (Mesh View)
Fig 46: Optimised HOMO of Endo Transition State (Solid View)
Fig 47: Optimised HOMO of Endo Transition State (Mesh View)
Fig 48: Optimised LUMO of Exo Transition State (Solid View)
Fig 49: Optimised LUMO of Exo Transition State (Mesh View)
Fig 50: Optimised HOMO of Exo Transition State (Solid View)
Fig 51: Optimised HOMO of Exo Transition State (Mesh View)
Fig 52: Optimised HOMO-1 of Endo Transition State (Solid View)
Fig 53: Optimised HOMO-1 of Endo Transition State (Mesh View)
Activation Energy Determination
The activation energy of the Diels-Alder cycloaddition between Maleic Anhydride and 1,3-Cyclohexadiene was calculated from the thermochemical data obtained in the previous frequency analysis and is presented in Table 11. This was completed at both the semi-empirical AM1 theory level and the B3LYP/6-31G* level of theory such that the results may be compared to both each other and then the literature. It is evident, as before, that the Endo transition state is marginally more stable than the Exo transition state, hence corresponding to the kinetic reaction pathway, however, under equilibrating thermodynamic conditions the more stable Exo product would still dominate. There is a marked discrepancy against the experimentally derived literature value of 11.4 kcal mol-1 [12], particularly in the AM1 calculation. Therefore it may be concluded that the B3LYP/6-31G* calculation is of much greater accuracy with respect to the literature, probably as a result of the decreased number of approximations/assumptions made within this method. Key issues within the AM1 methodology include the fact that it somewhat neglects the energetic barrier to rotation about a bond which exhibits some degree of double bond character. Further to this, there are a number of smaller inaccuracies in this methodology for example, Van der Waals and Hydrogen-bonding interactions are poorly accounted for and the stability of alkyl groups is consistently overestimated. The eventual result of this inaccuracy is observed in the thermochemical data obtained from frequency analysis and consequently the computationally derived activation energies presented in Table 11 below:
| Species | Sum of Electronic and Thermal Energies (AM1)(Hartree) | Activation Energy (AM1)(kcal mol-1) | Sum of Electronic and Thermal Energies (B3LYP/6-31G*)(Hartree) | Activation Energy (B3LYP/6-31G*)(kcal mol-1) | Literature Activation Energy (kcal mol-1) [12] |
| 1,3-Cyclohexadiene | 0.157031 | - | -233.288631 | - | 11.4 |
| Maleic Anhydride | -0.058192 | - | -379.228439 | - | 11.4 |
| Endo Transition State | 0.143683 | 28.139745 | -612.491811 | 15.849945 | 11.4 |
| Exo Transition State | 0.144881 | 28.891493 | -612.487636 | 18.469867 | 11.4 |
Table 11: Activation Energy Data for Endo/Exo Transition Structures
Conclusion
The objective of this exercise was to investigate the mechanistic details of the Cope Rearrangement of 1,5-Hexadiene in addition to two separate Diels-Alder reactions. This was achieved by application of the Gaussian programme mediated through Gaussview. Throughout the analysis calculations were performed to different theory levels so as to be compared and contrasted in the discussion above. There were often large discrepancies between the results, however, in general it may be concluded that the B3LYP/6-31G* (DFT) theory level/basis set produced the most accurate results in comparison to experimentally derived data. The computational analysis was applied to determine the location of both optimised reactants/products (energy minima) and optimised transition states (energy maxima) on the PES. In addition, the identification of true energy maxima and minima were confirmed via frequency analysis which yielded only positive frequencies and a single negative (imaginary) frequency respectively. Further evidence for the identification of a transition structure was provided by animating the imaginary frequencies in order to check that they truly do correlate to the transition state of the relevant reaction (Would it not be the other way around? The calculated reaction path matches you preconception of what the reaction should be? João (talk) 16:08, 21 April 2015 (BST)). Although the exercise largely met the outline objectives it was not without fault and these quantitative methods are not necessarily advantageous over qualitative methods under all situations. This was highlighted by the initial lack of evidence for secondary orbital overlap in the Diels-Alder reaction of Maleic Anhydride and Cyclohexa-1,3-diene which was analysed to the Austin Model 1 (AM1) level of theory. In contrast this phenomena is readily observed by the application of qualitative molecular orbital (MO) theory and it may therefore be concluded that under these conditions qualitative analysis is a more reliable means of investigating the reaction mechanism (Why should qualitative orbital theory be more reliable? Can't it be misleading? João (talk) 16:08, 21 April 2015 (BST)). However, in turn this does not translate to the quantitative computational predictions being of no use. We must simply appreciate that some aspects of chemical reactivity are not necessarily accounted for in computational calculations at this level of theory. In addition, it must be accepted that due to the significant degree of approximation within our calculations that the quantitative outcomes themselves are not reliable in comparison to the experimentally derived literature values. Despite this, it may be concluded that the computational analysis presented above has been largely successful and the results generally correlate with both the literature and the qualitative predictions which our chemical intuition has led to. The analysis could be extended to other Diels-Alder cycloaddition systems in future such as to observe more general trends in Diels-Alder reactivity. In addition, this may allow us to more accurately identify the theoretical issues in this analysis which occasionally neglect important factors.
References
[1] - F. Jensen, Introduction to Computational Chemistry, Wiley, Chichester, United Kingdom, 2, 2007
[2] - M. Bearpark, A. Simperler, Quantum Mechanics 3 (QM3) lecture course, Imperial College London, 2014
[3] - A. Cope, E. Hardy, J. Am. Chem. Soc, 1940, 62, 441
[4] - W. von Doering, V. Toscano, G. Beasley, Tetrahedron, 1971, 27, 5299
[5] - J. Binkley, J. Pople, W. Hehre, J. Am. Chem. Soc., 1980, 102, 939
[6] - B. Rocque, J. Gonzales, H. Schaeffer, Mol. Phys., 2002, 100, 441
[7] - B. Gung, Z. Zhu, R. Fouch, J. Am. Chem. Soc., 1995, 117, 1783
[8] - G. Schultz, I. Hargittai, J. Mol. Struct., 1995, 346, 63
[9] - R. Rowland, R. Taylor, J. Phys. Chem., 1996, 100, 7384
[10] - F. Allen, O. Kennard, D. Watson, L. Brammer, A. Orpen, R. Taylor, J. Chem. Soc. Perkin. Trans II, 1987, S1
[11] - D. Rowley, H. Steiner, Discuss. Faraday Soc. 1951, 10, 198
[12] - R. Grieger, C. Eckert, J. Am. Chem. Soc., 1970, 92, 7149
[13] - J. Clayden, N. Greeves, S. Warren, Organic Chemistry, OUP Oxford, 2, 2001
[14] - P. Atkins, J De Paula, Physical Chemistry, OUP Oxford, 9, 2010


