Rep:Mod:2GPINORG
Bonding and Molecular Orbitals in Main Group Compounds
Week 1
BH3 Optimization
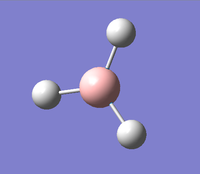
BH bond length set to 1.5A, 3-21G basis set optimization was run. File:Bh3 opt1.mol
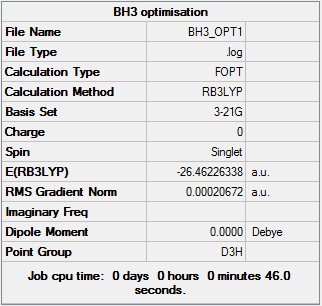
BH3 3-21G optimization summary table
The gradient is less than 0.001 showing that the optimization is complete. The optimization can be seen to have converged from the Item table shown below.
Text based .log file Item table 3-21G optimization
Item               Value     Threshold  Converged?
 Maximum Force            0.000413     0.000450     YES
 RMS     Force            0.000271     0.000300     YES
 Maximum Displacement     0.001610     0.001800     YES
 RMS     Displacement     0.001054     0.001200     YES
 Predicted change in Energy=-1.071764D-06
 Optimization completed.
    -- Stationary point found.
Force and displacement have converged showing that the optimization was successful as the energy has reached a turning point and therefore must be minimal.
Optimized bond distances and bond angles
| optimised B-H bond distance | 1.19 A |
| H-B-H Bond Angle | 120.0o |
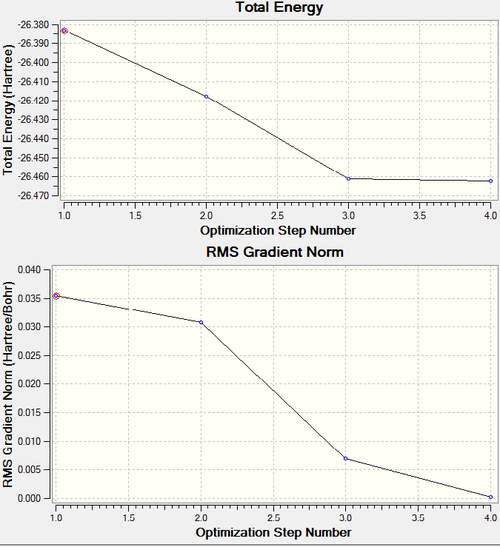
Optimization Plots of Energy and the Gradient of the Energy (-Force)
The optimization plot shows the gradient decreasing as the energy decreases, reaching 0 when the molecule is optimized. The gradient of the Energy plot shows the force on the molecule. When the gradient is 0 there is no net force on the molecule and it is therefore in equilibrium.
BH3 higher level basis set: 6-31G(d,p)
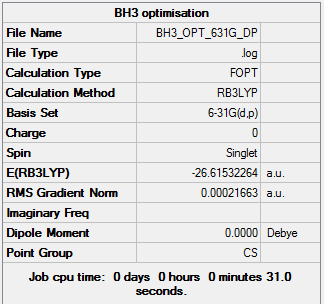
BH3 6-31G(d,p) optimization summary table
Text based .log file Item table 6-31G(d,p) optimization
 Item               Value     Threshold  Converged?
 Maximum Force            0.000434     0.000450     YES
 RMS     Force            0.000284     0.000300     YES
 Maximum Displacement     0.001698     0.001800     YES
 RMS     Displacement     0.001114     0.001200     YES
 Predicted change in Energy=-1.188111D-06
 Optimization completed.
    -- Stationary point found.
Optimized bond distances and bond angles
| optimised B-H bond distance | 1.19 A |
| H-B-H Bond Angle | 120.0o |
Total Energies of optimizations
| 3-21G | -26.46226338 au |
| 6-31G(d,p) | -26.61532264 au |
The energy results for the 3-21G and 6-31G(d,p) optimizations have slightly different values as different basis sets where used and therefore there will be differences in the resulting energy calculations and product values.
[TlBr3 optimization link to D space]
TlBr3 Optimization
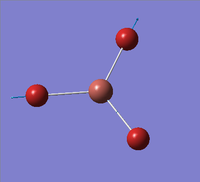
Pseudo-potenials were used for this calculation to model the core electrons as Tl and Br are both heavy atoms with 81 and 35 electrons respectively. The LanL2DZ option for the calculation was chosen this uses a D95V basis set on the first row atoms and a Los Alamos ECP pseudo potential on the heavier elements. The calculation was run through the scan HPC service. File:TlBr3 opt LanL2DZ.mol
The symmetry of TlBr3 molecule was set very tightly to D2h to avoid problems with the MO's generated.
TlBr3 LanL2DZ optimization summary table
Text based .log file Item table LanL2DZ optimization
Item               Value     Threshold  Converged?
 Maximum Force            0.000002     0.000450     YES
 RMS     Force            0.000001     0.000300     YES
 Maximum Displacement     0.000022     0.001800     YES
 RMS     Displacement     0.000014     0.001200     YES
 Predicted change in Energy=-6.084074D-11
 Optimization completed.
    -- Stationary point found.
Optimized bond distances and bond angles
| optimised Tl-Br bond distance | 2.65 A |
| Br-Tl-Br Bond Angle | 120.0o |
These values are close to the values found in literature for the actual bond angle and distance of 2.55 and 120o therefore we can have high confidence in the accuracy of our calculations. [1]
BBr3 Optimization
BBr3 GEN optimization summary table
BBr3 contains both light and heavy atoms so a mixture of both a full basis set and a mix psuedo-potential needs to be used.
Text based .log file Item table GEN optimization
         Item               Value     Threshold  Converged?
 Maximum Force            0.000008     0.000450     YES
 RMS     Force            0.000005     0.000300     YES
 Maximum Displacement     0.000037     0.001800     YES
 RMS     Displacement     0.000024     0.001200     YES
 Predicted change in Energy=-4.109337D-10
 Optimization completed.
    -- Stationary point found.
Optimized bond distances and bond angles
| optimised B-Br bond distance | 1.93 A |
| Br-B-Br Bond Angle | 120.0o |
Comparison
| optimised B-H bond distance | 1.19 A |
| optimised B-Br bond distance | 1.93 A |
| optimised Tl-Br bond distance | 2.65 A |
The bond length increases as the ligand is changed from hydrogen to bromine. Hydrogen is a small atom and therefore it is expected for the bond length to be short as the combind nuclear radii are small. The hydrogen atoms form strong bonds with the boron as they have similar values of electronegativity (H = 2.20 and B = 2.04 on the pauling electronegativity scale
[2])therefore will have a strong unpolaried bond and there is good orbital overlap between the 2s, 2p orbitals of the born and the 1s orbitals of the hydrogen.
The B-Br bond is longer as bromine is a much bigger atom than hydrogen and will therefore have more diffuse valence orbitals, there is not such a strong overlap between the bromine orbitals and the boron orbitals leading to a weaker bond and therefore a longer bond distance. There is also a greater electronegativity difference between the bromine and the boron also leading to a more polarized weaker bond (Br = 2.96 B = 2.04 on the pauling electronegativity scale)
Both bromine and hydrogen donate 1 electron to the B-ligand bond, however the hydrogen donates an electron from an 1S orbital and the bromine from a 3p orbital.
When changing the central metal atom from Boron to Thallium there is a large increase in bond length of 0.72 A. B and Tl are similar as they are both in group 3 and therefore have the same valance with ligands however Tl is at the bottom of the group and is therefore much large and its valence orbitals are much more diffuse. Therefore the bonds between the the Tl and the Br ligand are much weaker than the B-Br bonds and therefore the Tl-Br bond has a greater bond distance.
A bond in MO theory is defined as an area of high electron density between atoms. In the Gaussian computational program the presence of a "bond" is set at a particular value of electron density therefore if the electron density is below this value gaussview will not draw a bond.
Frequency Analysis
BH3 frequency calculations
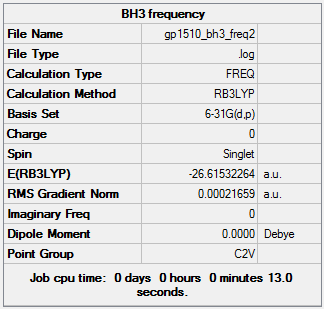
BH3 6-31G(d,p) frequency summary table
The frequency is the second order derivative of the potential energy surface. A frequency calculation is carried out to confirm that the turning point found by the optimization calculation is a minimum and not a transition state turning point (maximum). If all the frequencies are positive this shows that a minimum has been found.
The frequency calculation was carried out using the same method and basis set as the optimization calculations. As calculations performed under different conditions can not be compared directly with those calculated using a different basis set or under different conditions. The value for the energy was the same as that calculated for the optimization showing the calculation worked correctly and the result for the frequency calculation is comparable and reliable.
Frequency information from read out file
Low frequencies --- -73.0837 -69.5094 -69.4394 -0.0007 -0.0003 0.0005 Low frequencies --- 1161.3810 1212.0964 1212.1646
The first line of frequencies show the motions of the center of mass of the molecule and are much small then the vibrations listed in the table below. These should be as close to zero as possible and ideally +/- 15cm-1 mine are larger suggesting it may be better to use a more accurate basis set for this calculation. The second line shows the vibration frequencies of the molecule, these are all postive, showing the program has correctly minimised the energy of the molecule.
BH3 6-31G(d,p) IR spectrum
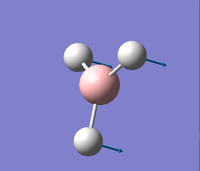
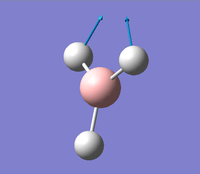
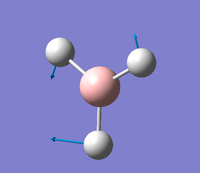
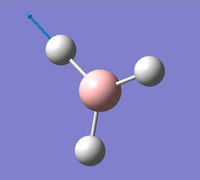
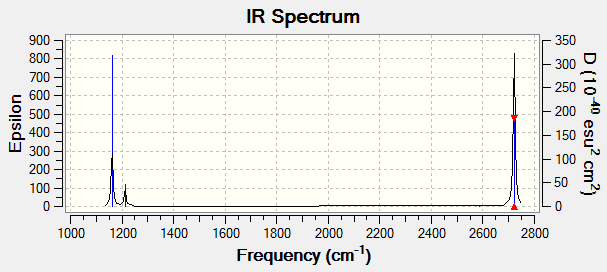
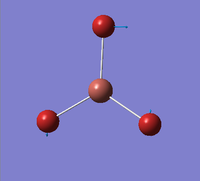
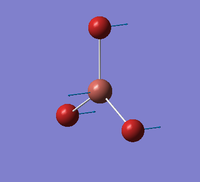
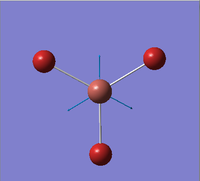
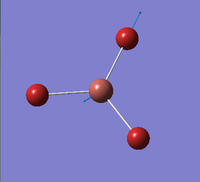
There are only 3 peaks in the spectrum as 2 sets of vibrational modes are degenerate. The scissoring and rocking vibrations are degenerate with the same stretching frequency of 1212 cm-1 so therefore will only show a 1 peak. This is also true for the 2 asymmetric stretches which both have a stretching frequency of 2731 cm-1 The A'1 stretch does not appear either as it has no overall dipole moment which is needed for a stretch to be visualized on an IR spectrum.
TlBr3 Frequency calculations
[TlBr3 frequency link to D space]
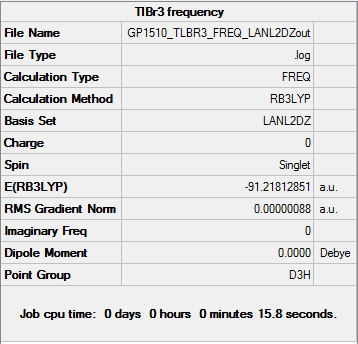
TlBr3 Frequency summary table
Frequency information from read out file
Low frequencies ---   -3.4213   -0.0026   -0.0004    0.0015    3.9367    3.9367
Low frequencies ---   46.4289   46.4292   52.1449
The top low frequencies line shows minimal center of mass motion showing the calculation has a good degree of accuracy. The vibrational frequencies of the molecule are all positive showing the molecule is optimized to minimum energy.
What is the lowest "real" normal mode?
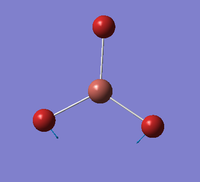
The lowest real mode is the E' symmetry scissoring and rocking modes.
TlBr3 LanL2DZ IR spectrum
| No. | BH3 frequency | TlBr3 frequency | |
|---|---|---|---|
| 1 | 1161.38 | 46.43 | |
| 2 | 1212.10 | 46.43 | |
| 3 | 1212.16 | 52.14 | |
| 4 | 2587.81 | 1265.27 | |
| 5 | 2721.51 | 210.69 | |
| 6 | 2721.52 | 210.69 |
BH3 and TlBr3 frequency comparison The TlBr3 frequencies are much lower than the BH3 frequencies, this is expected as we saw from the optimization calculation and explained above that the TlBr3 bonds are much longer and therefore much weaker than the BH3 bonds so will vibrate at a lower frequency. There has been a reordering of the modes, for BH3 the lowest mode is the wagging mode with A2" symmetry and for TlBr3 the degenerate E' modes is the lowest mode. Both molecules have 6 modes with only 3 peaks visible as both spectra contain 2 sets of degenerate modes and one totally symmetric mode with no net dipole moment. Both spectra contain 2 lower down peaks close together, which are less well defined in the TlBr3 spectrum and overlap and one peak higher up in frequency. The reason that the the A2 and E' modes are close and the 0 intensity A1' modes are close are that the lower frequencies correspond to bending modes and the higher set of frequencies correspond to stretching modes.
BH3 Population calculation
[BH3 population link to D space]
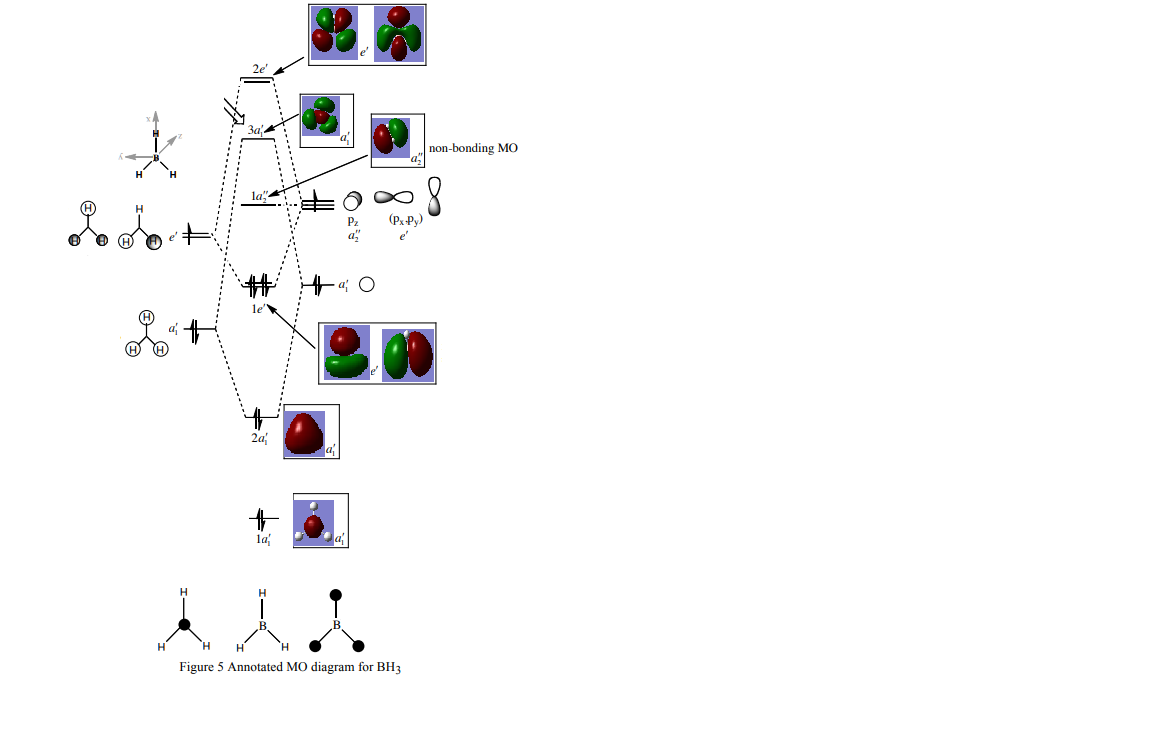
BH3 Mo diagram
Above is shown the MO diagram for BH3, showing the rationalized LCAO and the computationally calculated MO's. The lowest computationally calculated orbital shows the core s1 orbital of the boron which is occupied but too low in energy to bond. There is good similarity between the rationalized LCAO orbitals and the computationally generated orbitals. The computationally generated orbitals show more delocalization over the entire molecule than the drawn MO's. This shows us that qualitative MO theory has high enough accuracy to help reliably rationalise molecular bonding and fits closely with information generated by high power calculation, making MO theory an extremely useful qualitative tool in everyday chemistry.
NH3 Optimization
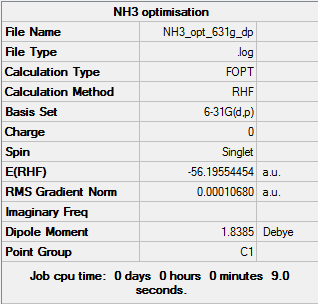
NH3 opt 6-31g,dp optimization summary table
Text based .log file Item table 6-31g,dp optimization
  Item               Value     Threshold  Converged?
 Maximum Force            0.000200     0.000450     YES
 RMS     Force            0.000124     0.000300     YES
 Maximum Displacement     0.000386     0.001800     YES
 RMS     Displacement     0.000261     0.001200     YES
 Predicted change in Energy=-1.088496D-07
 Optimization completed.
    -- Stationary point found.
The optimization has converged finding a stationary point meaning the molecule is at equilibrium at this point and its energy is minimized.
NH3 6-31G(d,p) frequency file
NH3 6-31G(d,p) frequency low frequency data
Low frequencies --- -52.9604 -51.3600 -49.1507 -0.0021 -0.0010 0.0001
Low frequencies --- 1141.4481 1810.4328 1810.6382
The top line of low frequency values are all relatively small compared to the vibrations, showing the calculation is accurate to a reasonable degree. The bottom line of low frequencies are all positive confirming that the energy of the molecule is minimized.
NH3 6-31G(d,p) population file and d space link
File:NH3 OPT 631G DP popout.mol
[population calculation link to d space]
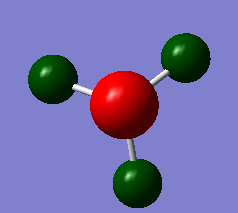
NH3 charge distribution
The charge limits were set to +/- 1.0. The charge on nitrogen is -0.792 and 0.264 on each nitrogen giving an overall neutral molecule. The different colours of the molecule are related to the charge of the molecule, the nitrogen is bright red as it is strongly negative, this is expected as it is a strongly electronegative atom and will be strongly electron withdrawing with respect to the hydrogen atoms, its value of the pauling electronegativity scale is 3.04 where as hydrogens value is 2.20. The hydrogens are a deeper green colour as the lack of electron density corresponding to the density pulled way by the nitrogen is spread out over all three atoms.
NH3BH3 Optimization
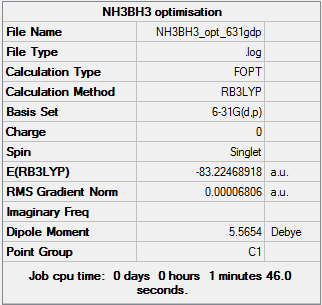
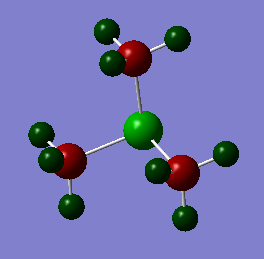
The optimization was completed with the B3LYP Method and 6-31G (d,p) basis set.
NH3BH3 6-31G (d,p) optimization summary table
NH3BH3 Optimization Item table
 Item               Value     Threshold  Converged?
 Maximum Force            0.000137     0.000450     YES
 RMS     Force            0.000063     0.000300     YES
 Maximum Displacement     0.000606     0.001800     YES
 RMS     Displacement     0.000336     0.001200     YES
 Predicted change in Energy=-1.994008D-07
 Optimization completed.
    -- Stationary point found.
The optimization has converged showing a minimum has been reached.
NH3BH3 frequency analysis
Low frequencies --- 0.0004 0.0010 0.0010 16.8840 22.3851 37.6650 Low frequencies --- 265.6917 632.3732 639.0570
All the vibrational frequencies are positive confirming the energy has been minimized.
File:NH3BH3 OPT 631GDP FREQ.mol E(NH3)= -26.61532264 E(BH3)= -56.19554454 E(NH3BH3)= -83.22468918
ΔE=E(NH3BH3)-[E(NH3)+E(BH3)] = -0.413822 1 AU = 2625.5 ΔE = -1086.489611 kJ/mol
This value is much higher than the value found in literature of 130KJ/mol suggesting that there is some issue with my calculation. The energy for the BH3 optimization is slightly higher than the value achieved by some of my peers and when the few decimal places difference in au is converted to kJ/mol this makes a large difference to the overall energy change. Ideally if more time was available this optimization would have been repeated.
Mini Project
Optimization and frequency analysis of cations
The 6-31G(d,p) is used on all atoms.
[N(CH3)4]+
[[N(CH3)4+ optimization and frequency calculation link to d space]]
 Item               Value     Threshold  Converged?
 Maximum Force            0.000073     0.000450     YES
 RMS     Force            0.000013     0.000300     YES
 Maximum Displacement     0.000931     0.001800     YES
 RMS     Displacement     0.000270     0.001200     YES
 Predicted change in Energy=-4.574561D-08
 Optimization completed.
    -- Stationary point found.
Low frequencies --- -14.5641 -4.7103 -0.0013 -0.0012 -0.0011 8.5132
Low frequencies --- 179.4507 278.5482 285.5376
The optimization converged and the vibrational frequencies are all positive therefore a minimum energy has been found.
[[File:[N(CH3)4]_opt_freqsummary.png]]
[P(CH3)4]+
[[P(CH3)4+ optimization and frequency calculation link to d space]]
Item               Value     Threshold  Converged?
 Maximum Force            0.000148     0.000450     YES
 RMS     Force            0.000025     0.000300     YES
 Maximum Displacement     0.000910     0.001800     YES
 RMS     Displacement     0.000255     0.001200     YES
 Predicted change in Energy=-1.143566D-07
 Optimization completed.
    -- Stationary point found.
Low frequencies --- -19.7856 -8.2311 -0.0018 0.0019 0.0027 11.9019
Low frequencies --- 152.0098 181.9606 189.7672
The optimization converged and the vibrational frequencies are all positive therefore a minimum energy has been found.
[[File:[P(CH3)4]_opt_freqsummary.png]]
[S(CH3)3]+
[[S(CH3)4+ optimization and frequency calculation link to d space]]
 Item               Value     Threshold  Converged?
 Maximum Force            0.000040     0.000450     YES
 RMS     Force            0.000009     0.000300     YES
 Maximum Displacement     0.000517     0.001800     YES
 RMS     Displacement     0.000151     0.001200     YES
 Predicted change in Energy=-1.253809D-08
 Optimization completed.
    -- Stationary point found.
Low frequencies --- -13.2044 -9.8805 0.0043 0.0044 0.0044 22.9244
Low frequencies --- 158.5055 194.1006 198.5320
The optimization converged and the vibrational frequencies are all positive therefore a minimum energy has been found.
[[File:[S(CH3)3]_opt_freqsummary.png]]
The [N(CH3)4]+ and [P(CH3)4]+ both have tetrahedral geometries. [N(CH3)4]+ has a bond angle of 109.5o which fits with this geometry. The [P(CH3)4]+ cation has a C-P-C bond angle of 109.4o which also fits a tetrahedral geometry. [S(CH3)3]+ has only 3 groups as it is a group 6 element as aposed to group 5, it has a trigonal pyramidal geometry with bond angles of 102.7o Sulphur also has a lone pair which is not involved in bonding which accounts to the near to tetrahedral C-S-C bond angle. The angle is slightly smaller than a normal tetrahedral angle as the lone pair takes up more space than bonded group normally would.
Cation MO and NBO population analysis
[N(CH3)4]+
[[N(CH3)4+ population calculation link to d space]]
[P(CH3)4]+
[[P(CH3)4+ population calculation link to d space]]
[S(CH3)3]+
[[P(CH3)4+ population calculation link to d space]]
| Molecule. | Charge distribution | C-X bond length | |
|---|---|---|---|
| N(CH3)4+ | N = -0.397 C = -0.488 H = 0.217 | 1.51 A | |
| P(CH3)4+ | P = 0.729 C = -0.511 H = 0.193 | 1.82 A | |
| S(CH3)3+ | S = 0.557 C = -0.488 H = 0.217 | 1.82 A |
The nitrogen atom in the molecule is still negatively charged although the molecule as a whole is positively charged, this can be accounted for by its high polarizing ability due to its large electronegativity however, it is less negative than carbon which is unexpected as it has a higher value of 3.04 (reference) compared to carbons 2.55 on the pauling electronegative scale. This can be accounted for by the positive charge of the molecule. This information is also shows that the representation of [NR4]+ with a positive charge on the nitrogen is not accurate as the data clearly shows that there is no positive charge on the nitrogen, on the contrary it is negatively charged, the positive charge is delocalised over the entire molecule.
In contrast to the [N(CH3)4]+ molecule the [P(CH3)4]+ has a positive charge of 0.729 on the phosphorus. This can be explained by the fact phosphorus is further down the pauling electronegativity scale with a value of 2.19 which is now lower than carbon and therefore its electron density is withdrawn by the bonded carbon atoms. Therefore there is a formal positive charge on the phosphorus atom
[S(CH3)3]+ the central atom is also positively charged, sulphur has a similar electronegativity to carbon (2.58 compared to 2.55) so would normally be expected to have a relatively unpolarized bond and have a similar charge, this is not the case however due to the positive charge on the sulfur.
C-X bond contribution
N(CH3)4+ ( 33.65%) 0.5801* C 1 s( 20.77%)p 3.81( 79.07%)d 0.01( 0.16% ( 66.35%) 0.8146* N 17 s( 24.99%)p 3.00( 74.98%)d 0.00( 0.03%)
P(CH3)4+ ( 59.57%) 0.7718* C 9 s( 25.24%)p 2.96( 74.68%)d 0.00( 0.08%) ( 40.43%) 0.6358* P 17 s( 25.00%)p 2.97( 74.15%)d 0.03( 0.85%)
S(CH3)3+ ( 51.33%) 0.7165* C 9 s( 19.70%)p 4.07( 80.16%)d 0.01( 0.14%) ( 48.67%) -0.6976* S 13 s( 16.95%)p 4.86( 82.42%)d 0.04( 0.63%)
Nitrogen is a very electronegative element therefore will pull most of the electron density towards it, this is show by the fact that it makes up a higher percentage of the bond, the nitrogen and the carbon atoms can also be seen to be sp3 hybridized from the data collected above. Phosphorus (2.19 pauling electronegativity) is less electronegative then carbon (2.55 pauling electronegativity) therefore carbon is able to pull more electrondensity towards it and contributes more to the bond. the P and C atoms are sp3 hybridized. The Sulfur atom has similar electronegativity to carbon (2.58 compared to carbons 2.55) therefore the contribution to the bond of both atoms is relatively equal, sulphurs is slightly higher as it is slightly more electronegative. The S(CH3)3+ molecule is sp2 hybridized.
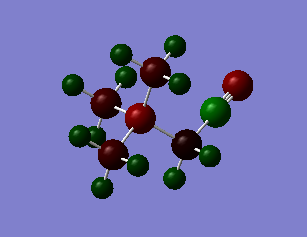
[N(CH3)3(CH2OH)]+
[[N(CH3)3(CH2OH)+ optimization and frequency calculation link to d space]]
[[N(CH3)3(CH2CN)+ population calculation link to d space]]
Item               Value     Threshold  Converged?
 Maximum Force            0.000012     0.000450     YES
 RMS     Force            0.000003     0.000300     YES
 Maximum Displacement     0.000441     0.001800     YES
 RMS     Displacement     0.000078     0.001200     YES
 Predicted change in Energy=-4.580859D-09
 Optimization completed.
    -- Stationary point found.
Low frequencies --- -118.8708   -8.6052   -0.0005   -0.0002    0.0008   15.8701
Low frequencies ---   17.9104  131.1190  219.5428
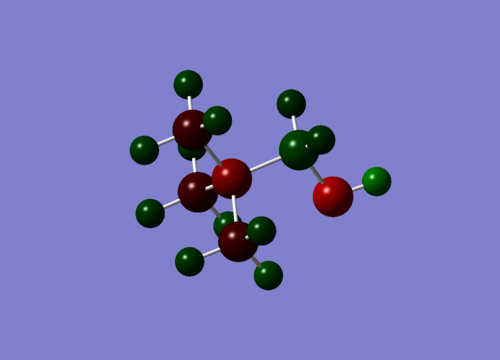
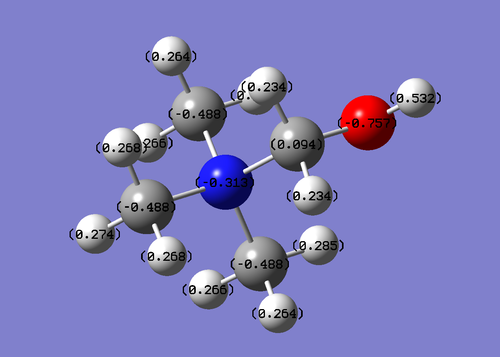
Charges Central N= -0.3 CH3 groups = C = -0.5 H = 0.3 CH2 group = C = 0.01 H = 0.2 OH group O = -0.8 H = 0.5
The OH group on the molecule can be both electron withdrawing and donating which means that is overall electron withdrawing effect on the molecule is not as strong as with the CN functional group (see below) The nitrogen molecule has a lower negative charge than for the [N(CH3)4]+ molecule. there is also a withdraing effect on the carbon of the CH2 group the OH group is attached to. The terminal hydrogen of the OH group is also alot more positively charged than the Hydrogens of the CH3 groups.
[N(CH3)3(CH2CN)]+
[[N(CH3)3(CH2CN)+ optimization and frequency calculation link to d space]]
[[N(CH3)3(CH2CN)+ population calculation link to d space]]
        Item               Value     Threshold  Converged?
Maximum Force            0.000028     0.000450     YES
RMS     Force            0.000007     0.000300     YES
Maximum Displacement     0.000585     0.001800     YES
RMS     Displacement     0.000158     0.001200     YES
Predicted change in Energy=-1.468510D-08
Optimization completed.
   -- Stationary point found.
Low frequencies ---  -15.5309    0.0008    0.0008    0.0010    2.3140    6.8161
Low frequencies ---   91.1133  154.0516  212.7036
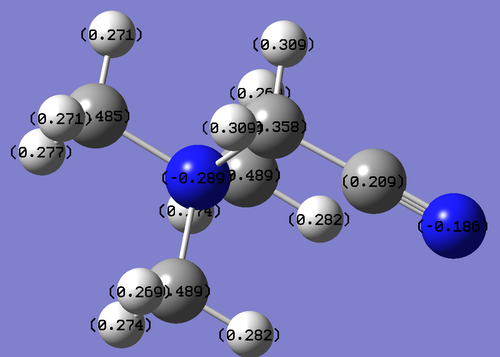
Central N = -0.3 CH3 groups C = -0.5 H =0.3 CH2 group C = -0.4 H=0.3 CN group C = 0.2 N = -0.1
the CN group is electron withdrawing central nitrogen has a lower negative charge of -0.289 than for the [N(CH3)4]+ molecule and N(CH3)3(CH2OH)+ molecule due to the CN groups strong withdrawing nature by induction due to the electronegative nitrogen which can then not donate electron density back into the system. Electron density is also withdrawn from the CH2 group adjacent to the CN group.
| Molecule | HOMO | HOMO Energy | LUMO | LUMO Energy |
|---|---|---|---|---|
| [N(CH3)4]+ |  |
-0.57929 |  |
-0.13302 |
| [N(CH3)3(CH2OH)]+ | 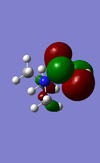 |
-0.46628 |  |
- 0.11995 |
| [N(CH3)3(CH2CN)]+ | 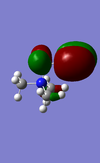 |
-0.50047 | 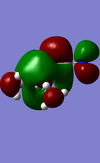 |
-0.18184 |
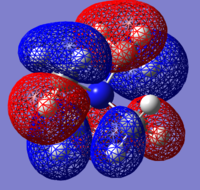
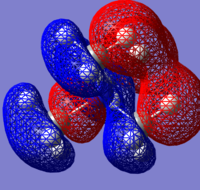
There are differences between the energies of the HOMO's and the LUMO's for the different molecules the OH molecule has the lowest energy HOMO and LUMO followed by the molecule with the CN functional group and with the highest energy molecule being the |[N(CH3)4]+ molecule. The HOMO's have moved from being spread out over the entirety of the molecule to being localised on the CN and OH functional groups. The chemical impact is that the lower energy MO's of the OH and CN functional group containing molecules will allow these orbitals to be filled more easily and therefore make them more susceptible to reaction.
- ↑ M. Atanasov, D. Reinen, J. Phys. Chem. A, 2001, 105 (22), 5450-5467 http://pubs.acs.org/doi/abs/10.1021/jp004511j.
- ↑ Atkins.P.W Shriver. Von.DF Inorganic Chemistry Oxford University Press 5th Edition 2009.

