Rep:Mod:29hb301704
BH3
Method : B3YLP
Basis set : 6-31G
         Item               Value     Threshold  Converged?
 Maximum Force            0.000015     0.000450     YES
 RMS     Force            0.000010     0.000300     YES
 Maximum Displacement     0.000058     0.001800     YES
 RMS     Displacement     0.000038     0.001200     YES
The link to the BH3 frequency file: BH3 frequency file.
 Low frequencies ---  -10.3498   -3.4492   -1.2454   -0.0055    0.4779    3.2165
 Low frequencies --- 1162.9519 1213.1527 1213.1554
Optimised BH3 molecule |
Infra-red Spectrum
| wavenumber (cm-1 | Intensity (arbitrary units) | symmetry | IR active? | type |
| 1163 | 93 | a2 | yes | out-of-plane bend |
| 1213 | 14 | e' | yes (weak) | bend |
| 1213 | 14 | e' | yes (weak) | bend |
| 2582 | 0 | a1' | no | symmetric stretch |
| 2716 | 126 | e' | yes | asymmetric stretch |
| 2716 | 126 | e' | yes | asymmetric stretch |
It can be seen from the IR spectrum above that there are only three peaks visible on the spectrum despite there being six different vibrational modes for BH3. One reason for this is because some of the vibrations occur at the occur at the same frequency. At 1213cm-1 there are actually two bending modes contributing to the peak and at 2716cm-1 there are two asymmetrical stretching modes at the same position. The result of this is that there are only two peaks visible for four different modes of vibration. Also, the symmetric stretch at 2582cm-1 does not appear on the IR spectrum because the mode is not IR active. This is because there is no change in dipole during the vibration.
Ng611 (talk) 14:30, 27 May 2019 (BST) Good!
MO Diagram for BH3
Below the MO diagram for BH3 can be seen. On this diagram there are two representations of the molecular orbitals: one is from the LCAO and the others are the 'real' MOs generated using Gaussian.
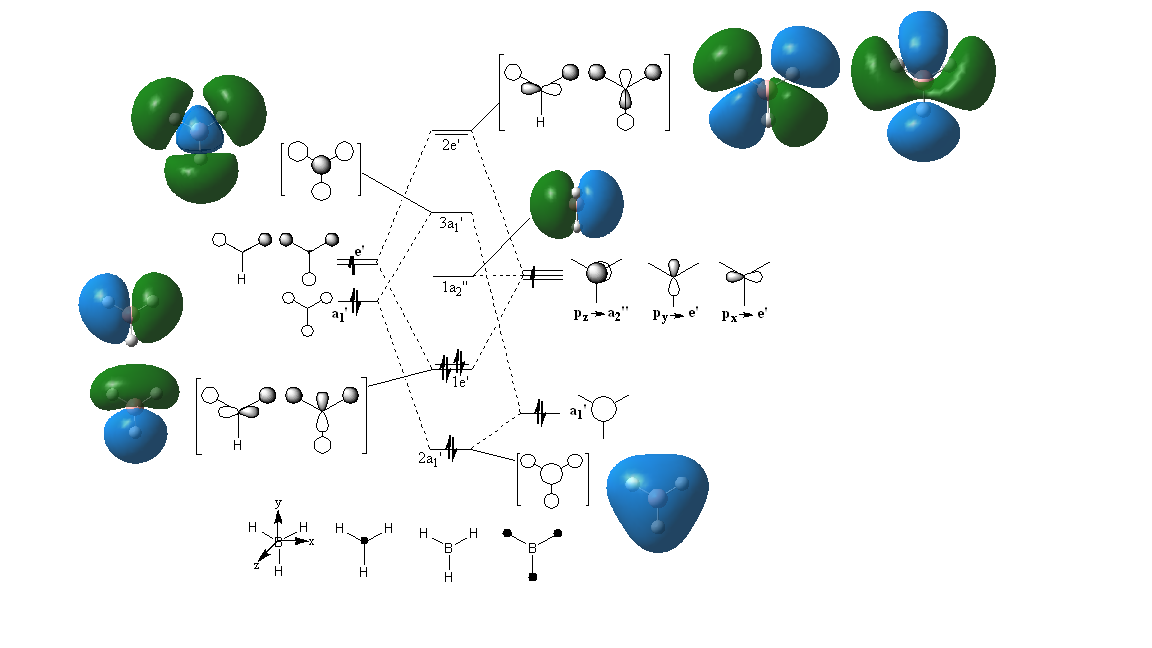
Are there any significant differences between the real and LCAO MOs?
In terms of the differences between the 'real' MOs and the LCAO MOs, there are no very significant differences. For LCAO the areas of electron density are not merged together to form single areas of electron density and the original orbitals involved in the formation of the MO can still be seen. On the other hand, the original orbitals cannot be seen in the 'real' MOs because they fully combine and cancel out to form a molecular orbital that is the correct shape and corresponds to how the areas of electron density in the molecule actually look. Despite this, there is a definite similarity between the 'real' and LCAO MOs and it is very easy to tell which real MO corresponds to which LCAO MO, even though the LCAO MO does not give the true shape of the MO.
Ng611 (talk) 14:31, 27 May 2019 (BST) You're correct, although this is not the most significant difference between them.
The LCAO approach to molecular orbitals, using an MO diagram, shows which orbitals are filled and which are bonding, non-bonding or anti-bonding. However, using the 'real' MO diagram does not give a good indication of what is bonding or antibonding and which molecular orbitals correspond to a bonding/antibonding pair.
What does this say about the accuracy and usefulness of qualitative MO theory?
Qualitative MO theory using LCAO is useful for finding out which atomic orbitals contribute the the final molecular orbital and is also good for knowing which atoms most of the electron density lies on. LCAO is also useful for determining which MOs are bonding/ antibonding/non-bonding which you cannot tell from the 'real' MOs. However, LCAO is not accurate in terms of getting the correct shape for the molecular orbitals.
Association Energies: Ammonia-Borane
Ammonia-Borane, NH3BH3, is an acid-base complex can be made in the following reaction:
NH3 + BH3 → NH3BH3
The reaction energy for this process can be found by looking at the energies of the species involved in the reaction.
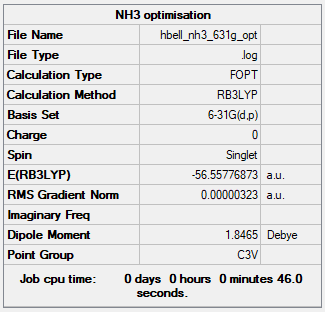
NH3
Method : B3YLP
Basis set : 6-31G
         Item               Value     Threshold  Converged?
 Maximum Force            0.000006     0.000450     YES
 RMS     Force            0.000004     0.000300     YES
 Maximum Displacement     0.000012     0.001800     YES
 RMS     Displacement     0.000008     0.001200     YES
The link to the NH3 frequency file: NH3 frequency file
Low frequencies ---   -8.5646   -8.5588   -0.0047    0.0454    0.1784   26.4183
 Low frequencies --- 1089.7603 1694.1865 1694.1865
Optimised NH3 molecule |
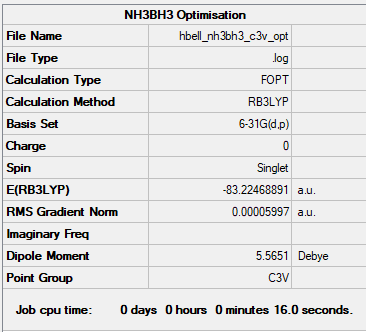
NH3BH3
Method : B3YLP Basis set : 6-31G
         Item               Value     Threshold  Converged?
 Maximum Force            0.000122     0.000450     YES
 RMS     Force            0.000058     0.000300     YES
 Maximum Displacement     0.000531     0.001800     YES
 RMS     Displacement     0.000296     0.001200     YES
The link to the NH3BH3 frequency file: NH3BH3 frequency file
V
Low frequencies ---   -0.0616   -0.0457   -0.0067   21.6898   21.6957   40.5827
 Low frequencies ---  266.0232  632.3610  640.1384
Optimised NH3BH3 molecule |
Association Energy
E(NH3)=-56.55777 a.u.
E(BH3)= -26.61532 a.u.
E(NH3BH3)= -83.22469 a.u.
ΔE=E(NH3BH3)-[E(NH3)+E(BH3)] = -83.22469 - [-56.55777 + (-26.61532)]= -0.0516 a.u.
In kJmol-1, ΔE = -135 kJmol-1
The N-B dative bond strength is 135kJmol-1. This bond can be considered a weak covalent bond. This conclusion has been reached by comparing the strength of this bond to the strength of other bonds. For example, a C-I bond (which readily breaks for SN1 substitution has a bond energy of 213kJmol-1, which is significantly stronger than the B-N bond. 1
Ng611 (talk) 14:34, 27 May 2019 (BST) Good calculation. I'm a little dubious about the rationale for your comparison though-- a bond that's isoelectronic would have been better. Also remember to use a book source for your bond energy where possible.
NI3
Method: B3LYP
Basis Set: 6-31G(d,p)LANL2DZ
         Item               Value     Threshold  Converged?
 Maximum Force            0.000068     0.000450     YES
 RMS     Force            0.000044     0.000300     YES
 Maximum Displacement     0.000493     0.001800     YES
 RMS     Displacement     0.000333     0.001200     YES
The link the frequency file for NI3 is here: NI3 frequency file.
Low frequencies ---  -12.7477  -12.7416   -6.4258   -0.0140    0.0210    0.0991
 Low frequencies ---  101.0290  101.0295  147.4197
Optimised NI3 molecule |
The optimised bond length for this molecule is 2.184Å.
Ng611 (talk) 14:34, 27 May 2019 (BST) Good calculation!
Lewis Acids and Bases
In the diagram below, the five different isomers of Al2Cl4Br2 can be seen along with their point groups.
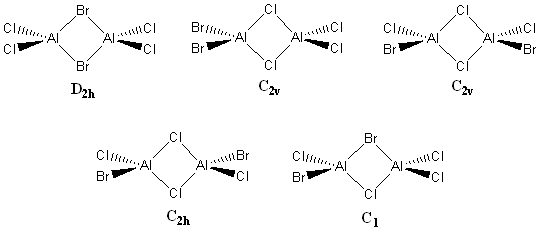
(a) 2 bridging Br ions isomer
Method: B3LYP
Basis Set: 6-31G(d,p)LANL2DZ
         Item               Value     Threshold  Converged?
 Maximum Force            0.000008     0.000450     YES
 RMS     Force            0.000003     0.000300     YES
 Maximum Displacement     0.000064     0.001800     YES
 RMS     Displacement     0.000031     0.001200     YES
Optimised Al2Cl4Br2 molecule |
The link the the frequency file for this isomer is here : Al2Cl4Br2 frequency file.
Low frequencies ---   -5.1323   -4.9635   -3.1644    0.0034    0.0038    0.0049
 Low frequencies ---   14.8508   63.2858   86.0867
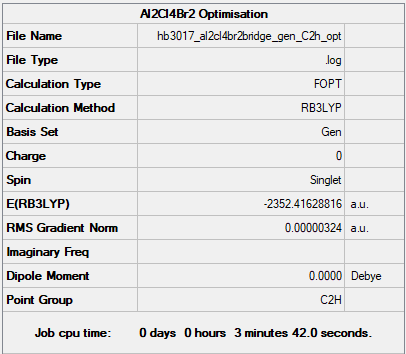
(b) the isomer with trans terminal Br and bridging Cl ions
Method: B3LYP
Basis Set: 6-31G(d,p)LANL2DZ
         Item               Value     Threshold  Converged?
 Maximum Force            0.000004     0.000450     YES
 RMS     Force            0.000002     0.000300     YES
 Maximum Displacement     0.000047     0.001800     YES
 RMS     Displacement     0.000020     0.001200     YES
The frequency file for this molecule can be found here: Al2Cl4Br2 frequency file.
 Low frequencies ---   -4.2803   -2.4949    0.0024    0.0029    0.0034    0.9580
 Low frequencies ---   17.7193   48.9824   72.9517
Optimised Al2Cl4Br2 molecule |
Relative energy of these isomers
E(Al2Cl4Br2(D2h)) = -2352.40631 a.u.
E(Al2Cl4Br2(C2h)) = -2352.41629 a.u.
ΔE = |E(Al2Cl4Br2(D2h))-E(Al2Cl4Br2(C2h))| = 0.00998 a.u.
ΔE(kJmol-1) = 26 kJmol-1
The isomer bridged with the Cl ions is 26kJmol-1 lower in energy than the isomer bridged by the Br ions. The reason for this is due to the extent to which the bridged ions orbitals overlap with the orbitals on the Al. Chlorine and aluminium are in the same row of the periodic table, so they have similarly sized valence orbitals. This means their orbitals are able to overlap well, resulting in a strong bonding interaction between the atoms and short, strong bonds. On the other hand, the orbitals on bromine are larger and more diffuse than those on Al, meaning their energies are mismatched and they do not overlap very well, leading to a weaker bonding overlap and longer, weaker bonds. The stronger bonds with the Cl are able to stabilise the molecule to a greater extent than the weak bromine bonds. Also, the bromine cannot alleviate the electron deficiency of the Al as well as the chlorine, destabilising the molecule with bridging bromine atoms relative to that with bridging chlorine atoms.
Ng611 (talk) 14:44, 27 May 2019 (BST) Good discussion! Perhaps a diagram would help your explanation. Nevertheless, excellent.
The dissociation energy of the lowest energy conformer into 2AlCl2Br
The Al2Cl4Br2 isomer with the two bridging chlorine ions and the terminal trans Br ions can dissociate into AlCl2Br, as shown in the equation below.
Al2Cl4Br2 → 2AlCl2Br
The dissociation energy of this process can be found by comparing the energy of the dimer to the energy of two AlCl2Br molecules.
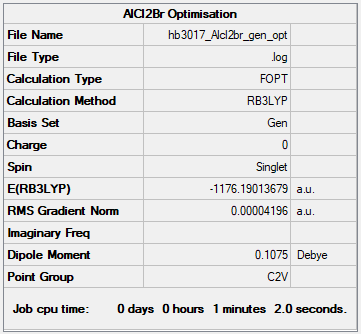
AlCl2Br
Method: B3LYP
Basis Set: 6-31G(d,p)LANL2DZ
         Item               Value     Threshold  Converged?
 Maximum Force            0.000136     0.000450     YES
 RMS     Force            0.000073     0.000300     YES
 Maximum Displacement     0.000681     0.001800     YES
 RMS     Displacement     0.000497     0.001200     YES
The frequency file for AlCl2Br can be found here:AlCl2Br frequency file.
Low frequencies ---   -0.0053   -0.0049   -0.0045    1.3568    3.6367    4.2604
 Low frequencies ---  120.5042  133.9178  185.8950
Optimised AlCl2Br molecule |
Calculating the dissociation energy
E(Al2Cl4Br2) = -2352.41629 a.u.
E(AlCl2Br) = -1176.19014 a.u.
ΔE = 2E(AlCl2Br)- E(Al2Cl4Br2) = 0.03601 a.u.
ΔE(kJmol-1) = 95 kJmol-1
This shows that when the dimer dissociates into the two monomers, energy is taken in (it is an endothermic process), meaning the monomers are higher energy than dimer. The result of this is that the molecule is more stable when it is dimerised (as Al2Cl4Br2) rather than as two monomers. Aluminium is a group 3 element, and when it is bonded to three other groups, it doesn't have eight valence electrons, it only has six. A result of this is that the molecule is electron deficient. When the molecule is dimerised, the bridged chlorines are used to form 3c-2e bonds where two electrons are shared between three atoms (Al, Cl and Al). This alleviates the electron deficiency of the Al atoms, stabilising the molecule.
Entropically, the dissociation will result in an increase of entropy. At sufficiently high temperatures, the entropy will outweigh the enthalpic contribution to the Gibbs free energy and the dissociation will become spontaneous.
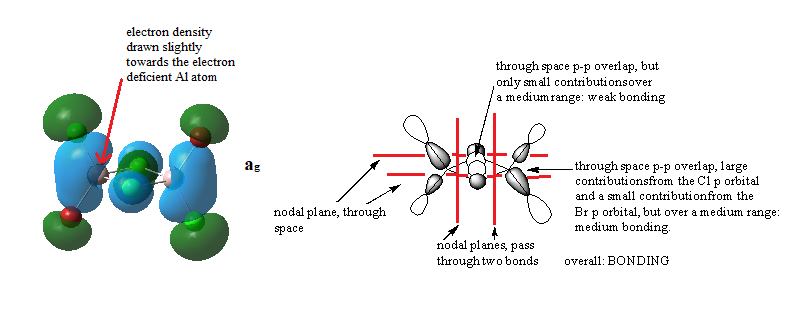
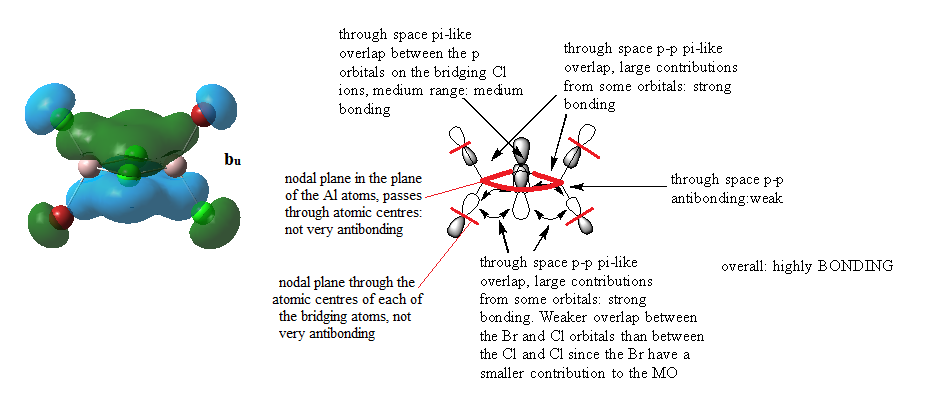
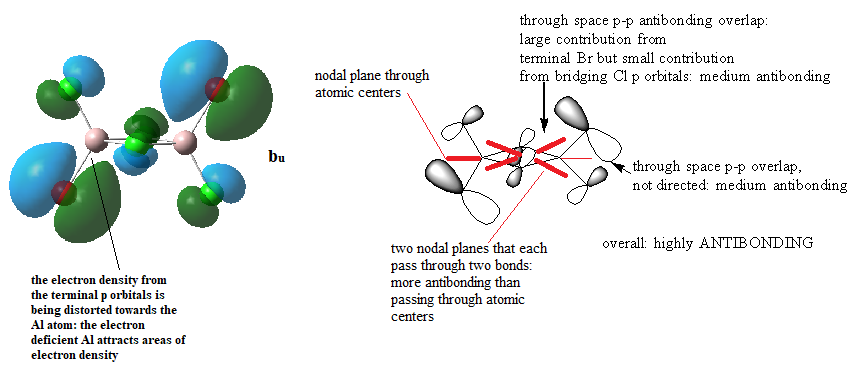
MOs for Al2Cl4Br2
Ng611 (talk) 14:47, 27 May 2019 (BST) Good LCAO analysis and a good description of the key interactions.
References
1. Common Bond Energies (D) and Bond Lengths (r), http://www.wiredchemist.com/chemistry/data/bond_energies_lengths.html, (accessed May 2019)


