Rep:Mod:290792
3rd Year Computational Laboratory; Module 1; Jubeda Hena (00641785)
Introduction
The use of plastic models is beneficial in understanding molecular strain, steric effects and stereoselectivity as well as many other properties qualitatively, however, there are many limitations with this method. From simply looking at a three dimensional molecular model, the model can not be analysed quantitatively. For instance the most stable conformation or bond lengths cannot be determined this way. This is where the use of computers come in to accurately model aspects of organic structures and rationalise their reactivities.
For the first part of this course Molecular Mechanics will be used to predict the geometries and regioselectivities . The Molecular Mechanics approach sums up individual bond properties instead of solving wave equations which can take a lot of time even with a computer. This method is best used for simple hydrocarbons and MM2 will be implemented. Semi-empirical and DFT molecular orbital theory will then be used to investigate regioselectivity and Neighboring Group Participation of a bicylic diene.
In the second part of this course NMR will be used to differentiate between isomers which other analytical techniques would otherwise not be great to use. A Taxol derivative will first be looked at and then going onto a mini project where the isomers of menthene will be looked at in more detail.
Part 1:
Modelling Using Molecular Mechanics
The Hydrogenation of Cyclopentadiene Dimer
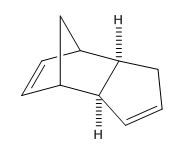
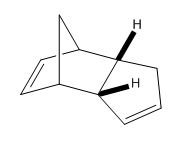
The dimerisation of cyclopentadiene occurs via a n2s + n4s pericyclic cycloaddition with one of the monomers being n2s (dienophile) and the other n4s (diene) [1]. From literature [2] it is known that when cyclopentadiene dimerises the endo dimer is preferred over the exo dimer. This is also shown by calculating the geometries and energies using ChemBio3D Ultra and minimising the energy using the MM2 approach (Table 1).
From looking at Table 1 it can be seen that the endo dimer has a slightly higher total energy when compared to the exo dimer. However, the method used for this calculation; molecular mechanics does not account for orbital overlap which the endo form has more of compared to the exo form.[3]. The energies shown are the deviations from normality so from Table 1 it can be seen that the bending energies deviate greatly. The torsion energies also have quite a large deviation and this is where the endo dimer has a higher energy than the exo dimer with a torsion energy of 9.5107 kcal/mol.The cyclodimerisation of the dimer is thermodynamically controlled with the endo dimer being the more stable one and the exo really becoming more stable at temperatures of 200-250 oC. [4] [5]
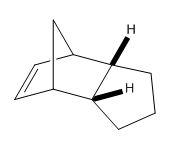
By using the MM2 model the two hydrogenated products can be computed so that it can be seen which double bond is easily hydrogenated in terms of thermodynamics.
From Table (2) it can be seen that dihydro derivative 2 has a lower energy, being more stable by 4.533 kcal/mol. When comparing stretching and bending energies it can be seen that there is very little difference in the stretch energy but a large deviation in the bend energy. The results obtained agree with literature which shows only the six-membered ring double bond being hydrogenated [6]. The bending energy for derivative 1 is higher due to the double bond in the molecule being highly strained placed next to a bridghead. When this is hydrogenated to give derivative 2 there is a huge release of strain resulting in the lower energy.
Atropisomerism in an Intermediate Related to the Synthesis of Taxol
Taxol is an important drug in the treatment of ovarian cancer. Atropisomerism arises when there is restriction of rotation around a single bond as the barrier to rotation is so high that conformers can be isolated due to steric strain. Using ChemBio3D Ultra 12.0, the energies of the two isomers were calculated using the MM2 and MMFF94 models where one carbonyl is pointing up and the other down.
From looking at both methods; MM2 and MMFF94 it can be seen that atropisomer 2 is the more stable one with the lower energy where the carbonyl group is pointing downwards. Looking at the MM2 model it is seen that atropisomer 2 has an energy of 3.317 kcal/mol lower than atropisomer 1. Using the MMFF94 model gives higher energies for both atropisomers but as they are two different methods the energies can not be compared. However, this method does confirm that isomer 2 is the more stable of the two also.
Looking at Table (4) it can be explained why the alkene reacts slowly. It may be a surprise that olefins at bridgehead positions are preferred. The hyperstable alkenes have negative olefin strain energies where the strain energy is less than the energy of the hydrogenated form. This is seen in Table (4) where the alkene has a lower energy. [7].
Modelling Using Semi-Empirical Molecular Orbital Theory
Regioselective Addition of Dichlorocarbene to a Diene
This section looks at the electronic aspects of reactivity, showing how explicit consideration of the electrons in molecules must be taken into account, and how the electrons influence bonds and derived spectroscopic properties. The experiment will illustrate the transition from a purely classical mechanical treatment of a molecule to a quantum mechanical treatment which includes the wave-description of the electrons. The objective of this task is to explore how electronic interactions within a molecule can influence its geometry and its reactivity.
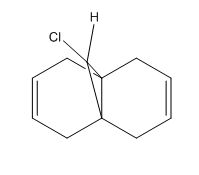
The reaction of a diene with electrophilic reagents will be looked at in this section. The energy of the diene along with its reaction with dichlorocarbene is shown below. The energies were run on ChemBio3D Ultra 12.0 using the MM2 and MOPAC/PM6 models. It is shown in literature that the dichlorcarbene attacks the diene via the top face to form the endo product. [8]

The MOPAC energy shows a higher than MM2 by 4.93305 kcal/mol. To see if there was any significant difference between the two models used one molecule was overlayed on top of the other. The distance between one atom in the first model and the same atom in the second model was calculated. From Figure (2) it can be seen that the zone of biggest difference is between C(1) and C(26) shown in Figure (3) with a difference of 0.1217 o/A.
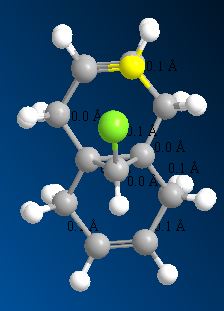
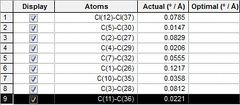
The deviations are due to the MOPAC optimisation method including the effects of (stereo)electronic effects in the molecule which the MM2 does not take account of.
Molecular Orbital Analysis
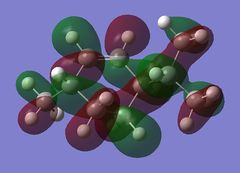
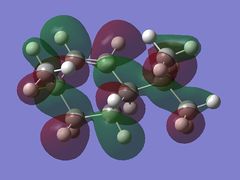
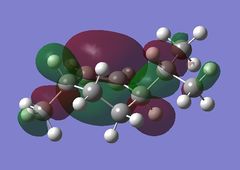
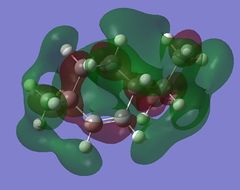
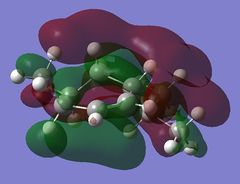
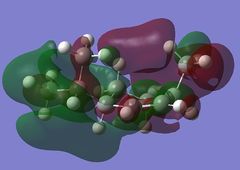
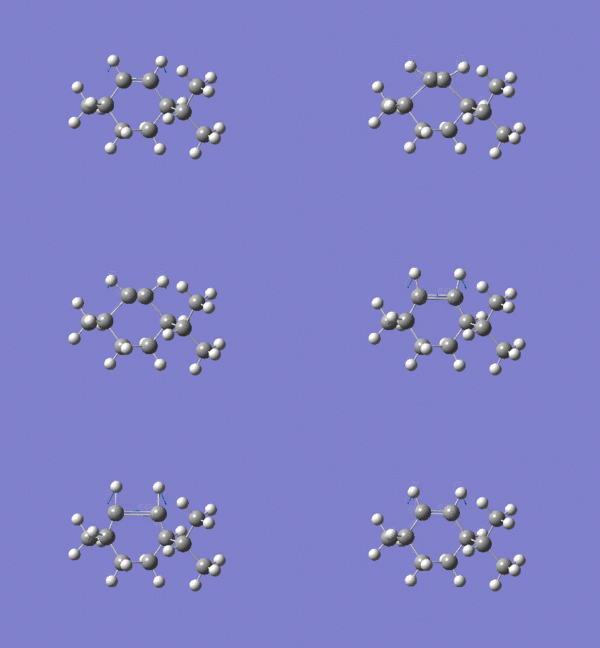
Using the optimised diene molecule the molecular orbitals were calculated. The B3LYP method and 6-31G(d,p) basis set was invoked. Table (6) shows the HOMO-1, HOMO, LUMO, LUMO+1 and LUMO+2 molecular orbitals were visualised. The log file for the optimised molecule can be found here: File:Diene opt log 73828.log along with it DSPACE file: DOI:10042/24360 .
| Label | Picture | Energy (a.u.) |
|---|---|---|
| HOMO-1 | 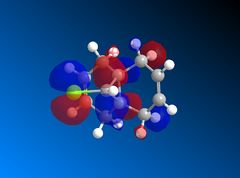 |
-0.30327 |
| HOMO | 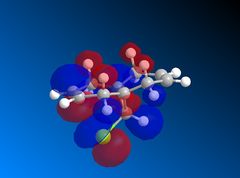 |
-0.29243 |
| LUMO | 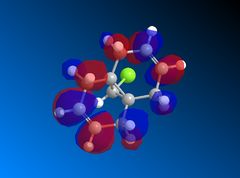 |
-0.15112 |
| LUMO+1 | 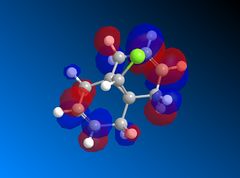 |
0.13856 |
| LUMO+2 | 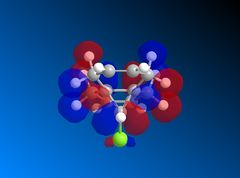 |
-0.06514 |
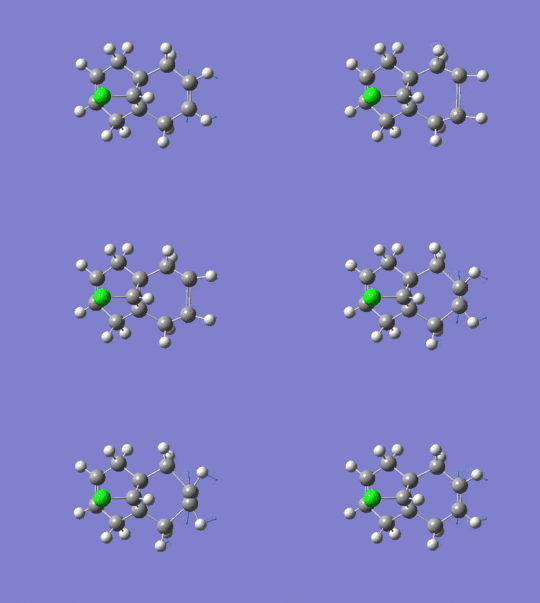
Looking at the HOMO-1 which shows the exo π-orbital it can be seen that there is there is large electron density around the double bond next to the C-Cl bond i.e. the exo side. When this is compared to the HOMO which shows the endo π-orbital it can be seen that the double bond endo to the C-Cl bond has greater electron density situated here. This helps support the idea that the endo product is formed as the endo alkene bond is more nucleophilic and electrophilic reagents are more likely to attack here.
The LUMO+2 shows the Cl-C o* bond which overlaps in an antiperiplanar fashion with the HOMO-1 orbital. This is stabilised comparative to HOMO orbital. [8] The molecular electrostatic potential is displayed below where the isopotential value was adjusted to 0.26 to display the maximum differentiation between the two alkenes.
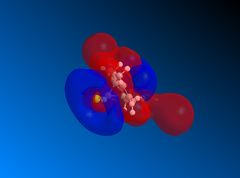
Looking at Figure(4) the blue is the negative potential so it can be seen that there is greater negative potential on the syn alkene. The endo alkene shows a larger sterically accessible π-orbital area compared to the exo alkene shown by the larger area of blue. [8]
Vibrational Frequency Analysis
An input file was created for the above diene and submitted to the SCAN server to obtain the infrared vibrational frequencies for the molecule. The DSPACE file can be found here: DOI:10042/24361 .
The frequency log file can be found here: File:Diene Freq log 73835.log
The low frequency table is shown below.
  Low frequencies ---   -5.4989   -0.0021   -0.0016    0.0009    7.5187   10.6326
 Low frequencies ---   90.2537  125.6209  158.1301
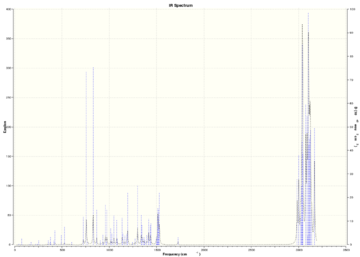
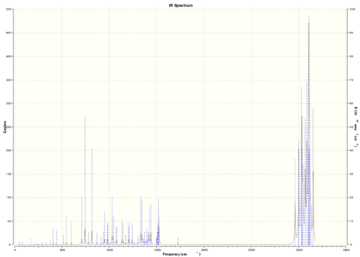
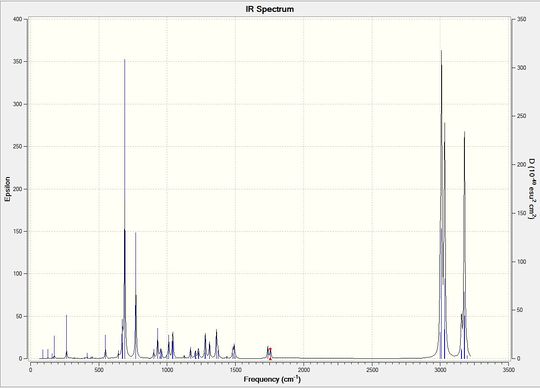
Table (7) shows the key IR stretches. The C-Cl stretch is seen to be lower due to Chlorine having a heavy mass therefore a smaller reduced mass leading to a smaller vibration. The exo C=C stretch is seen to be smaller than the endo C=C stretch which once again supports the fact that the endo product is formed as this is where more of the electrodensity is found.
The figure below shows the IR spectrum of the diene.
Monosaccharide Chemistry and the Mechanism of Glycosidation
For the last task in part 1 of this computational laboratory course the stereochemistry of the acetyl group for the starting material of an anomer will be determined to establish whether the α- or β- anomer is formed. This will be done by modelling the diastereospecificity of the reaction using molecular mechanics and quantum mechanics. This is an example of where neighbouring group effect is involved and will be discussed in more detail.
Glycosidation is the formation of a glycosidic bond which involves replacing a leaving group with a nucleophile. An example of glycosidation is shown below. The neighbouring group effect can be seen below where the acetyl group in the first intermediate forms an oxenium ion in the second intermediate which is replaced by an incoming nucleophile. The nucleophile can attack from the top face to form the β-anomer or attack from the bottom face to form the α-anomer.

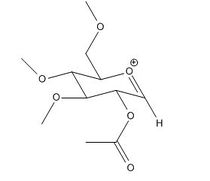
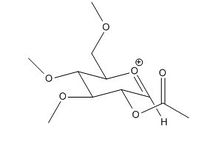
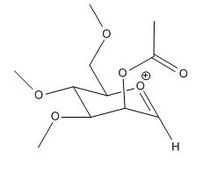
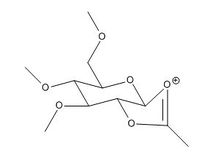
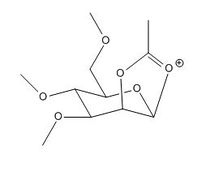
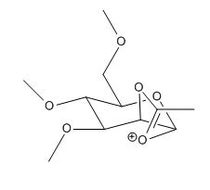
The oxenium cation (A) shown in the reaction above was drawn in ChemBio3D Ultra 12.0 in its four different configurations with the R group being a methyl. Each configuration has either the acetyl pointing towards the top face or bottom face, or the carbonyl on the acetyl pointing towards the top or the bottom face of the oxenium carbon.
The four molecules were then optimised using the MM2 and MOPAC/PM6 models and the results are shown in Table (8) below.
Anomers 1A and 2A both have the acetyl groups pointing downwards while anomers 3A and 4A have it pointing upwards. Anomers 1A and 3A both have the carbonyl group pointing downwards towards the oxenium cation while 2A and 4A having it pointing away. Looking at the total energies obtained from the MM2 optimisation shown in Table (8) it can be seen that anomer 3A is the most stable due to close proximity of the carbonyl and oxenium cation allowing greater orbital overlap. Anomer 4A on the other hand has the highest energy due to having the least orbital interaction. The same trend is seen with the MPOAC/PM6 model calculations.
The same was done for the oxenium cation (B) shown below drawing four different configurations and computing their energies using MM2 and MOPAC/PM6 with the results shown in the following table.
Once again anomers 1B and 2B have the acetyl group pointing down while 3B and 4B have it pointing upwards. Anomers 1B and 3B have the oxenium cation pointing towards the ring which is similar to what is seen in the A anomers in Table (8). The same trend is seen as above where molecules 1 and 3 have lower energies compared to anomers 2 and 4.
| Anomer | Picture | Angle | Distance |
|---|---|---|---|
| 1A |  |
105 | 2.9 |
| 2A |  |
168 | 2.9 |
| 3A |  |
96 | 2.5 |
| 4A | 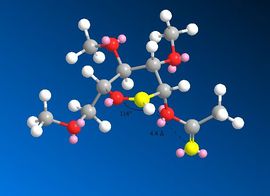 |
114 | 4.4 |
The angle at which the carbonyl attacks onto the oxenium cation was investigated along with the distance between the carbonyl and anomeric carbon. Table (10) can be related to Table (8) where the high energy of Anomer 4A can be seen to be due to the unideal angle of attack when compared to the Burgi-Dunitz angle of 107o. The long bond distance of 4.4 Å can also be seen. As anomer 3a has the lowest enegy the small distance between the anomeric carbon and carbonyl allows easy attack as well as the small angle. Although anomers 1A and 2A have the same distance, 2A has a very unfavourable angle of attack.
Part 2:
This part of the laboratory course looks at using NMR to differentiate between isomers which other analytical methods such as infrared and UV spectroscopy may not be capable of. 1H and 13C NMR will be looked at in partical.
Spectroscopy of an Intermediate Related to the Synthesis of Taxol
Molecule Optimisation
The task will be practiced on a derivative of Taxol. Here the objective will be to simulate the 1H and 13C spectra and compare them with the literature valus to see if what has been computed is correct. The Taxol derivative was minimised giving the following results.
13C and 1H NMR
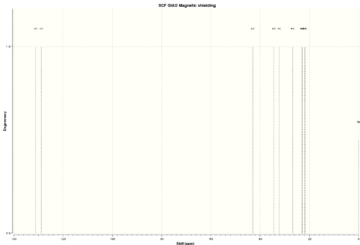
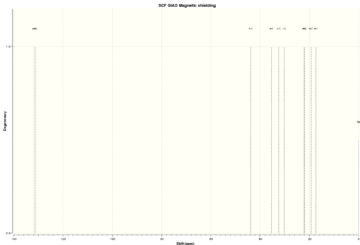
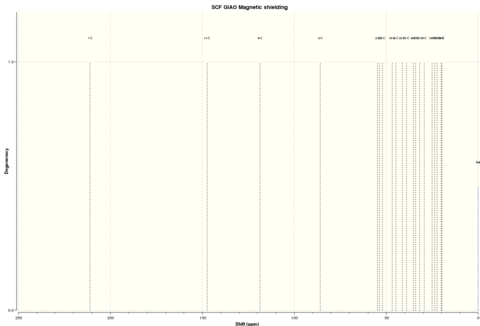
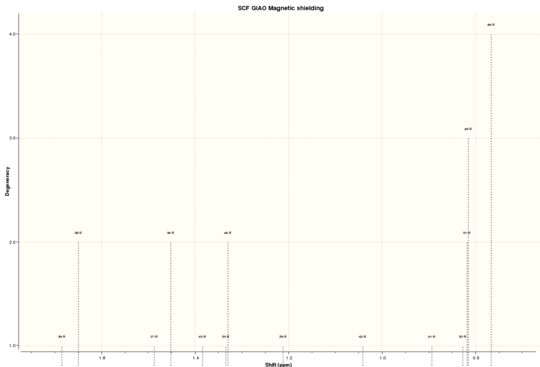
An input file was created to calculate the geometry at the density functional level (DFT) which was produced the SCAN server where the DSPACE file can be found: DOI:10042/24346 along with the log file: File:TAXOL log 74295.log. This was then used to acquire the NMR spectra. The results have been tabulated and presented in Tables (b) and (c) along with the literature values to provide evidence for the structural assignment. All peaks have a degenaracy of 1 for the 13C NMR. The reference used for both NMRs is: TMS mPW1PW91/aug-cc-pvdz CDCl3 GIAO.

| Carbon No' | Computed Shift (ppm) | Literature Value (ppm) | Difference (ppm) |
|---|---|---|---|
| 7 | 211.07 | 211.49 | 0.42 |
| 11 | 147.31 | 148.72 | 1.41 |
| 9 | 118.67 | 120.90 | 2.23 |
| 3 | 85.87 | 74.61 | -11.26 |
| 2 | 54.73 | 60.53 | 5.80 |
| 1 | 53.67 | 51.30 | -2.37 |
| 12 | 52.08 | 50.94 | -1.14 |
| 15 | 46.69 | 45.53 | -1.16 |
| 4 | 44.72 | 43.28 | -1.44 |
| 22 | 41.19 | 40.82 | -0.37 |
| 21 | 38.97 | 38.73 | -0.24 |
| 8 | 35.19 | 36.78 | 1.59 |
| 10 | 34.07 | 35.47 | 1.40 |
| 23 | 31.80 | 30.84 | -0.96 |
| 6 | 29.35 | 30.00 | 0.65 |
| 13 | 24.95 | 25.56 | 0.61 |
| 17 | 23.62 | 25.35 | 1.73 |
| 14 | 22.30 | 22.21 | -0.09 |
| 16 | 20.16 | 21.39 | 1.23 |
| 5 | 19.66 | 19.83 | 0.17 |
| Hydrogen No' | Computed Shift (ppm) | Literature Value (ppm) | Degeneracy | Difference (ppm) |
|---|---|---|---|---|
| 33 | 5.78 | 5.21 (m, 1H) | 1 | -0.57 |
| 50 | 3.29 | 3.00-2.70 (m, 6H) | 1 | -0.29 |
| 24 | 3.16 | 3.00-2.70 (m, 6H) | 2 | -0.16 |
| 49 | 3.12 | 3.00-2.70 (m, 6H) | 2 | -0.12 |
| 48 | 3.05 | 3.00-2.70 (m, 6H) | 2 | -0.05 |
| 47 | 3.03 | 3.00-2.70 (m, 6H) | 2 | -0.03 |
| 31 | 2.68 | 3.00-2.70 (m, 6H) | 1 | 0.02 |
| 35 | 2.62 | 2.70-2.35 (m, 4H) | 1 | - |
| 25 | 2.48 | 2.70-2.35 (m, 4H) | 2 | - |
| 40 | 2.44 | 2.70-2.35 (m, 4H) | 2 | - |
| 30 | 2.39 | 2.70-2.35 (m, 4H) | 1 | - |
| 26 | 2.23 | 2.20-1.70 (m, 6H) | 1 | -0.03 |
| 32 | 1.94 | 2.20-1.70 (m, 6H) | 4 | - |
| 36 | 1.90 | 2.20-1.70 (m, 6H) | 4 | - |
| 37 | 1.85 | 2.20-1.70 (m, 6H) | 4 | - |
| 38 | 1.85 | 2.20-1.70 (m, 6H) | 4 | - |
| 39 | 1.69 | 2.20-1.70 (m, 6H) | 2 | 0.01 |
| 28 | 1.65 | 1.58 (t, J=5.4 Hz, 1H) | 2 | -0.07 |
| 27 | 1.49 | 1.50-1.20 (m, 3H) | 2 | - |
| 34 | 1.45 | 1.50-1.20 (m, 3H) | 2 | - |
| 43 | 1.38 | 1.50-1.20 (m, 3H) | 1 | - |
| 53 | 1.33 | 1.10 (s, 3H) | 2 | -0.23 |
| 44 | 1.33 | 1.10 (s, 3H) | 2 | -0.23 |
| 29 | 1.21 | 1.10 (s, 3H) | 1 | -0.11 |
| 42 | 1.04 | 1.07 (s, 3H)) | 1 | 0.03 |
| 41 | 0.89 | 1.07 (s, 3H) | 1 | 0.18 |
| 52 | 0.83 | 1.07 (s, 3H) | 4 | 0.24 |
| 51 | 0.82 | 1.03 (s, 3H) | 4 | 0.21 |
| 45 | 0.82 | 1.03 (s, 3H) | 4 | 0.21 |
| 46 | 0.77 | 1.03 (s, 3H) | 4 | 0.26 |
From Table (b) it can be seen that the biggest difference is 11.26 ppm relating this to C(3) in Figure (b). The second biggest difference is for C(2) however all other shifts are within 2.27 ppm of the literature values. The discrepancy of 11.26 ppm can be explained by the fact that the carbon atom is attached to the heavier element sulfur. This shift will require a correction for the Spin-orbit coupling errors associated with the calculation. The difference for C(3) may be due to the molecule having the wrong conformation.
The proton NMR shown in Table (c) shows that the biggest difference between computed values and literature values is 0.57 ppm. All other shifts either fall into the range provided in literature or fall only slightly outside of the range. It can therefore be concluded from this that using NMR for conformational analysis is a useful technique.
The small differences in shifts for both nuclei may be associated with the reference used to produce the NMRs. The ones computed used CDCL3 as the reference while the literature values use C6D6 as the reference. If deuterated benzene was used instead then the shifts obtained may be closer to literature values.
Mini Project - Conformational Analysis of Menthene[9]
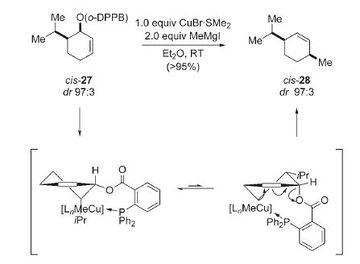
In the final part of these computational lab project a literature molecule will be studied. The molecule that has been chosen is menthene and its cis and trans isomers will be studied. NMR will be used to differentiate between the two isomers and compared to literature values. The molecular orbitals will also be looked at to see if there are any significant differences between the two conformations. The following reaction schemes show the formation of the two isomers obtained from Demel et al. [9]
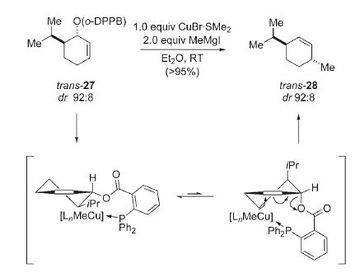
Optimisation Energies
Both isomers were minimised usng the MM2, MMFF94 and MOPAC/PM6 models in ChemBio3D Ultra 12.0. The results are shown in Table (d) with trans-menthene observed to be the more stable isomer. The same trend is observed for all three models.
13C and 1H NMR
The same method used for the taxol derivative was used to produce the NMRs of the cis and trans isomers of menthene. The DSPACE file for the cis isomer can be found here; DOI:10042/24350 and its log file here: File:Cis Isomerlog 74496.log while the DSPACE file for the trans isomer can be found here DOI:10042/24349 and its log file here: File:Trans Isomerlog 74497.log. The reference used for both the 13C and 1H NMRs was; TMS mPW1PW91/6-31G(d,p) CDCl3 GIAO.
Looking at Table (e)it can be seen that the majority of the computed shifts are calculated to be slightly higher than the literature values. The biggest difference is 2.85 ppm for the cis-isomer. Looking at the trans-isomer the computer values vary at being higher or lower than the literature values with the largest deviation being 3.43 ppm. There are some differences in the two isomers looking at the literature values showing that the two conformations are in fact difference.
Table (f) shows the proton NMR shifts. These have smaller differences in shifts when comparing to literature compared to the carbon nuclei NMR. The biggest difference for the cis-isomer between computed values and literature values is 0.69 ppm. For the trans-isomer the biggest difference is 0.61 ppm. The biggest differences in both isomer's NMRs are observed in the far end of the spectrum. Otherwise looking at the NMRs there is very good correlation with the computed and literature values and a clear difference is seen in all the shifts, coupling constants and integrations to differentiate between the two isomers.
Molecular Orbital Diagrams of Menthene
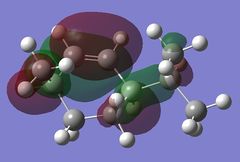
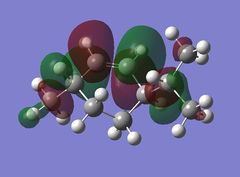
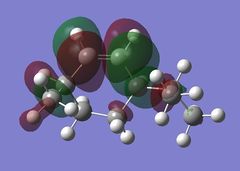
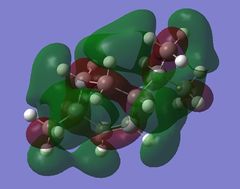
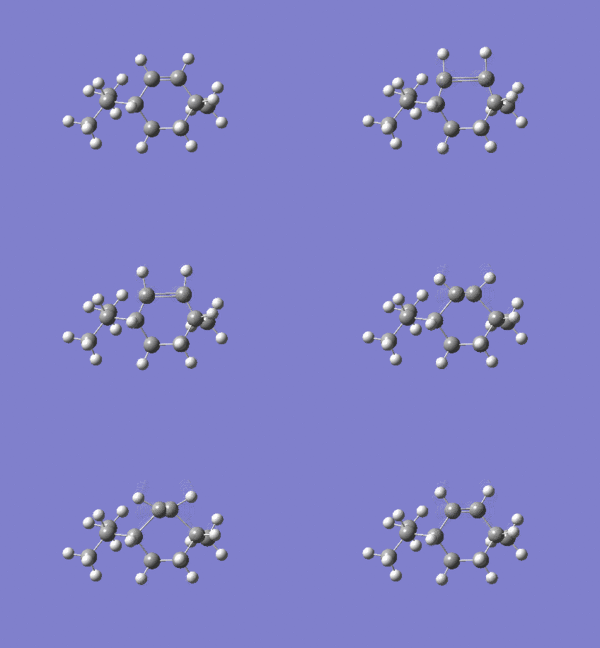
Using GaussView 5.0 the following molecular orbitals for both the cis and trans-menthene isomers were computed shown in Table (g). The previously optimised molecules were used from the DFT method using the 6-31G(d,p) basis set.
The biggest difference in energy is seen between the cis LUMO+1 orbital and the trans LUMO+1 orbital. The cis isomer has much better delocalisation and better overlap resulting in the lower energy of the two. Very little difference is seen between the HOMO-1, HOMO and LUMO orbitals, all having similar interactions and overlap when comparing isomers. The cis LUMO+2 orbital has more nodal planes compared to the trans orbital resulting in a slightly higher energy.
Frequency Analysis
A frequency analysis was carried out on the two isomers with the DPSACE file for the cis-isomer found here: DOI:10042/24354 and its formatted checkpoint file here: File:Cis Freq checkpoint 74568.fchk. For the trans-isomer the DSPACE file can be found here: DOI:10042/24355 and its formatted checkpoint file here: File:Trans freqcheckpoint 74575.fchk.
The results from the frequency analysis show that the trans-isomer has a very slightly larger C=C stretch compared to the cis-isomer. This may be due to the C=C being stronger thus vibrating at a higher frequency due to the trans-isomer being slightly more stable.
Conclusion
This project started off looking at the different techniques of molecular mechanics and semi-empirical molecular orbital methods for structural and spectroscopic evaluation. The MM2 model was used to look at the cyclopentadiene dimer and observe which one was the more stable of the two.
The MMFF94 method was then used along with the MM2 method to look at the Taxol dihydro derivative. The results for this showed that the conformation with the carbonyl group pointing downwards was the more stable of the two confirmed by both methods.
MOPAC/PM6 modelling was the brought in to analyse the regioselective addition of diene with dichlorcarbene. A population analysis and frequency analysis were carried out to help support the idea of the endo isomer being the more stable of the two products formed (Figure 1).
The glycosidation mechanism was also looked at to establish what the stereochemistry of the acetyl group in a monosaccharide needs to be to form the α- or β- anomer. The results are shown in Tables (8) and (9).
In the second part of the course spectroscopic data was simulated to look an intermediate related to the synthesis of Taxol and a literature molecule; menthene. 13C and 1H NMR were used to look at the two different isomers and compare them to literature. The results were very close to literature values showing that this is a good method to use to differentiate between isomers when other methods such as UV and IR can not be used.
References
<references> [5] |- [1] |- [2] |- [3] |- [4] |- [6] |- [7] |- [8] |- [9] </ref>
- ↑ 1.0 1.1 http://www.ch.imperial.ac.uk/rzepa/blog/?p=7389
- ↑ 2.0 2.1 P. Caramella, P. Quadrelli, L. Toma; J. Am. Chem. Soc.; 2002; 124; 1130–1131 DOI:10.1021/ja016622h
- ↑ 3.0 3.1 K. Alder, G. Stein; Angew. Chem.; 1937; 50; 510
- ↑ 4.0 4.1 A. G. Turnball, H. S. Hull; Aus. J. Chem.; 1968; 21; 1789-1797
- ↑ 5.0 5.1 http://www.ch.ic.ac.uk/motm/porphyrins/introDA.html
- ↑ 6.0 6.1 F. Alonso, M. Yus; Tetrahedron Letters; 1996; 37; 6925-6928 DOI:10.1016/0040-4039(96)01518-3
- ↑ 7.0 7.1 A. B. McEwan, P.van R. Schleyer; J. Am. Chem. Soc; 1986; 108; 1951-3960 http://pubs.acs.org/doi/abs/10.1021/ja00274a016
- ↑ 8.0 8.1 8.2 8.3 B. Halton, R.Boese, R. S. Rzepa; J. Chem. Soc. Perk. Trans.; 1992; 447-448 DOI:10.1039/P29920000447
- ↑ 9.0 9.1 9.2 9.3 9.4 P.Demel, M. Keller, B. Breit; Chem. Eur. J.; 2006; 12; 6669-6683 DOI:10.1002/chem.200600225

