Rep:Mod:22/03/1992
3rd Year Computational Lab Module 2 Introduction- James Davies
The aim of this project is to develop an understanding of the bonding energies in, structural energies of and the molecular orbitals present in a range of molecules. The project also covers an overview and comparison of a range of aromatic molecules discussing factors in measuring the degree of aromaticity. To achieve this GaussView 5.0 was utilised to perform calculations using the Gaussian system and graphically display the structures of the molecular orbitals. The information calculated can be useful for comparison with qualitative theory and experimental results and in building assumptions about the reactivity of species.
Part 1- Optimising Molecules
BH3 Lower Basis Set
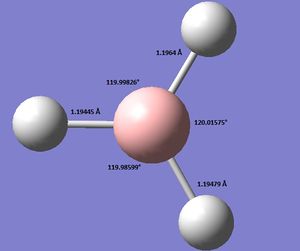
Using GaussView 5.0 an optimised model of BH3 was constructed. The program produced this structure by assuming each B-H bond length to be 1.5 A and solving the Schrodinger equation for the electron density of a range of conformations. The details of the optimised structure is tabulated in table (a) and with the image associated. The calculation used the 'Optimisation' job-type, the minimal 3-21G basis set, the DFT and B3LYP method.
The log file File:BH3STEP1.LOG
Gaussian calculated the optimal bond lengths to be 1.19 Å (2 d.p.) and bond angle of the H-B-H bonds to be 120°.
The data shown below indicates the program ran to completion indicated by the its convergence and force values.
   Item               Value     Threshold  Converged?
 Maximum Force            0.000413     0.000450     YES
 RMS     Force            0.000271     0.000300     YES
 Maximum Displacement     0.001610     0.001800     YES
 RMS     Displacement     0.001054     0.001200     YES
 Predicted change in Energy=-1.071764D-06
 Optimization completed.
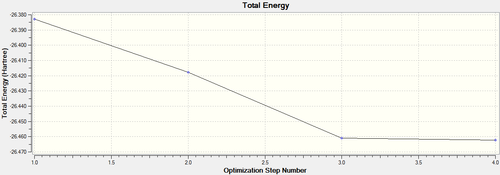
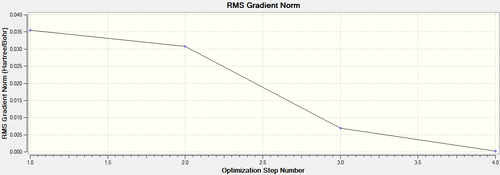
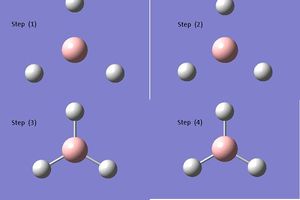
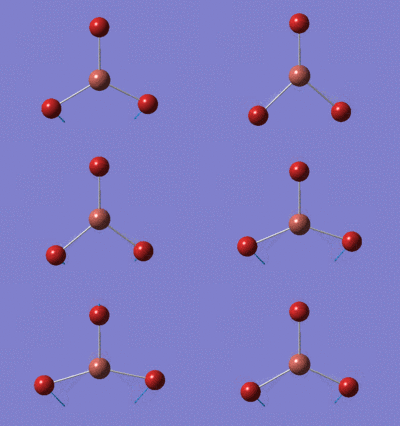
Below each step of the optimisation are explicitly shown in an energy by optimisation step graph and gradient by optimisation step graph (figure (a)). This is assisted by a graphic showing the changing modes in each optimisation step (see table (b)). By optimising Gaussian is trying to find the nuclear bond distance with the minimal potential energy (the equilibrium bond distance); the stable state position on a PES (potential energy surface). At this point, the gradient of the PES is zero hence, the RMS (root mean squared) gradient curve converges towards a gradient of zero as the system approaches the optimised molecule.
Figure (a)
In the graphics it can be seen that the initial frame shows no bond formed. This is a fault in the Gaussian program detecting the bond length given to be no bond (even if in reality a bond will be present). Gaussian is interpreting the bond length to be beyond the dissociation limit on the potential energy surface as shown in figure (b)1 below where the right hand side of curve indicates the dissociation limit. A bond can form covalently (where the electrons are shared), ionically where to species donate and accept electrons with an electrostatic attraction forming the bond) or coordinately where a specie donates a pair of electrons to another. Generally, a bond forms when the internuclear distance is such that it allows the orbitals of two chemical species to interact causing the electrons to rearrange between the two species. Definition of a bond is discussed in more detail later.

BH3 Higher Basis Set
Higher basis set LOG file File:BH3STEP1HIGHER BASIS SET.LOG
The optimised BH3 molecule at a higher basis set is shown below.
Pentahelicene |
By using a higher basis set we can get a clearer and more accurate optimisaton of the BH3 molecule, this has been done below using a basis set of 6-31G which includes d and p orbitals. Data shown in table (c). The use of a higher basis set allows the incorporation of more functions in our optimisation.
| Optimised BH3 Data for higher basis set | ||
|---|---|---|
| File Type | .log | |
| Calculation Type | FOPT | |
| Calculation Method | RB3LYP | |
| Basis Set | 6-31G(d,p) | |
| Final Energy (au) | -26.6153236 | |
| Gradient | 0.00000235 | |
| Dipole Moment | 0 | |
| Point Group | D3h | |
| Calculation Run Time (seconds) | 6.0 | |
| Charge | 0 | |
| Spin | Singlet | |
Gaussian found the optimum B-H bond length to be 1.19 Å and optimum H-B-H bond angle to be 120°. The bond distance is fairly in line with the literature value of 1.226 Å [2] There is a slight difference between the final energies of the lower and higher basis-set BH3 molecules.
Data showing it went to completion.
Item               Value     Threshold  Converged?
 Maximum Force            0.000005     0.000450     YES
 RMS     Force            0.000003     0.000300     YES
 Maximum Displacement     0.000019     0.001800     YES
 RMS     Displacement     0.000012     0.001200     YES
 Predicted change in Energy=-1.304899D-10
 Optimization completed.
TlBr3
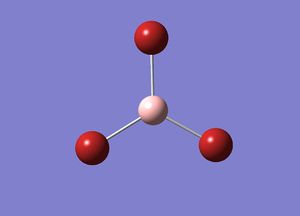
By using GaussView 5.0 the optimisation calculation can be performed on TlBr3. Unlike previous, a medium level basis-set has been used as a compromise between ease in calculations and value of optimisation. The symmetry of TlBr3 has been set to D3h with a hight 'tight' tolerance of 0.0001. Furthermore, a LANL2DZ basis set was invoked.
The optimised TlBr3 molecule at a higher basis set is shown below.
Pentahelicene |
| Optimised TlBr3 Data | ||
|---|---|---|
| File Type | .log | |
| Calculation Type | FOPT | |
| Calculation Method | RB3LYP | |
| Basis Set | LANL2DZ | |
| Final Energy (au) | -91.21812851 | |
| Gradient | 0.0000009 | |
| Dipole Moment | 0 | |
| Point Group | D3h | |
| Calculation Run Time (seconds) | 17.0 | |
| Charge | 0 | |
| Spin | Singlet | |
File:TLBR3 MEDIUM OPTIMISATION.LOG This link will open a document showing the data of the calculation.
Gaussian found the optimum Tl-Br bond distance to be 2.651 Å and the optimum Br-Tl-Br bond angle to be 120°. The literature value was found to be 2.51 Å [3] which is fairly similar to calculated value.
Data showing calculation went to completion.
Item               Value     Threshold  Converged?
 Maximum Force            0.000002     0.000450     YES
 RMS     Force            0.000001     0.000300     YES
 Maximum Displacement     0.000022     0.001800     YES
 RMS     Displacement     0.000014     0.001200     YES
 Predicted change in Energy=-6.084033D-11
 Optimization completed.
BBr3
When optimising BBr3 using GaussView 5.0, the higher basis set BH3 model was invoked. Slight differences included the change in basis set to GEN. This change allows the system to specify the basis-set and psuedo-potentials for each individual atom. Table (e) shows the relevant data.
File:BBR3 OPTIMISATION.LOG This link will open a document showing the data of the calculation.
Below is the link for D-space
Completed population analysis of BBr3
Gaussian found the optimum B-Br bond distance to be 1.93 Å and the optimum Br-Tl-Br bond angle to be 120°. Literature value found to be 1.84 Å [4] which is fairly in line with calculated value.
Data showing calculation went to completion.
Item               Value     Threshold  Converged?
 Maximum Force            0.000008     0.000450     YES
 RMS     Force            0.000005     0.000300     YES
 Maximum Displacement     0.000036     0.001800     YES
 RMS     Displacement     0.000023     0.001200     YES
 Predicted change in Energy=-4.027020D-10
 Optimization completed.
Comparison of BH3, TlBr3 and BBr3
| Comparison of different bond lengths | ||
|---|---|---|
| Molecule | Bond Lengths (A) | |
| BH3 | 1.19 | |
| TlBr3 | 2.65 | |
| BBr3 | 1.93 | |
Calculations indicate that the bond lengths are ordered in the following way: Tl-Br > B-Br > B-H. When comparing BH3 and BBr3, it is clear that changing the ligand causes the bond length to change. Calculations show the Br ligand to exhibit a longer bond with the central boron atom compared to the hydrogen ligand. The reason for this change in bond length is a result of the bromine being a larger more polarisable atom than hydrogen. Hence, the bromine frontier orbitals are more diffused exhibiting poorer overlap with the central boron atom frontier orbitals. As a result, the B-Br bond is weaker and longer when compared to the B-H bond. Secondly, as the atomic radius of the bromine ligand is larger then the hydrogen, the internuclear distance on forming the bond with boron is larger resulting in the longer bond. A similarity between bromine and hydrogen is they are both X-type ligands. 62%
When comparing TlBr3 and BBr3, it is clear that changing the central atom causes the bond length with the ligands to change. The reason behind this is similar to that discussed previous. Thallium being a larger has more diffused frontier orbitals, hence, exhibiting poorer overlap with bromine ligands elongating the Tl-Br bond. Conversely, boron has less diffused frontier orbital exhibiting stronger overlap with bromine ligand shortening B-Br bond.
As mentioned earlier, a bond is an entity that forms when the internuclear distance between two chemical species is such that it allows the orbitals of the two species to interact causing the electrons to rearrange between them.
Definition of a Bond
The depiction of a bond in GaussView 5.0 is dependent upon distance parameters defined in the program. So when a bond is not observed, such as, with BH3 , the length calculated exceeds th parameters of GaussView 5.0, hence a bond is not observed. As mentioned earlier, a bond is an entity that forms when the internuclear distance between two chemical species is such that it allows the orbitals of the two species to interact causing the electrons to rearrange between them. A bond can form covalently (where the electrons are shared), ionically where to species donate and accept electrons with an electrostatic attraction forming the bond) or coordinately where a specie donates a pair of electrons to another.
Frequency Analysis
This was performed as a reassurance that the optimum structure was gained when optimised in GaussView 5.0. Hte clauclation allowed us to determine the double-derivative of the potential energy surface indicating whether the minimum point had bee reached. At this point the optimal bond length was present (see figure (a) for potential energy surface). To run a vibrational analysis the job typ was changed from 'Optimisation' to 'Frequency'.
BH3
Initially carried out vibrational analysis on the optimised 6-31G(d,p) BH3 molecule without imposing symmetry restrictions on the calculation.
Below is a link to the frequency analysis file for BH3.
Below are the low frequency data relating to the -6 term in the 3N-6 equation for vibrational modes. The data clearly shows that the optimal structure was gained as the second line of low frequency data all shows positive figures indicating that minimum structure has formed.
 Low frequencies ---   -0.9033   -0.7343   -0.0054    6.7375   12.2491   12.2824
 Low frequencies --- 1163.0003 1213.1853 1213.1880
The data below shows calculation completed because it has converged and within the -15 cm-1 and 15 cm-1 range. These low frequency values relate to the movement of the center of mass of the molecule. The fact they're negative is negligible as they are significantly smaller then the mode relating vibrations.
 Item               Value     Threshold  Converged?
 Maximum Force            0.000005     0.000450     YES
 RMS     Force            0.000002     0.000300     YES
 Maximum Displacement     0.000019     0.001800     YES
 RMS     Displacement     0.000009     0.001200     YES
 Predicted change in Energy=-1.324717D-10
 Optimization completed.
The frequecy calculation has been repeated on BH3 imposing D3h symmetry. This was achieved by changing the 'Point Group' via the 'Edit' tab. The tolerance was set to 'very tight' 0.0001. The data file can be accessed below.
File:JAMESDAVIES BH3 FREQ D3HSYMMETRY.LOG
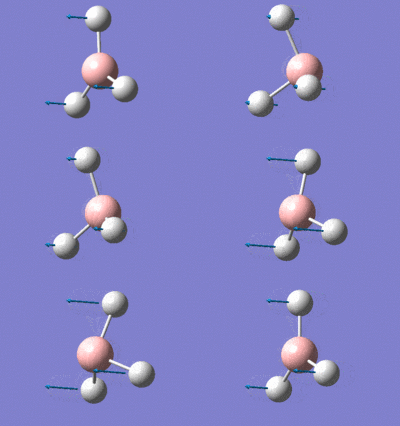
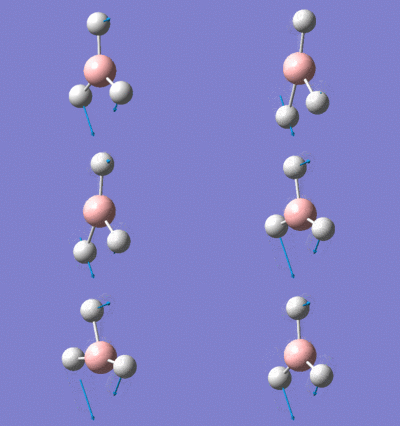
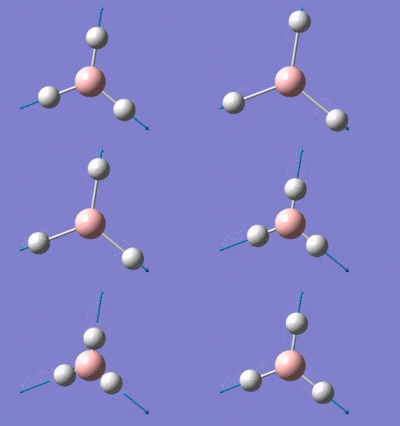
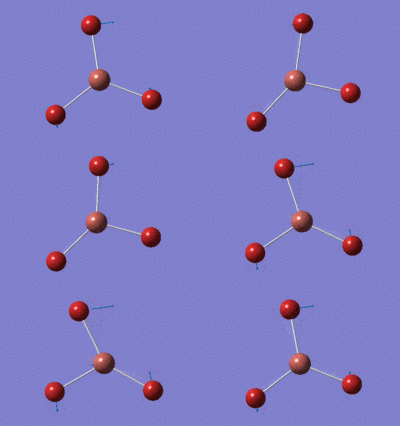
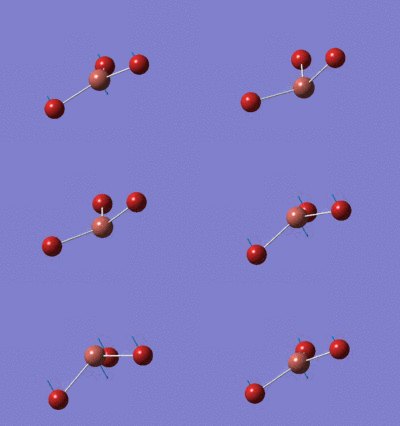
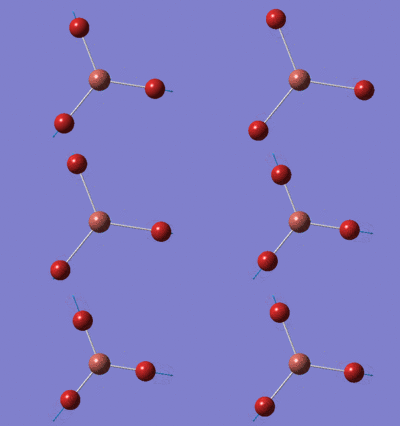
The vibrational modes are displayed in table (g) below.
The predicted IR spectrum is shown in figure (c).
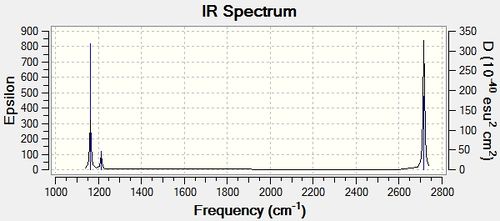
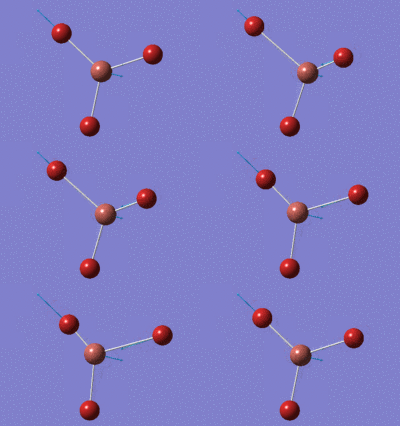
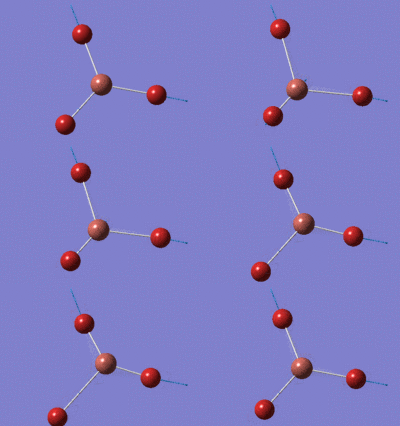
Only three peaks are present on the IR spectrum, however, this does not appear to be in line with the 6 vibrational modes calculated with Gaussian. Closer observation of the modes calculated shows two sets of degenerate frequencies at 1213.19 cm-1 and 2715.43 cm-1. This degeneracy, therefore means only one peak will appear for these two vibrational modes. In addition, the mode at 2582.26 cm-1 is seen to have an intensity of 0, therefore, will not appear on spectrum. This lack of intensity is because the symmetric stretch mode results in no dipole moment forming to interact with the radiation.
Data of the calculation shown below in table (h)
| Frequency BH3 Data | ||
|---|---|---|
| File Type | .log | |
| Calculation Type | FREQ | |
| Calculation Method | RB3LYP | |
| Basis Set | 3-21G | |
| Final Energy (au) | -23.4622634 | |
| Gradient | 0.00020672 | |
| Dipole Moment | 0 | |
| Point Group | D3h | |
| Calculation Run Time (seconds) | 14.0 | |
| Charge | 0 | |
| Spin | Singlet | |
TlBr3
Below is a link to the frequency analysis file for TlBr3.
File:JAMESDAVIES TLBR3 FREQ.LOG
D-Space file is below.
Completed population analysis of BH3
The frequency calculation analysis was then carried out on TlBr3. Below the intensities are shown to be inline with the restrictions of 15 cm-1 and with positive values showing the minimum structure has formed.
 Low frequencies ---   -3.4213   -0.0026   -0.0004    0.0015    3.9362    3.9362
 Low frequencies ---   46.4289   46.4292   52.1449
The data below shows calculation completed because it has converged and within the -15 cm-1 and 15 cm-1 range.
 Item               Value     Threshold  Converged?
 Maximum Force            0.000002     0.000450     YES
 RMS     Force            0.000001     0.000300     YES
 Maximum Displacement     0.000022     0.001800     YES
 RMS     Displacement     0.000011     0.001200     YES
 Predicted change in Energy=-5.660840D-11
 Optimization completed.
The table of vibrational analysis is shown in table (i).
The predicted IR spectrum is shown in figure (d).
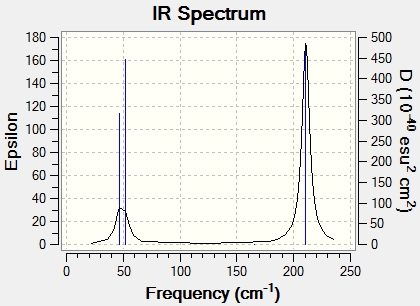
Again only three peaks are present on the IR spectrum. Similarly to BH3, there are two sets of degenerate modes at 210.69 cm-1 and 46.43 cm-1. Furthermore, there is a mode of 0 intensity at 165.27 cm-1.Hence, only three peaks are observed.
Data for frequency analysis shown below.
| Optimised TlBr3 Data | ||
|---|---|---|
| File Type | .log | |
| Calculation Type | FREQ | |
| Calculation Method | RB3LYP | |
| Basis Set | LANL2DZ | |
| Final Energy (au) | -91.21812851 | |
| Gradient | 0.0000009 | |
| Dipole Moment | 0 | |
| Point Group | D3h | |
| Calculation Run Time (seconds) | 12.0 | |
| Charge | 0 | |
| Spin | Singlet | |
Comparison of BH3 and TlBr3 Frequency Analysis
The relevant data for BH3 and TlBr3 are presented in tables (k) and (l) respectively.
| BH3 frequency data | ||
|---|---|---|
| Symmetry Label | Frequency (cm-1) | Intensity |
| a2 " | 1163.0 | 92.5478 |
| e' | 1213.19 | 14.0553 |
| e' | 1213.19 | 14.0589 |
| a1 ' | 2582.26 | 0 |
| e' | 2715.43 | 126.3307 |
| e' | 2715.43 | 126.3211 |
| TlBr3 frequency data | ||
|---|---|---|
| Symmetry Label | Frequency (cm-1) | Intensity |
| e' | 46.46 | 3.687 |
| e' | 46.43 | 3.687 |
| a2 " | 52.14 | 5.8466 |
| a1 ' | 165.27 | 0 |
| e' | 210.69 | 25.4830 |
| e' | 210.69 | 25.4797 |
It is clear that the TlBr3 frequencies are significantly lower then BH3. This observation is a result of the phenomenon that larger atoms form weaker bonds due to more diffused orbital being present which overlap poorly compared to constricted orbitals. TlBr3 is heavier then BH3 and its atoms are larger, therefore, the bonding is weaker. The weaker the bonding, the lower the frequency value as the bond is energetically smaller and hence weaker. This justification is reinforce by viewing the inverse relationship between the reduced mass and frequency. Being heavier, the reduced mass of TlBr3 is larger, therefore, the frequency is lower.
The same modes have been recorded (4x e', 1x a2 " and 1x a1 ') , however, the ordering has changed. Both are similar in that stretching modes are of higher frequencies then bending modes. It is clear that the lowest energy mode is different for the two species with the TlBr3 observing to degenerate e' and the BH3 observing one a2 " .
Both spectra have similar patterns on showing three peaks one at a higher frequency and two peaks at a lower intensity. What differs is the broadness of the peaks. TlBr3 has much broader peaks then BH3. Another similarity in both spectra is that both the highest and lowest energy peaks are due to two sets of degenerate vibrational modes. The difference in energy between these two modes is a result of one being bending (lower in energy) and the other stretching (higher in energy).
When carrying out calculations the same method and basis set must be invoked for both the optimisation and frequency calculations in order for us to be able to compare them. If different methods and basis sets used, the calculations become incomparable. As mentioned previous, the frequency analysis allows the reassurance that the minimum structure has formed relating to the minimum point on PES.
"Low frequencies" in the Gaussian output file represent the -6 component of the 3N-6 expression relating the number of vibrational modes to a non-linear molecule. These "low frequency" displacements are a result of the vibrational modes which can be related to their frequency value by the degree they change the central mass of the molecule. This relationship of reduced mass to frequency is shown in the following expression .
BH3 Population Analysis
D-Space file is below.
Completed population analysis of BH3
The file showing Gaussian calculation is here. File:MO ANALYSIS BH3STEP1HIGHER BASIS SET.LOG
This analysis was carried out on the checkpoint (.chk) file of the 6-31G(d,p) optimised BH3. To perform calculation the job-type was set to 'Energy', 'Full NBO' was selected under NBO tab and the key words 'pop=full' were entered . The molecular orbitals are shown below on the MO diagram in figure (e):
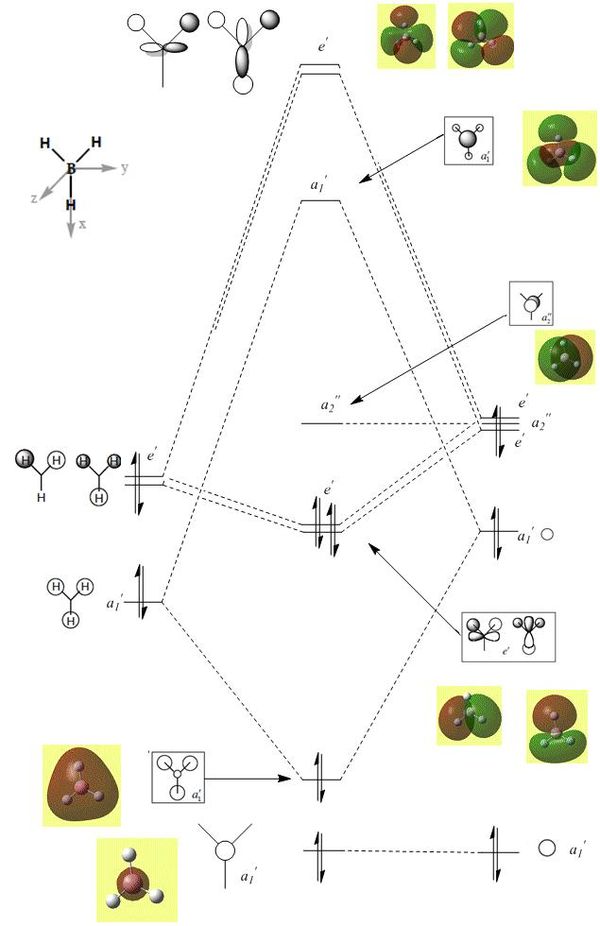
It is clear from the molecular orbital diagram that there is no difference between the LCAO and the computer image molecular orbitals. This reinforces the accuracy and usefulness of qualitative MO theory as it is inline with the computer generated models.
| Optimised BH3 Population Analysis Data | ||
|---|---|---|
| File Type | .log | |
| Calculation Type | Sp | |
| Calculation Method | RB3LYP | |
| Basis Set | 6-31G(d,p) | |
| Final Energy (au) | -26.6153236 | |
| Gradient | 0.00000235 | |
| Dipole Moment | 0 | |
| Point Group | D3h | |
| Calculation Run Time (seconds) | 4.0 | |
| Charge | 0 | |
| Spin | Singlet | |
NBO Analysis
Optimising NH3
Molecule was optimised using 6-31G (d,p) basis set and DFT with key words 'nosymm'
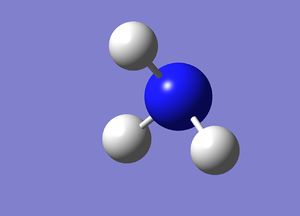
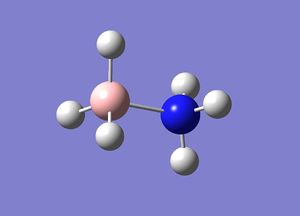
The data is given in table (n) with the molecule shown as a graphic.
The log file File:NH3 OPTIMISATION.LOG
Gaussian calculated the optimal bond lengths to be 1.00071 Å (5 d.p.) and bond angle of the H-N-H bonds to be 107.568°.
The data shown below indicates the program ran to completion indicated by the its convergence and force values.
 Item               Value     Threshold  Converged?
 Maximum Force            0.000200     0.000450     YES
 RMS     Force            0.000124     0.000300     YES
 Maximum Displacement     0.000386     0.001800     YES
 RMS     Displacement     0.000261     0.001200     YES
 Predicted change in Energy=-1.088495D-07
 Optimization completed.
Frequency Analysis
Job-type altered to frequency and C3v point group invoked. The data below a shows have optimised structure at minimum point as gradient figures are all positive.
Low frequencies ---  -30.5459   -0.0010   -0.0006   -0.0005   19.6757   28.4361
 Low frequencies --- 1089.5555 1694.1342 1694.1762
Data below shows the calculation completed.
 Item               Value     Threshold  Converged?
 Maximum Force            0.000022     0.000450     YES
 RMS     Force            0.000009     0.000300     YES
 Maximum Displacement     0.000082     0.001800     YES
 RMS     Displacement     0.000039     0.001200     YES
 Predicted change in Energy=-1.678527D-09
 Optimization completed.
Log file can be found here File:NH3 FREQUENCY ANALYSIS.LOG
Population Analysis
The population analysis was performed on the checkpoint (.chk) file of the 6-31G(d,p) optimised NH3. To perform calculation the job-type was set to 'Energy', 'Full NBO' was selected under NBO tab and the key words 'pop=full' were entered .
File can be accessed here. File:NH3 POPULATION ANALYSIS.LOG
NBO Analysis
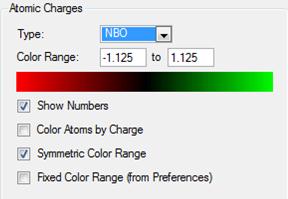
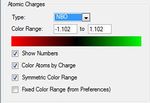
The settings for this NBO analysis are shown in figure (f)
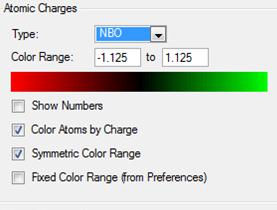
Note the charge range between -1.125 and 1.125.
The NBO graphic is shown in figure (g). Positive area is indicated by red coloration, negative area is indicated by green coloration.
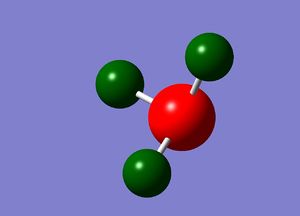
The charges on the hydrogen atoms and nitrogen atom is indicated in figure (h) with the settings in figure (i).
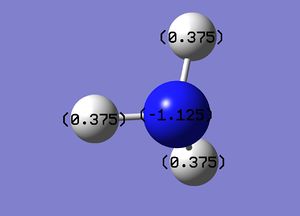
The charge on nitrogen is -1.125 the hydrogens are 0.375. Find overall charge is neutral.
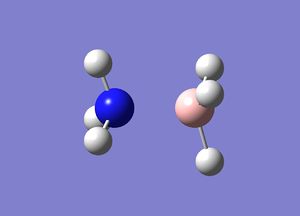
Optimising NH3BH3
Calculation ran with 3-21G basis set and DFT. Data shown in table (o).
Log file can be obtained here File:NH3BH3 OPTIMISATION.LOG
Data showing went to completion
 Item               Value     Threshold  Converged?
 Maximum Force            0.000094     0.000450     YES
 RMS     Force            0.000030     0.000300     YES
 Maximum Displacement     0.000419     0.001800     YES
 RMS     Displacement     0.000178     0.001200     YES
 Predicted change in Energy=-5.742847D-08
 Optimization completed.
Calculation ran with 6-31G (d,p) basis set and DFT. Data shown in table (p).
Log file can be obtained here File:NH3BH3 OPTIMISATION.LOG
Data showing went to completion
 Item               Value     Threshold  Converged?
 Maximum Force            0.000137     0.000450     YES
 RMS     Force            0.000063     0.000300     YES
 Maximum Displacement     0.000606     0.001800     YES
 RMS     Displacement     0.000336     0.001200     YES
 Predicted change in Energy=-1.993995D-07
 Optimization completed.
Frequency Analysis of NH3BH3
This was carried out on optimised 6-31G(d,p)NH3BH3.
The log file can be accessed here. File:NH3BH3 FREQUENCY.LOG
It is clear from results that minimum structure has formed as all positive frequencies and all low frequencies are low within the desired range..
 Low frequencies ---   -0.0007    0.0010    0.0012   17.0614   22.5052   38.4790
 Low frequencies ---  265.8155  632.3765  639.0670
In addition the calculation has completed indicated by data below.
 Item               Value     Threshold  Converged?
 Maximum Force            0.000125     0.000450     YES
 RMS     Force            0.000068     0.000300     YES
 Maximum Displacement     0.000946     0.001800     YES
 RMS     Displacement     0.000576     0.001200     YES
 Predicted change in Energy=-2.112598D-07
 Optimization completed.
Dissociation Energy Analysis of NH3BH3
| Energies of optimised structure | ||
|---|---|---|
| Molecule | Energy (au) | |
| BH3 | -26.6153236 | |
| NH3 | -56.5577686 | |
| NH3BH3 | -83.2246892 | |
From this data the dissociation energy can be extracted by calculating the difference energy between the energy of NH3BH3 and the total energy of the NH3 and BH3 molecules.
ΔE = (-83.2246892)-[(-56.5577686)+(-26.6153236)] ΔE = (-83.22468993)-(-83.1730922) ΔE = -0.05159773 au
Therefore, the dissociation energy= -135.475...= -135.5 kJ/mol (1 d.p)
The literature value was found to be -172.1 kJ/mol [5] which is significantly higher then the calculated value.
Part 2- Mini-project: Investigating Aromaticity
Introduction
In this part of the lab, a range of aromatic structures will be investigated along with their frontier orbitals using the GaussView 5.0 interface in conjunction with the HPC system.
Benzene- Optimisation and Frequency Analysis
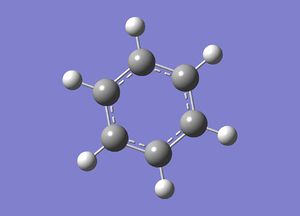
Initially, benzene was optimised using a lower basis set of 3-21G along with a DFT method and B3LYP function in GaussView 5.0. See table (r) for summary.
Gaussian calculated C-C and C-H bond lengths to be 1.397 Å and 1.084 Å respectively. The H-C-C and C-C-C bond angles were found to be 119.998° and 119.995° respectively.
Data below shows calculation went to completion.
  Item               Value     Threshold  Converged?
 Maximum Force            0.000218     0.000450     YES
 RMS     Force            0.000080     0.000300     YES
 Maximum Displacement     0.001064     0.001800     YES
 RMS     Displacement     0.000293     0.001200     YES
 Predicted change in Energy=-5.022124D-07
 Optimization completed.
LOG file for data can be found here File:BENZENE LOWER BASIS SET OPTIMISATION.LOG
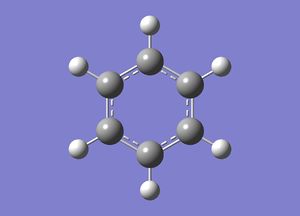
A higher basis set of 6-31G d,p was used with a DFT method and B3LYP function. This was calculated using the HPC. In GaussView 5.0 the point group of D6h was invoked by using the 'Symmetrize' function. See table (s) for summary.
Gaussian calculated C-C and C-H bond lengths to be 1.396 Å and 1.086 Å respectively. The H-C-C and C-C-C bond angles were found to be 120.000° and 120.000° respectively. Note how the higher basis set allows more accurate figures. This C-C bond length is inline with the literature value of 1.4 Å H. Burgi et al., Angewandte Chemie, 34(13), 1995, pp 1454-1456
Data below shows went to completion
 Item               Value     Threshold  Converged?
 Maximum Force            0.000053     0.000450     YES
 RMS     Force            0.000019     0.000300     YES
 Maximum Displacement     0.000113     0.001800     YES
 RMS     Displacement     0.000043     0.001200     YES
 Predicted change in Energy=-2.080108D-08
 Optimization completed.
D-space file can be accessed here. D-space file
Frequency Analysis has been carried out using the HPC with the 'Job Type' set to 'Frequency'. The results are shown below. It is clear that the first line of low frequencies are within the -15 to 15 range and the second line values are all positive. This indicates that the minimum point on PES and hence optimal structure has been reached.
 Low frequencies ---   -0.0087   -0.0041   -0.0040   12.1885   12.1885   16.1938
 Low frequencies ---  414.3302  414.3302  621.2669
| Frequency Analysis on Benzene Data | ||
|---|---|---|
| File Type | .log | |
| Calculation Type | FREQ | |
| Calculation Method | RB3LYP | |
| Basis Set | 6-31G (d,p) | |
| Final Energy (au) | -232.2582143 | |
| Gradient | 0.00003030 | |
| Dipole Moment | 0.0000 | |
| Point Group | D6h | |
| Calculation Run Time (seconds) | 1 minute 4.1 secs | |
| Charge | 0 | |
| Spin | Singlet | |
The D-space file can be accessed here [D-space file]
Data below shows calculation went to completion.
Item               Value     Threshold  Converged?
 Maximum Force            0.000071     0.000450     YES
 RMS     Force            0.000030     0.000300     YES
 Maximum Displacement     0.000104     0.001800     YES
 RMS     Displacement     0.000047     0.001200     YES
 Predicted change in Energy=-1.953831D-08
 Optimization completed.
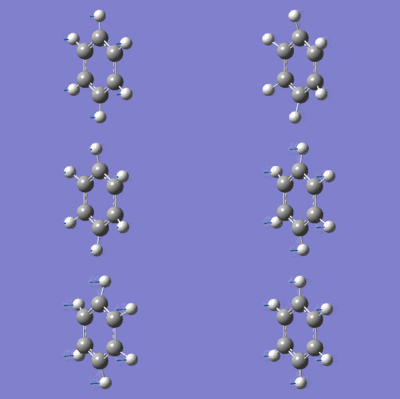
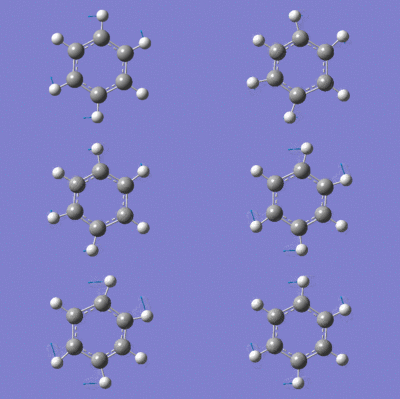
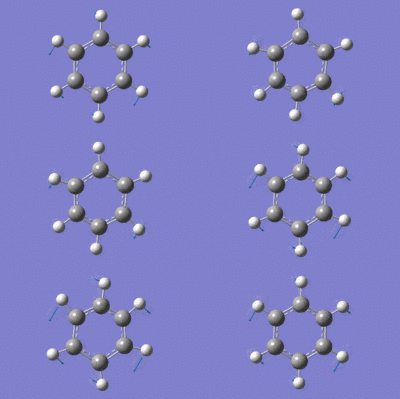
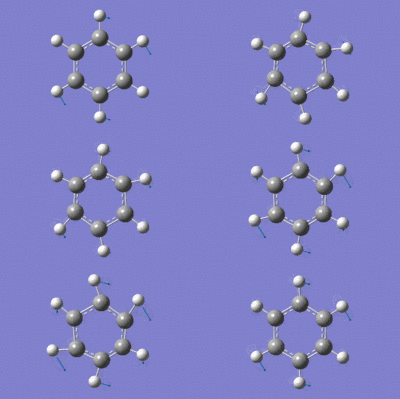
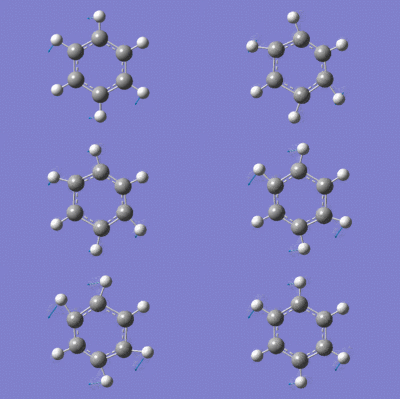
I have tabulated the vibrations with positive intensities as they correspond to certain peaks in the IR spectrum.
The predicted IR spectrum is shown in figure (j).

Only modes degenerate 694.11 cm-1, degenerate 1066.89 cm-1, degenerate 1524.89 cm-1 and degenerate 3197.61 cm-1 are intense enough to be observed on the spectrum as they undergo a change in dipole moment.
Boratabenzene Optimisation and Frequency Analysis
Boratabenzene was initially optimised using the 3-21g basis set followed by optimsation using the 6-31g (d,p) basis set.
D-space for 3-21g optimisation lower basis set optimisation
D-space for 6-31g (d,p) optimisation higher basis set optimisation
The results for the higher basis set are shown in table (u)
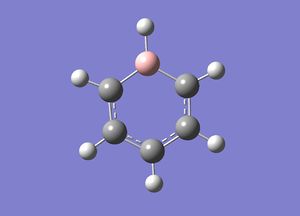
Gaussian calculated the B-H, C-H, B-C and C-C bond lengths to be 1.219 Å , 1.098 Å , 1.514 Å and 1.404/1.409 Å respectively. The bond angle for the H-C-B, H-B-C, H-C-C, C-C-C and B-C-C bonds were found to be 123.492° , 122.349° , 116.452° /117.651° , 122.055° /120.481° and 120.055° respectively.
Data showing lower basis set went to completion
  Item               Value     Threshold  Converged?
 Maximum Force            0.000346     0.000450     YES
 RMS     Force            0.000086     0.000300     YES
 Maximum Displacement     0.001611     0.001800     YES
 RMS     Displacement     0.000454     0.001200     YES
 Predicted change in Energy=-1.163652D-06
 Optimization completed.
Data showing higher basis set went to completion
   Item               Value     Threshold  Converged?
 Maximum Force            0.000057     0.000450     YES
 RMS     Force            0.000022     0.000300     YES
 Maximum Displacement     0.000284     0.001800     YES
 RMS     Displacement     0.000109     0.001200     YES
 Predicted change in Energy=-6.743951D-08
 Optimization completed.
A frequency analysis was performed. The data below shows that have calculated minimum point on PES and, hence, optimum structure as all gradients positive in second line and first line values are within the -15 cm-1 to 15 cm-1 range.
 Low frequencies ---  -12.7640   -0.0011   -0.0007   -0.0005   14.7654   18.6103
 Low frequencies ---  378.4093  409.2208  579.9641
Below is a table summarising calculation.
| Frequency Boratabenzene Data | ||
|---|---|---|
| File Type | .log | |
| Calculation Type | FREQ | |
| Calculation Method | RB3LYP | |
| Basis Set | 6-31G (d,p) | |
| Final Energy (au) | -242.6845979 | |
| Gradient | 0.00004905 | |
| Dipole Moment (D) | 2.9335 | |
| Point Group | C1 | |
| Calculation Run Time (seconds) | 1 min 56.7 secs | |
| Charge | -1 | |
| Spin | Singlet | |
Data below shows calculation went to completion.
 Item               Value     Threshold  Converged?
 Maximum Force            0.000155     0.000450     YES
 RMS     Force            0.000049     0.000300     YES
 Maximum Displacement     0.000304     0.001800     YES
 RMS     Displacement     0.000137     0.001200     YES
 Predicted change in Energy=-7.154593D-08
 Optimization completed.
D-space for frequency analysis can be found here D-space frequency analysis
Pyridinium Optimisation and Frequency Analysis
Pyridinium was initially optimised using the 3-21g basis set followed by optimsation using the 6-31g (d,p) basis set.
D-space for 3-21g optimisation lower basis set optimisation
D-space for 6-31g (d,p) optimisation higher basis set optimisation
The results for the higher basis set are shown in table
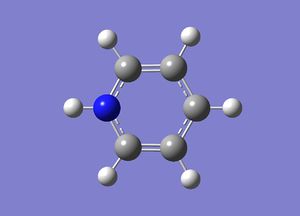
Gaussian calculated the C-H, N-H, C-C and C-N bond lengths to be 1.083 Å , 1.017 Å , 1.384 Å /1.399 Å , 1.352 Å respectively. Gaussian calculated the bond angle of the H-N-C, H-C-N, H-C-C, C-N-C, C-C-C bonds to be 118.358°, 116.835°, 123.918°/121.482°, 123.284°, 119.096°/120.029° respectively.
Data showing lower basis set went to completion
  Item               Value     Threshold  Converged?
 Maximum Force            0.000157     0.000450     YES
 RMS     Force            0.000044     0.000300     YES
 Maximum Displacement     0.000703     0.001800     YES
 RMS     Displacement     0.000226     0.001200     YES
 Predicted change in Energy=-1.817410D-07
 Optimization completed.
Data showing higher basis set went to completion
 Item               Value     Threshold  Converged?
 Maximum Force            0.000089     0.000450     YES
 RMS     Force            0.000029     0.000300     YES
 Maximum Displacement     0.000714     0.001800     YES
 RMS     Displacement     0.000220     0.001200     YES
 Predicted change in Energy=-1.131014D-07
 Optimization completed.
A frequency analysis was performed. The data below shows that have calculated minimum point on PES and, hence, optimum structure as all gradients positive in second line and first line values are within the -15 cm-1 to 15 cm-1 range.
 Low frequencies ---   -6.8709    0.0005    0.0006    0.0008   17.3103   18.3607
 Low frequencies ---  392.4993  404.0244  620.5136
Below is a table summarising calculation.
| Frequency Pyridinium Data | ||
|---|---|---|
| File Type | .log | |
| Calculation Type | FREQ | |
| Calculation Method | RB3LYP | |
| Basis Set | 6-31G (d,p) | |
| Final Energy (au) | -248.6680739 | |
| Gradient | 0.00004728 | |
| Dipole Moment (D) | 1.8720 | |
| Point Group | C1 | |
| Calculation Run Time (seconds) | 5 min 56.5 secs | |
| Charge | +1 | |
| Spin | Singlet | |
Data below shows calculation went to completion.
 Item               Value     Threshold  Converged?
 Maximum Force            0.000153     0.000450     YES
 RMS     Force            0.000047     0.000300     YES
 Maximum Displacement     0.000794     0.001800     YES
 RMS     Displacement     0.000293     0.001200     YES
 Predicted change in Energy=-1.174944D-07
 Optimization completed.
D-space for frequency analysis can be found here D-space frequency analysis
Borazine- Optimisation and Frequency Analysis
Borazine was initially optimised using the 3-21g basis set followed by optimsation using the 6-31g (d,p) basis set.
D-space for 3-21g optimisation lower basis set optimisation
D-space for 6-31g (d,p) optimisation higher basis set optimisation
The results for the higher basis set are shown in table
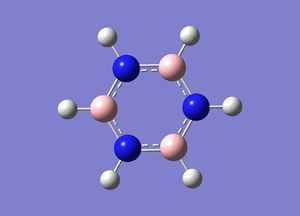
Gaussian calculated the B-H, N-H and B-N bond lengths to be 1.099 Å , 1.099 Å and 1.45 Å respectively.
Data showing lower basis set went to completion
  Item               Value     Threshold  Converged?
 Maximum Force            0.000118     0.000450     YES
 RMS     Force            0.000036     0.000300     YES
 Maximum Displacement     0.000351     0.001800     YES
 RMS     Displacement     0.000101     0.001200     YES
 Predicted change in Energy=-1.141351D-07
 Optimization completed.
Data showing higher basis set went to completion
 Item               Value     Threshold  Converged?
 Maximum Force            0.000117     0.000450     YES
 RMS     Force            0.000036     0.000300     YES
 Maximum Displacement     0.000327     0.001800     YES
 RMS     Displacement     0.000104     0.001200     YES
 Predicted change in Energy=-1.206132D-07
 Optimization completed.
A frequency analysis was performed. The data below shows that have calculated minimum point on PES and, hence, optimum structure as all gradients positive in second line and first line values are within the -15 cm-1 to 15 cm-1 range.
 Low frequencies ---  -11.0935   -0.0005   -0.0005    0.0008    8.6371   11.2571
 Low frequencies ---  288.5025  290.4106  404.0134
Below is a table summarising calculation.
| Frequency Borazine Data | ||
|---|---|---|
| File Type | .log | |
| Calculation Type | FREQ | |
| Calculation Method | RB3LYP | |
| Basis Set | 6-31G (d,p) | |
| Final Energy (au) | -242.6845979 | |
| Gradient | 0.00007128 | |
| Dipole Moment | 0.0000 | |
| Point Group | D3h | |
| Calculation Run Time (seconds) | 5 min 48.3 secs | |
| Charge | 0 | |
| Spin | Singlet | |
Data below shows calculation went to completion.
 Item               Value     Threshold  Converged?
 Maximum Force            0.000206     0.000450     YES
 RMS     Force            0.000071     0.000300     YES
 Maximum Displacement     0.000380     0.001800     YES
 RMS     Displacement     0.000137     0.001200     YES
 Predicted change in Energy=-1.381808D-07
 Optimization completed.
D-space for frequency analysis can be found here D-space frequency analysis
NBO Analysis Of Aromatics
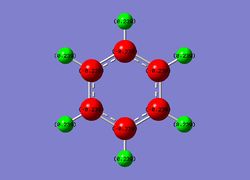
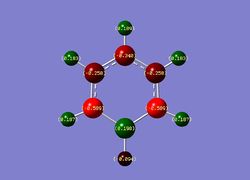
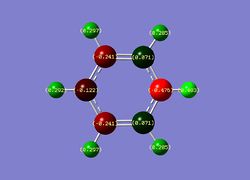
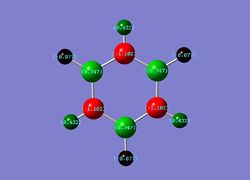
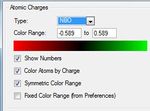
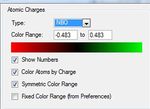
NBO (population) analysis was performed on all three aromatics using the same method as before. The charge distribution for each aromatic are compared and shown in tables below.
| Benzene | Boratabenzene | Pyridinium | Borazine |
|---|---|---|---|
 |
 |
 |
 |
| Overall charge= 0 | Overall charge= -1 | Overall charge= +1 | Overall charge= 0 |
| D-Space | D-Space | D-Space | D-Space |
 |
 |
 |
 |
From above I discuss each aromatic:-
1) Benzene- Each carbon (in red) is seen to carry same negative charge of -0.239 and each hydrogen (in green) are seen to carry charge of +0.239. These charges are cancel eachother out giving molecule no charge overall.
2) Boratabenzene- Unlike benzene, boratabenzene has an overall negative charge and an unsymmetrical charge distribution; this observation is due to the B-H unit present distorting the pi electron cloud. It is also clear from the diagram that the ortho-carbons have a higher negative charge then the para and meta carbons. This is a due to the electropositive character of the boron atom pushing negative charge onto the adjacent carbons. Finally, it is clear that the B-H units has a inverse polarity compared to the other C-H units. Again, this is due to the electropositive nature of the boron atom.
3) Pyridinium- Like boratabenzene, pyridinium exhibits a highly localises charge on the hetero atom (nitrogen charge -0.476 ). It is clear in the diagram that the ortho-carbons uncharacteristically contain a negative charge. This is due the electronegative nature of the nitrogen atom. This electronegative nature also explains the polarity of the N-H unit being analogous to the other C-H units; however, it should be noted that the polarity is greater so it can be predicted that the N-H bond is stronger then the C-H bond. Analogous to benzene, the meta and para carbon units have a charge of ca. -0.241. The charge distributions unsymmetrical nature is a result of the highly electronegative nitrogen atom and localised positive charge.
4) Borazine- Isoelectronic with benzene and, like benzene, has overall charge of 0. However, the location of charge is not symmetrical across all atoms present clearly indicated in diagram. The nitrogen has a localised negative charge (due to it's electronegativity) and boron has a positive charge (due to it's electropositivity). This observation can be related to the alternating incorporation of boron and nitrogen in the molecule invoking different charges on their adjacent hydrogens. In addition, the valency of these atoms differ between each other causing the different charges. In contrast, to boratabenzene and pyridinium, their is a symmetry in the charge distribution, hence, the overall charge of 0.
Molecular Orbital Analysis
The central part of the molecular orbital diagram of benzene is shown in figure (k). The computer generated molecular orbitals of benzene are superimposed on to the diagram.
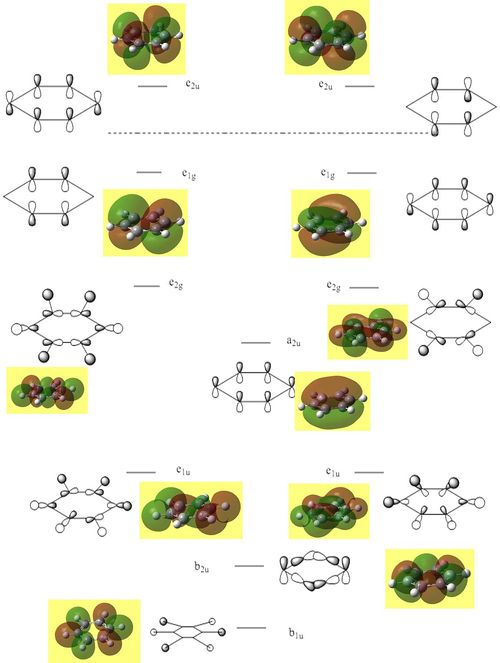
I am going to approach discussing the frontier orbitals of each aromatic by viewing the Mo diagram of benzene then comparing each HOMO and LUMO of the four aromatic species.
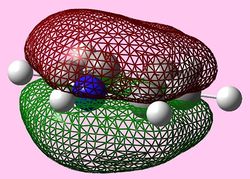
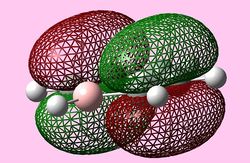
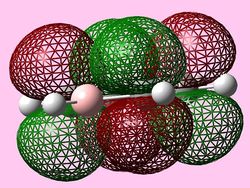
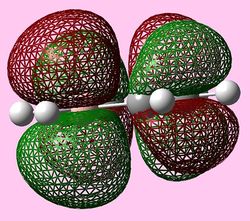
| Molecular orbital | Benzene | Boratabenzene | Pyridinium | Borazine |
|---|---|---|---|---|
| e1u (Pi1) | 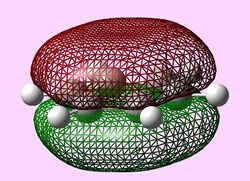 |
 |
 |
 |
| e1u (HOMO) | 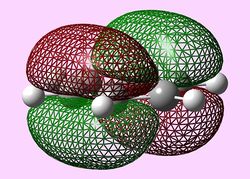 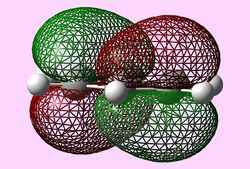 |
 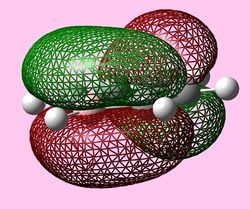 |
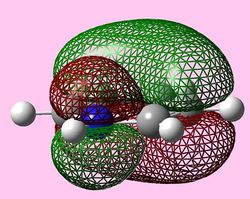 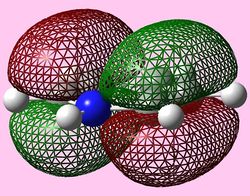 |
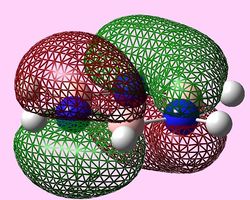  |
| e2u (LUMO) | 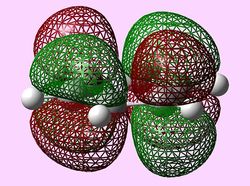 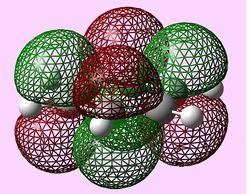 |
  |
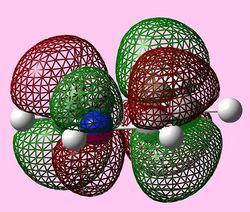 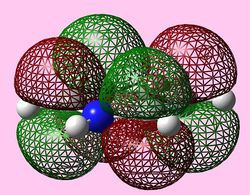 |
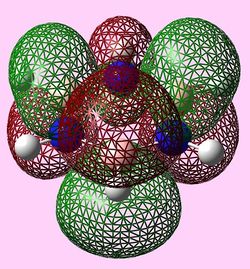 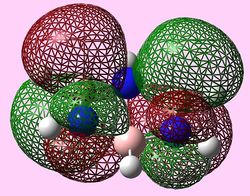 |
| b2g (Pi2) | 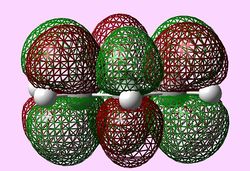 |
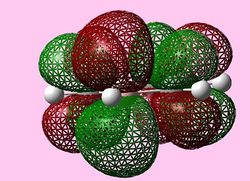 |
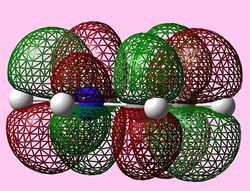 |
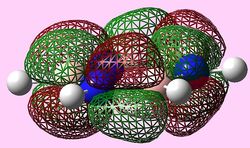 |
e1u (Pi1 and Pi2)
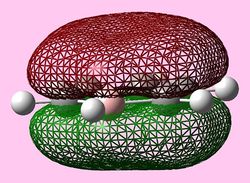
For all three aromatic systems the Pi1 orbitals have a similar symmetrical shape with delocalised clouds (rings) of electrons above and below the plane of the molecule. This MO motif is indicative of aromaticity. Benzene is a highly symmetrical form of the Pi1 orbital and acts as a good reference for the other aromatic systems as it has complete delocalisation, therefore, a high degree of aromaticity. Viewing the boratabenzene MO there is a distinct distortion in the distribution of the electron cloud with less electron density above the boron atom. This observation can be related to the charge distribution and electropositive nature of boron compared to carbon. The boron inducts electron density distorting the cloud towards the carbons atoms. It is also clear that the Pi1 for boratabenzene is higher in energy compared to benzene; this effect is related to the Pz orbital contributing on the boron being less stable then the carbon Pz contribution. Pyridinium, like boratabenzene, has a distortion of electron density onto the nitrogen atom. Again, this can be related to the high electronegativity of nitrogen compared to carbon see an attraction of higher electron density towards the heteroatom. Inverse to boratabenzene, the pyridinium Pi1 orbital is more stable then the benzene Pi1. This is due to the stability of the Pz orbital on the N atom compared to the carbon atom Pz. Like benzene, borazine is seen to be highly symmetric, however, the charge distribution in the NBO analysis tells us that their is a high localisation of negative charge throughout (on the nitrogen atom). This is a result of the alternating boron nitrogen atoms motif present. The manifestation of the nitrogen's electronegative and the boron's electropositive nature leaves the whole MO to be analogous to benzene in energy.
HOMOs
It is seen that benzene and borazine have a degenerate pair of HOMOs. This degeneracy is linked to the analogous symmetry between the MOs within the degenerate pairs. In addition, the two HOMO pairs of benzene and borazine are similar in energy; this observation is due to the MO symmetries being equivalent. Boratabenzene and pyridine have single HOMO orbitals with the other Pi symmetry orbital being slightly higher in energy. In the table both MOs have been included. This lack of degeneracy is related to the presence of the heteroatoms distorting the symmetries and energies of the MOs. For instance when viewing the pyridinium MO, the higher energy 'HOMO' has a nodal plane going through the nitrogen atom. This results in the stabilising effect from nitrogen not being present whilst the actual HOMO which has a high electron density on the nitrogen atom. The opposite is true for boratabenzene.
Boron's electron donating effects, cause the adjacent carbon atoms to be more negatively charged and have a greater electron density than the remainder carbon atoms; this is in line with the charge distributions. This is a factor contributing to the unsymmetrical electronic distributions across the molecule. The converse is seen for nitrogen where the carbons adjacent have less electron density compared to remainder carbon atoms.
The HOMO for boratabenzene is seen to be higher in energy and the HOMO for pyridinium lower in energy compared to benzene (this is explained later). All the HOMOs are similar in that they contain one nodal plane, however, the pyridinium and boratabenzene have an uneven distribution o charge in the MO.
LUMOs
The LUMOs have a similar evaluation to the HOMOs, however, the LUMOs contain two nodal planes. Like before only benzene and pyridine LUMOs are perfectly symmetrical with the hetero-aromatic boratabenzene and pyridinium molecules have a distortion in symmetry. In addition, as before, the presence of the heteroatom in boratabenzene and pyridinium causes the lack of degeneracy in the 'LUMO'.
Energies of MOs
The relative energies saw pyridinium based orbitals to be the most stable. This observation is a result of the highly electronegative nitrogen atom constricting the orbitals increasing their overlap. This stabilises the MO. Conversely, the boratabenzene is seen to have the opposite effect due to the electropositive boron atom delocalising the orbitals resulting in poorer overlap.
| Molecular orbital | Benzene | Boratabenzene | Pyridinium | Borazine |
|---|---|---|---|---|
| Pi1 | -0.36 | -0.13 | -0.64 | -0.36 |
| Homo | -0.25 | -0.03 | -0.51 | -0.28 |
| Lumo | -0.25 | 0.01 | -0.48 | -0.28 |
Ordering of MOs
As discussed above, it is clear that the relative energies of the molecular orbitals with respect to benzene can be explained by the electronegative or electropositive compared to carbon heteroatom. However, the ordering can be influenced by the addition of heteroatoms as it results in degenerate HOMOs and LUMOs in benzene being seen to be non-degenerate.
LCAOs Contributing to MOs
When forming the benzene MO diagram, there were no real complications as combinations of atomic orbitals originating from hydrogen and carbon were considered and the fact benzene is a highly symmetric molecule- D6H. On the addition of one heteroatom (boratabenzene and pyridinium) there are defects within the MOs in terms of symmetry and energy. The effect the heteroatom induces is a result of it's different size compared to carbon and hydrogen which influences the overlap of the AOs. This results in unsymmetrical MOs with a distortion in symmetry. This distortion in symmetry causes an alteration in the energy levels and degeneracy relative to benzene. In addition, MOs expected to be degenerate based on benzene will see a slight difference in energy. For borazine the all the pi energy levels are degenerate with benzene, however, the lack of a carbon framework means that the energy level distribution will be uneven and ordering different (i.e not degenerate).
Conclusion
To conclude, the NBO and MO analysis show benzene to be the most aromatic structure with highly symmetrical MOs with complete resonance. On the contrary, despite being symmetrical borazine experiences a high localisation of charge depleting the degree of delocalisation hindering the aromaticity of borazine. This observation reinforces the fatality of Huckel's theorem in judging the degree of aromaticity. The degree aromaticity of pyridinium and boratabenzene lies some point between these two extremes by containing only one hetero atom.
References
- ↑ P.Hunt; http://www.huntresearchgroup.org.uk/teaching/year3_lab_start.html
- ↑ M.R. Hartman, J.J. Rush, T.J. Udovic, R.C. Bowman and S.J. Hwang, Journal of Solid State Chemistry 2007, 180, 1298-1305
- ↑ J.Glasier, G. Johansson. On the Structures of the Hydrated Thallium (II) Ion and its Bromide Complexes in Aqueous Solution. Acta Chemica Scandinavica. 1982, 36, 125-135
- ↑ C. Ballhausen, H. Gray, Inorg. Chem. , 1 (1), 1962, pp 111-122
- ↑ Yu. Kh. Shaulov; G. O. Shmyreva; V. S. Tubyanskaya, Zhurnal Fizicheskoi Khimii, 1966, 40,122-124

