Rep:Mod:1clash
1C: Computational Lab
This is the computational part of the asymmetric epoxidation experiment, investigating the enantioselectivity of two catalysts on alkenes varying in geometry. The aim of this investigation is to obtain data on measurable data such as 1H NMR and optical rotations, to aide in determining the enantiomer present in excess, as well as revealing the reasons for the observed selectivity. Avogadro and Avogadro2 software has been adopted for molecular mechanics calculations. Gaussian was used for finding the transition states involved in the dimerisation of cyclopentadiene as well as computing a variety of spectral data. Conquest and Mercury software were adopted for literature searching and visualisation of crystallographic data respectively for both catalysts. The results obtained from calculations are not expected to fit perfectly to experimental data, and the reasons for this shall be discussed in the relevant sections.
Cyclopentadiene Dimer
Optimization of the Dimer
The cyclopentadiene unit can dimerise to yield one of two products. These products differ in the conformation, i.e. exo or endo. The reaction passes through a transition state, which differs in nature for the two conformations. The dimerisation proceeds via a [π4s+π2s] (thermally allowed) Diels-Alder cycloaddition, thus an aromatic transition state is expected. The two possible products were optimized using a MMFF94s method with the steepest descent algorithm. The output states the distribution of the total energy through a variety of mechanical contributions. The scheme showing the two possible products is shown below along with the corresponding transition states.

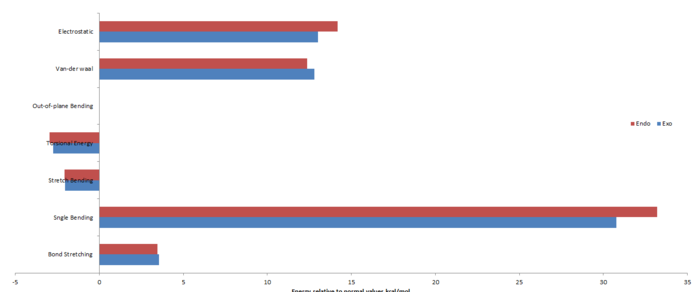
The table below highlights the contributions to the total energy for the two possible products.
Comparison of the energies draws one to the conclusion that [1]', the exo conformation, is the thermodynamic product, i.e. product of the lowest energy thus most stable. It is known that the endo product is formed preferentially, thus indicating that the reaction must be under kinetic control. The reason for this is due to Secondary Orbital Interactions, (SOI) which act to stabilise the endo transition state with respect to that of the exo conformation. These transition states are further investigated in a following section.
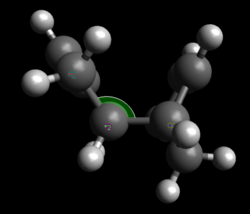
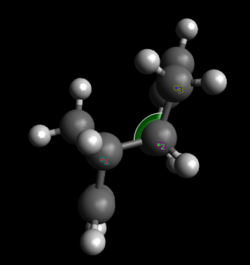
The Van-der-waals energy of the endo product is less than that of the exo product due to less of an interaction of the hydrogens (on the carbon puckered containing two hydrogens) with the other overhanging cyclopentadiene unit. The relative positions of the alkenes in both products differ significantly, this effect is reflected in the electronic energies, and i.e. the exo form has the alkenes far apart thus less of a repulsion between the π-electrons than that of the closely packed endo conformation. There is a significant degree of difference between the angle bending energy. Upon analysis of the bonds, the exo form has an angle of 114.9o between the two fragments whereas the endo has an angle of 117.8o, hence the greater angle stretching energy for endo since it is farther away from the desired 109.5o. The angle measured is shown in the thumbnail to the right.
Hydrogenation
The products can be hydrogenated, this will be shown for the endo-conformation since this is formed predominantly. Initially, hydrogenation occurs at one of the two positions, but over time the product will become saturated. The diagram below highlights the possible products from hydrogenation.
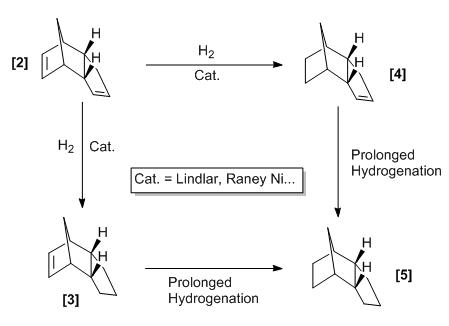
One can obtain an understanding as to which product will be favoured by considering the relative energies between the mono-hydrogenated species. The structures were optimized using the MMFF94s method with the steepest descent algorithm and the energy results are shown in the table below.
| Energies (kcal/mol) | [3]
|
[4]
|
[5]
| |||||||||
|---|---|---|---|---|---|---|---|---|---|---|---|---|
| Optimized Energy | 50.44565 | 41.25751 | 38.01467 | |||||||||
| Total Bond Stretching Energy | 3.31168 | 2.82283 | 2.68757 | |||||||||
| Total Angle Bending Energy | 31.93557 | 24.68611 | 22.64380 | |||||||||
| Stretch Bending Energy | -2.10223 | -1.65700 | -1.51556 | |||||||||
| Torsional Energy | -1.47035 | -0.37712 | 3.30165 | |||||||||
| Out-of-plane bending Energy | 0.01310 | 0.00028 | 0.00000 | |||||||||
| Van-der-walls Energy | 13.63838 | 10.63538 | 10.89721 | |||||||||
| Electrostatic Energy | 5.11949 | 5.14703 | 0.00000 | |||||||||
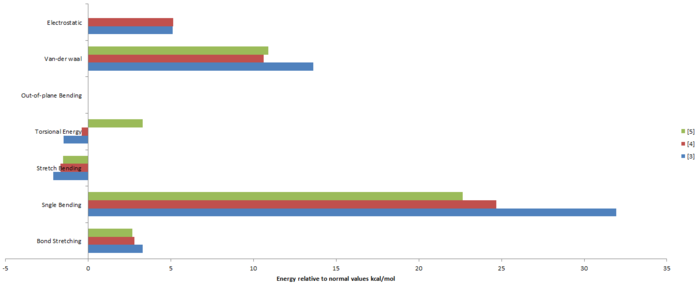
| ||||||||||||
For the case of mono-hydrogenation, product [4] is the thermodynamic product since it resides at a lower energy than [3]. A literature[1] source shows that [4] this is the major product formed and this indicates that the reaction is under thermodynamic control. The main factor to the difference in energy is the placement of the double bond itself. In [3] the double bond is in the norbornene ring, this ring is already relatively strained and the addition of a double bond further increases the angle bending energy. The angle bonding term is further affected by steric repulsion between a hydrogen and the overhanging alkene in [3] which is not present in [4] . The next major contribution is from the van-der-waals energy. Product [4] has more attractive interactions than [3] due the separations of the hydrogens being at an attractive distance (approximately 2.4 A corresponds to an attractive interaction). Hence [4] has more favourable interactions (negative contribution to total energy). Focusing on the regions containing the double bond, the hydrogens on the carbon atoms adjacent to the double bond are eclipsed in [3] but staggered in [4]. The former resulting in an increase in bond stretching and out of plane bending. The torsional energy of the thermodynamic product is larger than [3], this can be seen in the diagram above as being due to there being a greater number of eclipsed hydrogens in [4].
Another observation is that the saturated product resides at an even lower energy to that of [4]. This poses the question of why does [4] not quickly hydrogenate again to yield [5]. This can be explained by comparison of the changes in energy. The thermodynamic product, [1], can be hydrogenated to yield [4] with a difference in energy of 14.11591 kcal/mol. A subsequent hydrogenation of [4] to yield [5] has a difference in energy of 3.24284 kcal/mol. One can see that there is a greater change in total energy for the first hydrogenation that the second, hence it is not as favourable as the first hydrogenation.
Another interesting feature of the saturated product is the electronic energy contribution having a value of zero. This feature has the largest contribution to the decrease in energy of the system. This is due to the loss of the alkene functionality thus loss of π-character. This effect out-weights the increasing Torsional energy and Van-der-waals energies resulting from more H-H repulsions(hydrogenated product contains more hydrogen atoms that the mono-hydrogenated product).
Transition States
Energetics
Gaussian was used to probe the transition states of the two possible conformations regarding the dimerisation of cyclopentadiene. The Hessian method was used due to the relative simplicity of the system, i.e. the initial guess of the transition state is easily accomplished. The calculation was set to optimize to a transition state (berny). A stationary point of the potential energy surface corresponds to either a ground state or a transition state. The second derivative, i.e. the force constant corresponds to the nature of the stationary point. If negative then we are dealing with a transition state, and a frequency calculation will yield an imaginary vibration. Below is the summary table of the calculation along with the corresponding log file. (Note: The system was optimized in a step-wise manor, i.e. for a low basis set to a higher one in order to reduce computational cost)
The determination of the exo-transition state using the DFT B3LYP method with the 6-31G(d) basis set proved successful. The endo-TS on the other hand proved difficult to obtain. For the DFT B3LYP method with the STO-3G basis set, a synchronous motion mimicking that of the expected concerted bond formation existed. However, upon optimization with the 6-31G(d) basis set, the result changed significantly. The imaginary vibration indicated the formation of one bond, not the expected two bond formation. This behaviour has also been spotted by Prof. Rzepa, where the conclusion is that a non-concerted transition state exists (asynchronous bond formation)[2]. A second transition state could be investigated which may correspond to the second bond formation. It is highly likely that the energy of the two transition states is similar due to a very small rearrangement in molecular structure. This is assumed to be the case in this report.
| Property | Value | Value |
|---|---|---|
| Log File | [Exo-Log] | [Endo-Log] |
| File Name | PROD_TS_hf_noeigen_other_dft_631_d | PROD_TS_HF_NOEIGEN_DFT |
| File Type | .log | .log |
| Calculation Type | FTS | FTS |
| Calculation Method | RB3LYP | RB3LYP |
| Basis Set | 6-31G(d) | 6-31G(d) |
| Energy | -388.16672928 a.u. | -388.17124190 a.u. |
| RMS Gradient Norm | 0.00000475 a.u. | 0.00000297 a.u. |
| Dipole Moment | 0.39 D | 0.041 |
| Point Group | C1 | C1 |
| Job Time | 24 Minutes and 19.0 Seconds | 52 Minutes and 11.0 Seconds |
| Item Table | Item Value Threshold Converged?
Maximum Force 0.000003 0.000015 YES
RMS Force 0.000000 0.000010 YES
Maximum Displacement 0.000030 0.000060 YES
RMS Displacement 0.000006 0.000040 YES
Predicted change in Energy=-3.838304D-11
Optimization completed.
-- Stationary point found.
|
         Item               Value     Threshold  Converged?
 Maximum Force            0.000008     0.000450     YES
 RMS     Force            0.000001     0.000300     YES
 Maximum Displacement     0.000706     0.001800     YES
 RMS     Displacement     0.000129     0.001200     YES
 Predicted change in Energy=-3.252293D-09
 Optimization completed.
    -- Stationary point found.
|
The optimised energies shown that the transition state for the endo product is lower in energy than the exo product. The energy difference corresponds to a value of 2.83 kcal/mol. This shows that the endo product is the kinetic product since the starting materials have equal energy for both possible conformation. Due to the lower activation barrier for the endo product, it is formed predominantly indicating that the reaction is under kinetic control.
The log files are given for both the [exo] and [endo] transition state.
| Exo | Endo |
|---|---|
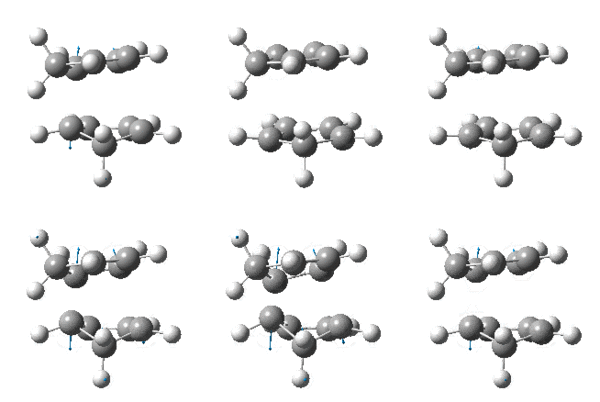 |
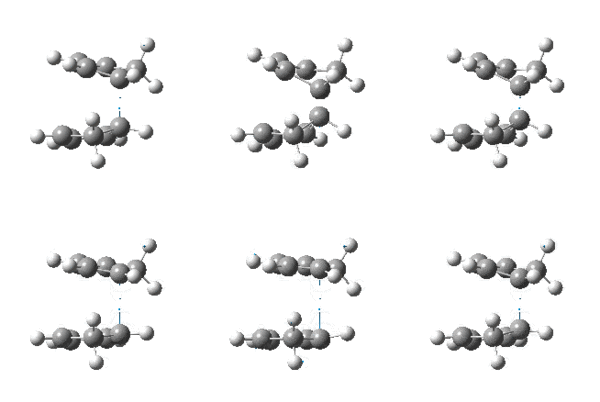
|
| -457 cm-1 | -377 cm-1 |
 |
|
 |
 |
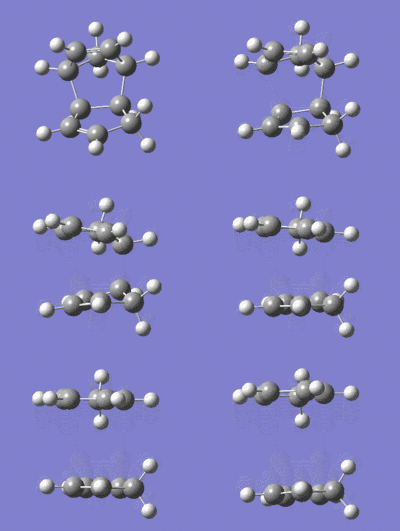
From the IRC path shown above, it appears that both dimerisations occur asynchronously. This is a fairly stunning result as it is often commonly said that these reactions should proceed concertedly and synchronously. The reason for this deviation may be due to the CH2 group being arranged non-symmetrically, thus resulting in more hindrance on one side of the transition state than the other. Observing the plots of the IRC path, it appears that the endo transition state has a double hump, possibly suggesting a second transition state being present. There is also a greater rearrangement in the geometry of the product for that of the endo transition state compared to the exo.
There has been much discussion as to why there is a general preference for the endo-product from cyclo-additions. A well-known suggestion is the presence of secondary orbital interaction (SOI) between the two fragments that are present in the endo and absent in the exo product. This idea was first put forward by Woodward and Hoffmann[3]. The orbital overlap is thought to stabilise the transition state of the endo conformation. The diagram below highlights the suspected orbital overlap.
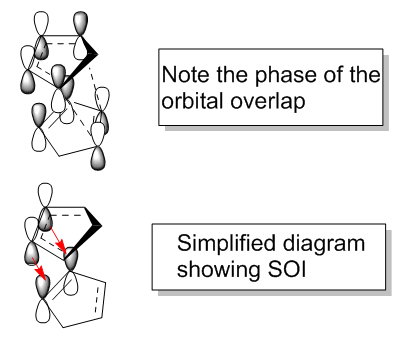
The overlap is between the HOMO of one of the cyclopentadiene molecules and the LUMO of the other.
If this is suspected to be the case, it is thought that the appearance of this orbital overlap would manifest in the population analysis of the transition state.
Aromatic Character
Finally, the transition state is stated to be aromatic. A neat method available to probe this claim is that of the Nuclear-Independent-Chemical-Shift (NICS). This involves the specific placement of a ghost atom which does not interact with the system itself, then preforming an NMR calculation and observing the shielding experienced by the ghost atom. The negative of the shielding value is recorded and a general rule of thumb is a value smaller than -7 ppm corresponds to aromaticity. A question is raised about the appropriate placement of the ghost atom, for a planar system like benzene, furan, pyrrole... the standard procedure is placement 1 A above the centroid of the ring. This distance has the effect of minimising shielding due to the σ-framework. For the case of a non-planar system, literature shows numerous preferences to placements, and in the case of this report it shall be place in between the new bond forming terminals.
NICS of Exo
The investigation into the aromaticity of the TS of the Exo product by the NICS method correctly identifies an aromatic transition state. The placement of the NICS probes is shown in the thumbnail to the right, along with the corresponding numbering.
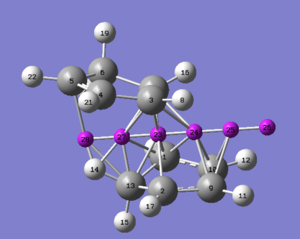
It is evident that the region of highest shielding is in the plane of the transition state, however due to the close proximity of the standard sigma-framework probes were place either side as to reduce this factor. The probes are places 1 A apart from one another, in both directions. The value for probe 24 is more negative than that of probe 27. The reason for this is likely due to the close proximity of the C=C orbitals, giving a larger shielding effect. The values of -14.5 and -13.0 ppm are clear signs of aromaticity, these values approach zero when sufficiently far from the centre, i.e. probe 26. The log file can be found [here].
| NICS Probe | Isotropic shielding (ppm) |
|---|---|
| 23 | -24.3 |
| 24 | -14.5 |
| 27 | -13.0 |
| 28 | -6.8 |
| 25 | -7.0 |
| 26 | -1.4 |
NICS of Endo
As the vibrational analysis determined that this reaction does not proceed synchronous, it is expected that the transition state shows reduced aromatic behaviour than that of the exo-TS.
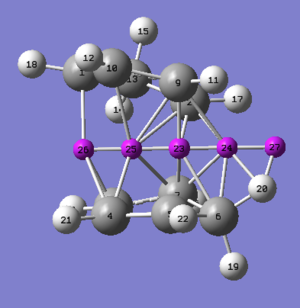
The results below show there is still aromaticity associated with the transition state. Probes 25 and 26 show a relatively large negative value than that would be expected, an explanation is the high density of π-electrons in this region of the molecule. A better representation would be to use probe 24 as it is dominant upon the delocalisation of electrons in the transition state alone. The NICS value of -7 ppm (for probe 24) can still be considered aromatic, see reference for similar calculations[4]. The log file can be found [here].
| NICS Probe | Isotropic shielding (ppm) |
|---|---|
| 23 | -23.0 |
| 24 | -7.0 |
| 25 | -21.7 |
| 26 | -12.8 |
| 27 | -1.9 |
With the data collected in this section, it appears that the degree of aromaticity in the Exo-transition state is larger than that of the exo, further supporting the claim that the reaction proceeds asynchronously.
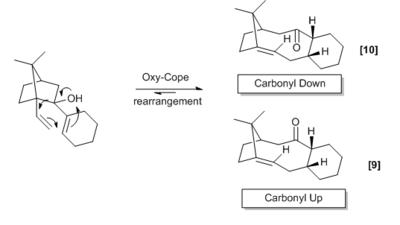
The molecule understudy in this section is an intermediate in the synthesis of Taxol. This molecule can be formed by an oxy-cope rearrangement[5]. The ketone has the possibility of pointing up or down, and lead to a different energy associated with each molecule. Atropisomerism is isomerism caused by the hindered rotation about a single bond due to a high barrier of rotation, this could be due to that of steric or electronic origin. A significantly large temperature may eventually permit rotation about the bond, for most of the time, the configuration of the isomer will be locked. This type of isomerism is exhibited in the taxol intermediate shown below. The ketone can either be point up or down, the rotation is hindered due to the bridge head carbon (tertiaryC-secondaryC).
Since the rearrangement is in equilibrium, we expect that the thermodynamic product is formed. This is because the kinetic product will be equilibrating to a larger degree than the thermodynamic product (energy difference between transition state and product for the kinetic case is smaller) thus we should experience a build-up of the thermodynamic product. The 5-membered ring prefers to adopt a puckered position, 6-membered rings tend to adopt a chair conformation as this reduces torsional strain[6]. There is also the central ring of the intermediate, a 10-membered ring. Due to the relatively large size of the 10-membered ring, it is not as conformationally demanding as the two smaller rings. The presence of a bridgehead satisfies the 5-membered ring, happily adopting the favoured puckered envelope position. The cyclohexane has four energy minimums (ground states), those being 2 chair conformations and 2 twist-boat conformations and it is this ring that dictates the overall energy of the system (shown in the adjacent diagram). The different conformations of the cyclohexane region are shown below for both the ketone pointing up and down. The optimization below uses the MMFF94s method with the steepest descent algorithm.
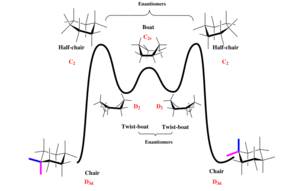
If one so wished, the transition states corresponding to half-chair and the boat conformation could be computed in Gaussian, by specifying that the optimisation is to a transition state.
| Energies (kcal/mol) | ||||
|---|---|---|---|---|
| Optimized Energy | 82.75980 | 70.54312 | 88.38067 | 77.90591 |
| Total Bond Stretching Energy | 8.40720 | 8.80449 | 8.28812 | 7.98254 |
| Total Angle Bending Energy | 33.73810 | 28.27826 | 33.93661 | 30.14016 |
| Stretch Bending Energy | 0.09118 | -0.07768 | 0.10173 | -0.03854 |
| Torsional Energy | 3.32618 | 0.24842 | 6.24685 | 2.86207 |
| Out-of-plane bending Energy | 1.59228 | 0.97042 | 1.58871 | 0.95667 |
| Van-der-walls Energy | 35.40601 | 33.14687 | 37.48407 | 35.71168 |
| Electrostatic Energy | 0.19886 | 0.30162 | 0.21822 | 0.29132 |
It is evident that a chair conformation produces the most stable structures for the case where the carbonyl is pointing up. This is not that surprising as the chair conformation experiences little to no torsional strain (as the hydrogens are staggered and no flag-pole interactions like those experienced in the boat conformation). The key difference in the energy of the chair and twist boat a structure originates from the torsional energy and the van-der-waals energy. The Chair2 conformation has the lowest energy for the case where the carbonyl is pointing upright. Another striking observation is that Chair1 is higher in energy than Twist-Boat2. Comparison of the energy distribution shows that the difference is primarily due to the angle bending energy of chair1 being significantly higher than the twist boat.
| Energies (kcal/mol) | ||||
|---|---|---|---|---|
| Optimized Energy | 60.55007 | 74.74689 | 66.32128 | 68.87482 |
| Total Bond Stretching Energy | 7.58736 | 8.77792 | 7.73381 | 7.81786 |
| Total Angle Bending Energy | 18.81215 | 22.22147 | 19.59535 | 21.15923 |
| Stretch Bending Energy | -0.14194 | -0.18108 | -0.05823 | -0.06117 |
| Torsional Energy | 0.24006 | 5.38979 | 3.18308 | 4.44930 |
| Out-of-plane bending Energy | 0.84321 | 1.64943 | 0.84537 | 0.93983 |
| Van-der-walls Energy | 33.26281 | 36.48138 | 35.06720 | 34.61518 |
| Electrostatic Energy | -0.05359 | 0.40798 | -0.04530 | -0.04542 |
The data above once again indicates that a chair conformation gives the lowest energy. Comparison of Chair1 to Chair2 shows that there is a relatively larger difference between the torsional energy, approximately 5 kcal/mol. In this case where the carbonyl is down, chair1 has the lowest energy with the key differences in energy be that of the van-der-waals, torsional and angle bending energy.
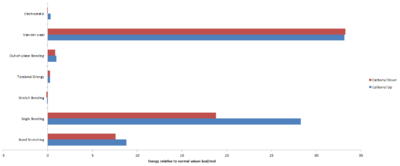
The isomer which has the carbonyl group pointing down has the lowest energy. There is an energy difference between the lowest energy forms of the two conformations of the carbonyl of 10.0 kcal/mol. This yields an equilibrium constant of 2.1×10⁷, indicating that this lowest energy conformation dominates.
Hyperstability
Similar to that of the hydrogenation of the cyclopentadiene-dimer, the hydrogenation of the intermediate was also investigated. In this case the alkene is bonded to a bridgehead, i.e. an sp2 carbon. Since the 5-membered ring has preference for the puckered conformation, it imparts a significant amount of strain on the region, which could be relieved if the carbon could become sp3 (hence hydrogenation). This is Bredt's rule[8] which states that it is unfavourable to have a double bond to a bridgehead carbon, unless the size of the ring is sufficiently large. This 10-membered ring is large enough that angle strain and torsional strain is reduced. The energy contributions were calculated using the MMFF94s Force field using the steepest descent algorithm. It can be seen that the energy of the saturated product is higher than that of the alkene, thus contradicting Bredt's rule. It is apparent that there is a significant increase in the angle bending energy and the torsional energy of the saturated product.
If one considers the hydrogenation happening in a two stage process, a hydrogen would initially add to the secondary carbon atom, resulting in a tertiary carbocation intermediate (normally a tertiary carbocation would be stabilised by hyperconjugation into the vacant p-orbital). This carbocation is sp2 hybridised and prefers a planar geometry. This cannot be achieved however due to the constrained geometry imparted by the 5-membered ring adopting the puckered conformation thus the high angle bending energy. This bridgehead double bond in effect stabilises the molecules, rendering it non-reactive to specific reactions which involve the destruction of the C=C. This phenomena is known as hyperstability [9], the double bond relieves some of the strain, and the sp2 centre of the double bond is less congested than an sp3 centre. This is the reason why this molecule reacts slowly.
Notice again that the electronic energy of the saturated system is zero due to the absence of the double bond.
| Energies (kcal/mol) | |
|---|---|
| Optimized Energy | 73.74773 |
| Total Bond Stretching Energy | 7.28464 |
| Total Angle Bending Energy | 25.90915 |
| Stretch Bending Energy | 0.20439 |
| Torsional Energy | 6.87016 |
| Out-of-plane Bending Energy | 0.10252 |
| Van-der-walls Energy | 33.37687 |
| Electrostatic Energy | 0 |
Spectroscopic Simulation using Quantum Mechanics
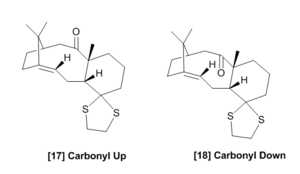
Another intermediate in the taxol formation has been investigated. Both molecules(as well as the twist boat conformation of [18]) were subject to an optimization and frequency analysis using the DFT B3LYP method and the 6-31G(d,p) basis set. The free energies for each form are given in the table below. Since the chair conformation of structure 18 (carbonyl in the down position) has a lower energy, further analysis shall be done on this conformation.
| Energies (kcal/mol) |
|
||
|---|---|---|---|
| Sum of Electronic and Thermal Free energy (Hartree) | -1651.463258 | -1651.377838 | -1651.440166 |
| Log files | [Log] | [Log] | [Log] |
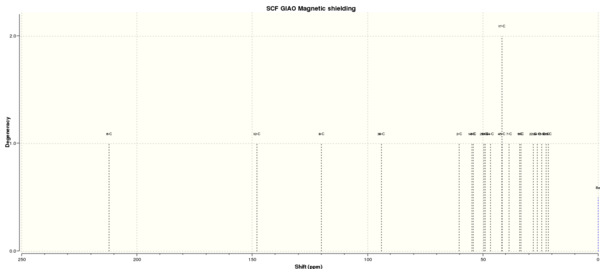
Gaussian was used to predict the 1H NMR spectra along with the 13C spectra using the DFT B3LYP method and a 6-31G(d,p) basis set. The calculation involved the Optimisation, frequency analysis and computation of NMR using chloroform as the solvent. The spectra are shown below along with plots of deviations from literature values. Numerous conformations of the taxol derivative are possible, each of which would give a slightly different NMR spectrum.
The data for the NMR calculations can be found here[Log]
 |
Computed δ(ppm) | Reported[10] δ(ppm) | 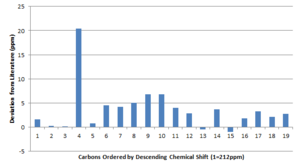 |
|---|---|---|---|
| 212.12 (1C) | 211.49 | ||
| 147.97 (1C) | 148.72 | ||
| 120.04 (1C) | 120.9 | ||
| 94.01 (1C) | 74.61 | ||
| 60.32 (1C) | 60.53 | ||
| 54.78 (1C) | 51.30 | ||
| 54.09 (1C) | 50.94 | ||
| 49.58 (1C) | 45.53 | ||
| 49.04 (1C) | 43.28 | ||
| 46.67 (1C) | 40.82 | ||
| 41.69 (2C) | 38.73 | ||
| 38.63 (1C) | 36.78 | ||
| 34.03 (1C) | 35.47 | ||
| 33.54 (1C) | 30.84 | ||
| 28.05 (1C) | 30.00 | ||
| 26.36 (1C) | 25.56 | ||
| 24.44 (1C) | 22.21 | ||
| 22.52 (1C) | 21.39 | ||
| 21.61 (1C) | 19.83 |
As one can see from the data above, the computed chemical shifts of the 13C NMR spectrum are in reasonable accordance with literature. It is worth noting that the original NMR calculation was done using a CPCM solvent model with the solvent set as chloroform. The literature cited adopts C6D6 as the solvent, thus a correction was applied shift values. There is generally a superb agreement between the data for large ppm. The peak at 94.01 ppm however shows an astounding deviation from literature, in which the literature shows a more shielded carbon environment. The carbon atom that this shift corresponds to is that which incorporates the dithiol compound into the cyclohexane ring. The cause of this deviation was narrowed down to the effects of the sulphur atoms themselves. If one looks at the two carbons adjacent to these atoms, there is also a deviation. The problem lies in the method and basis set adopted, sulphur is larger than the carbon atoms, and has more diffuse orbitals. This results in an increase in spin orbit coupling which is probably not well represented by this combination of method and basis set. A further calculation using a different method, i.e. MP2 may show data that more closely resembles that of literature. The bond length of the S-C-S was also looked into, the optimized molecule has the bond length of 1.87 A whereas literature shows the longest being 1.82 A[11]. Thus this supports the claim that the sulphur is not being properly represented in the current basis set.
A further calculation was done locally using the same basis set, but with a LanL2DZ pseudo-potential for both sulphur atoms. It was hoped that this may result in better correspondence to that of literature due to a better representation of the sulphur atoms while reducing the computational cost. The results however fared no better than those stated.
The other small deviations can be the combined result of other conformations being present (i.e. other chair forms previously explored in small abundance leading to a broader spectrum thus inaccuracy in assigning a shift value), inaccuracies in experimental NMR techniques.
To conclude, it has been shown that an inexpensive calculation can be used to reproduce experimental data that are in relatively good accordance. This proves useful in cases where new molecules are being made and there exists no prior experimental data for comparison. Another, more subtle use of this data is in identifying the true preferred conformation. If every possible conformation had its corresponding NMR spectrum identified, a comparison could be made in order to find which conformation(s) closely resemble that of the experimental data. A brief conversation with Prof. H. Rzepa stumbled upon the idea of scouring the data repository used for this lab, collecting every students NMR data and analyse to find the preferred conformations by comparison with literature.
 |
Computed δ(ppm) | Reported[10] δ(ppm) | 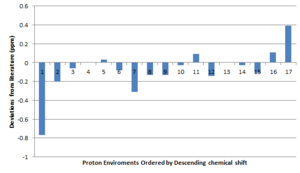 |
|---|---|---|---|
| 5.98 (1H) | 5.21(m, 1H) | ||
| 3.20 (2H) | 3.00-2.70 (m, 6H) | ||
| 3.06 (1H) | 3.00-2.70 (m, 6H) | ||
| 2.97 (1H) | 3.00-2.70 (m, 6H) | ||
| 2.78 (3H) | 3.00-2.70 (m, 6H) | ||
| 2.66 (1H) | 2.7-2.35 (m, 4H) | ||
| 2.48 (3H) | 2.7-2.35 (m, 4H) | ||
| 2.33 (1H) | 2.20-1.70 (m, 6H) | ||
| 2.23 (1H) | 2.20-1.70 (m, 6H) | ||
| 2.01 (3H) | 2.20-1.70 (m, 6H) | ||
| 1.84 (1H) | 2.20-1.70 (m, 6H) | ||
| 1.58 (4H) | 1.58 (t, 1H) | ||
| 1.28 (3H) | 1.50-1.20 (m, 3H) | ||
| 1.21 (1H) | 1.10 (s, 3H) | ||
| 0.96 (3H) | 1.07 (s, 3H) | ||
| 0.64 (1H) | 1.03 (s, 3H) |
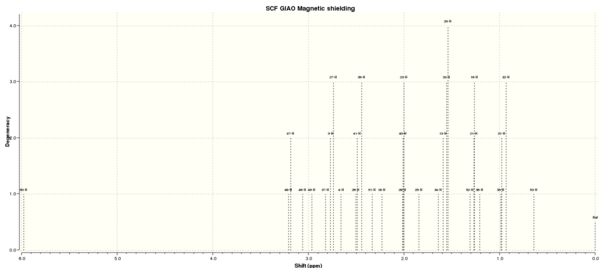
The 1H NMR spectrum is generally in accordance to literature. There are some small deviations in the chemical shift values which could possibly be minimized by changing method and basis set. The population of the environments for the methyl groups shows is in poor correspondence with literature. The reason for this is in the way that Gaussian treats the molecule, it assumes it is stationary, i.e. no fluctional processes are occurring. As a result the proton environments are not expressed correctly. A prime example of this is the 1H NMR of propane which is expected to show two environments. Another problem that manifests is the treatment of solvation, especially that of hydrogen bonding solvents. If one wishes to obtain a detailed account of solvent interactions, several calculations are required with each one differing in the placement of the solvent molecules about the molecule. This solution can be applied to that of the proton environments, i.e. produce several conformations that differ in rotation about the methyl C-C bond and averaging the results.
The most deshielded environment has been correctly predicted as the allylic proton, however the chemical shift shown clear deviation from literature. A possible reason for this could be due to the basis set used. It contains both d and p polarisations, these give the carbon orbitals some d-character and the hydrogen orbitals some p-character. Addition of more polarisation terms should give a better account of the experimental observations. Furthermore the π-bond aids in deshielding of this environment and might not be fully accounted for in the basis set or even bulk interactions with the solvent may account for this large deviation. The protons on the dithiol ring show deshielding due to the electro-negative sulphur atom. The protons adjacent to the carbonyl also show a differences in environment as would be expected from the π-density, i.e. the proton situated over the carbonyl bond itself is considerable more shielded than the proton on the same carbon that lies in the plane of the carbonyl (i.e. ring current from the π-electrons).
To conclude the proton NMR, the calculations show reasonable agreement to that of the literature in terms of the chemical shift, but poor agreement for the degeneracy. Further study into the spin-spin coupling could be investigated but is a lot more computationally expensive.
Part 2: Asymmetric Epoxidation
Two catalysts will be investigated in this section, the Jacobsen and Shi catalysts. The former is comprised of a manganese atom coordinated to by a salen ligand, a chlorine atom and a carbonyl. This is the activated catalyst. The activated form of the Shi catalyst involves the carbonyl being converted into a dioxirane, which can subsequently react with an alkene, forming an epoxide. The Shi catalyst is an example of an organic catalyst, also containing a carbonyl in the pre-catalyst form, being turned into an oxirane (active form). The transition states involved dictate the observed selectivity and will be subsequently probed. It is also important to consider the type of alkene being used, that being its geometry and position in the molecule.
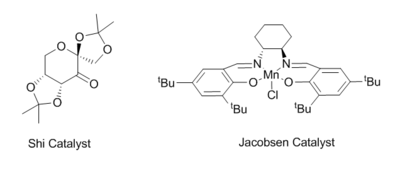
It is known that the Shi catalyst produces high a enantiomeric excess, (ee), for alkenes adopting the trans geometry whereas the Jacobsen catalyst operates best for cis-alkenes. The features that determine this selectivity will be investigated in this section. This will be done by considering the cases of poorer selectivity (i.e. the Shi catalyst with cis-alkenes), approaching the problem in the opposite direction as the majority of the literature.
A possible method for determining the enantiomeric excess is by addition of a NMR shift reagent to the sample. Chiral shift reagents such as Eu(hfc)3 can be used to determine what enantiomer is in excess, and also valuable information on the enantiomeric excess (ee). The reagent specifically binds to one enantiomer. This has the effect of either shielding or deshielding the environment close to the binding site. In the case of the epoxides, the oxygen would bind. This results in a shift one or more NMR peaks, revealing two peaks (initially overlapping). The spectra can be integrated and the enantiomeric excess can be calculated. The experimental results obtained in the synthetic lab (1S) correctly exhibited the peaks of the enantiomer separating when the reagent was added, however integration gave rise to error due to noise and some minor impurities. It may be possible to carry out calculations to see the effect but the presence of a lanthanide and the large ligand on the NMR peaks but would require costly methods, far beyond the resources available for this lab.
Crystal Structure of the Catalysts
The Shi-Catalyst
The crystal structure of the Shi-catalyst, NELQEA was found using Conquest Software and visualised in Mercury. The unit cell contains two of the catalyst molecules. The key features of this catalyst is the ketone (which becomes a dioxirane when the catalyst is in its active form), and two acetal protecting groups. These protecting groups are arranged in such a way as to provide chiral control when reacting with the alkenes by the steric arguments involving the outlying methyl groups. The 5-membered ring adopts a puckered conformation while the central 6-membred ring adopts the favourable chair conformation.
The standard bond length of C-O (ether) is 1.420 A[12]. The table below shows the C-O bond lengths present in the Shi-catalyst. It is evident that some of these bonds are much less than that of the literature, this suggest there may be some stereoelectronic effects at work, namely anomeric effects. The origin of these effects come from the anti-periplanar donation of a lone pair of electrons on a heteroatom (oxygen) into an adjacent unoccupied orbital (σ*C-O) resulting in a net stabilisation. Thus the oxygen situated in the 6-membered ring encourages the adjacent oxygen (O2) into an axial position as to maximise the overlap. This effect must be relatively strong since occupation of axial positions results in increased 1,3-diaxial repulsions.
The C4-O4 is relatively short implying the anomeric effect, this claim is supported by the fact that the adjacent C10-O4 is elongated due to the occupancy of the σ*C-O orbital. This is also the case for C7-O2 lengthening while the adjacent C2-O2 shortens. C2-O2 and C2-O6 also show a shortening, however the anomeric effect can be thought of as acting in both directions, which would result in cancellation. There is not a perfect overlap due to the 5 membered ring forcing a puckered geometry. A rationalisation could be drawn due to close proximity of the carbonyl, protons at an alpha position are rendered acidic due to the inductive effects of the carbonyl, and thus electron density may be pulled from this carbon making it δ+. As a result of less occupancy of the σ* orbitals, thus a shortening of the bond. The fact that the alpha carbon on the other side also experiences a shortening (shortest C-O bond in molecule, C4-O4) supports this claim. The carbon-oxygen double bond has a normal bond length of 1.197 A. It is also worth noting that the anomeric effect also aids in reducing the overall dipole of the molecule due to the lone pairs on the oxygen being orientated in an near 180o manner.
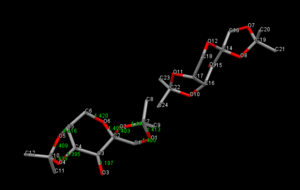
| Bond | Bond Distances (A) |
|---|---|
| C10-O5 | 1.409 |
| C5-O5 | 1.416 |
| C10-O4 | 1.439 |
| C4-O4 | 1.395 |
| C6-O6 | 1.420 |
| C2-O6 | 1.403 |
| C2-O2 | 1.403 |
| C7-O2 | 1.441 |
| C7-O1 | 1.413 |
| C1-O1 | 1.400 |
The Jacobsen Catalyst
The Jacobsen catalyst consists of a Mn(+3) centre coordinated to by a salen ligand. The salen ligand is a diastereomer, the chiral centres are located in the diamine region, and play a crucial role in the selective properties of the catalyst. There are also highly bulky tertiary-butyl groups (tButyl) which act as steric barriers preventing approach from specific directions. It is primarily the combination of the these bulky groups along with the diastereomeric amine region which accounts for the selectivity.
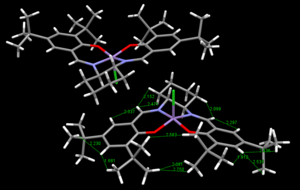
Two crystal structures of the Jacobsen catalyst were found which differed in the orientation of tertiary butyl groups on different phenyl rings, TOVNIBO1 and TOVNIBO2(both of which contained two molecules in the unit cell). Conquest software was used in the crystal structure search and Mercury software for the visualisation and measurements of separations and angles.
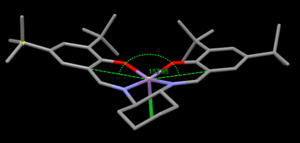
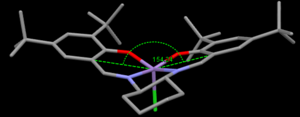
The curvature of each structure was analysed and shown in the thumbnails. TOVNIBO2 has the staggered conformation of the tButyl groups which can be achieved by altering the depth at which the phenyl rings reside relative to each other. As a result of this, the separation between the tButyl groups show some degree of favourable van-der-waal attraction (<210 A corresponds to repulsion, >240 A corresponds to attraction). All the separations are in accordance with a favourable interaction. This attraction holds the catalyst in this conformation which is desired otherwise changes would result in poor selectivity. TOVNIBO1 has the tButyl groups in the eclipsed conformation this results 3 attractive and 1 repulsive H-H interaction.
The curvature of the catalyst is greater for that of TOVNIBO2. This is due to a combination of both the non-planar diamine group along with the favourable interactions of the previously mentioned tButyl groups.
The degree of curvature also affects the energetics of the site where the chlorine resides, making the Mn-Cl interaction weaker.
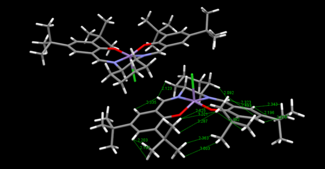
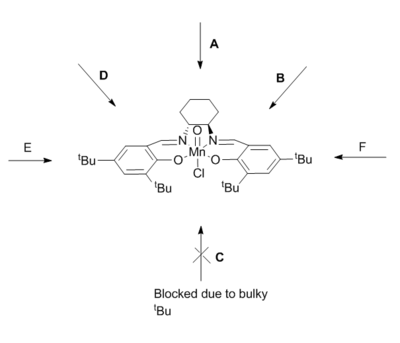
The figure above shows possible approaches of the substrate to the catalyst. As seen in the crystal structure the bulky tButyl groups at the position C points too is large enough as to block this approach. Studies have been done into investigating the true trajectory, one of which changes the cyclohexane ring at the diamine for two phenyl groups[13]. However the enantiomeric excess decreased from 92% to 86% and favoured the other enantiomer. This leads one to believe that the trajectory may be that of A. The bulky tButyl groups in the para position with respect to the coordinating oxygen may also be repulsive enough as to disfavour this direct side on approach. It is also worth considering π-stacking, this is shown to be a major interaction in a subsequent section of this wiki. The approaches B and D appear to be a good compromise by minimizing steric repulsion while maximising the п-overlap.
Alkenes and Epoxides
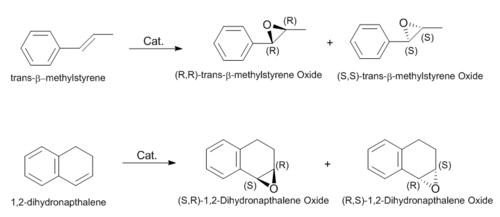
The regiochemistry and geometry of the alkene is important in determining the trajectory towards the catalyst. The alkenes under study are trans-beta-methyl-styrene and 1,2-dihydronapthalene, i.e. trans and cis geometry respectively. The orientation of the approach to the catalyst dictates the enantioselectivity in the product. Both possible enantiomers of each alkene have been optimised using the MMFF94s force field with the steepest descent algorithm. These are displayed below with the corresponding contributions of their energies.
The only alteration the catalyst makes is to that of the energy of the transition states (providing an alternative reaction pathway of a lower activation energy). These optimized epoxides were transferred to Gaussian and further optimized using the DFT B3LYP method and the 6-31G(d,p) basis set (the log files are given below). These optimized files were used for the subsequent NMR, ECD, VCD, and "initial" Optical Rotation calculations.
It was decided that both enantiomers would be calculated to make sure that the energies coincide. Comparing the energies in the table below of the (R,S) and (S,R) enantiomers of 1,2-dihydronapthelen oxide, there appears to be a difference in energy. The reason for this is due to the accuracy of the optimization (convergence tightness). A way around this problem is to use the inversion tool in Gaussian, that way molecule is not re-optimized. This unexpected result was not discarded, but used advantageously in the NMR analysis (will be explained in the following section).
In the synthetic part of this experiment, the methyl styrene that was provided was trans-beta-methyl-styrene. The thermal isomerisation was considered but literature suggests that an activation energy of 47.1 kcal/mol is required[14], thus isomerisation is unlikely at the temperatures used. As a result of this conclusion, further calculations will be carried out on the trans-isomer only unless stated.
Optimization files: [trans-Methyl-styrene [A]] [cis-methyl-styrene[B]] [1,2-Dihydronapthalene oxide[C]] [1,2-Dihydronapthalene oxide[D]] (Note: trans-β-methyl-styrene oxide will be referred to as just trans-methyl-styrene oxide)
Epoxide NMR
Computed NMR Data of the Epoxides
The multinuclear NMR (GIAO) spectrum for each epoxide was calculated using a CPCM solvent model with chloroform as the solvent. The same method and basis set as that used in the optimization was used for the NMR calculation. The spin-spin coupling was also determined as further comparison on the accuracies of the computed data to that of literature could be made. The two enantiomers are expected to have the same NMR spectrum thus only one calculation was deemed necessary. As mentioned previously, two energetically different 1,2-dihydronapthalene oxide structures were found accidentally, the NMR calculations were performed on each and the results were averaged. This average aids in reducing the problem of a "static structure" and leads to an increased realism. The NMR was also taken for both the cis- and trans-methyl-styrene oxide in-order to probe the couplings between the alkene protons as this will be of use for justifying the epoxides formed in the synthetic part of the experiment.
The couplings presented have been averaged for environments that are expected to be equal if rotations about single bonds were simulated. For example, the epoxide proton which has an α-methyl group has had its coupling averaged between the three protons on the methyl carbon.
Methyl-styrene Oxide
The 1H NMR spectrum of cis- and trans- are exceptionally similar, only showing significant variation in the epoxide protons. The comparison of the chemical shifts of both geometric isomers to literature yields no clear conclusion as to distinguish between which isomer is present as the values lay in between that of both isomers. There is however expected to be a larger difference in the coupling of these epoxide protons. It can be seen from the J-couplings in the table below that there is higher correspondence of the trans form to the literature, most notably the J= 5.21 with the cited value of J=5.1. These couplings will also pose useful in assigning of the spectra obtained from the synthetic part of the experiment.
As the literature states that the epoxide was that of the trans form, a plot of the "deviations from literature" has been made. The largest deviations manifest for that of the methyl protons. The reason for this is once again due to the static molecule that Gaussian assumes (rather than free rotation about the bonds, expect the 3 methyl proton environments to turn to one).
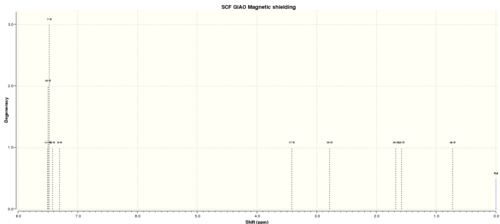 |
Cis-conformation [Log] (ppm) | Trans-conformation [Log] (ppm) | literature[15] (ppm) | 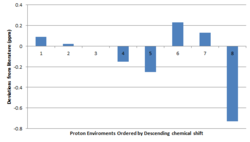 |
|---|---|---|---|---|
| 7.53 (3H) | 7.49 (3H) | 7.20-7.40 (m, 5H) | ||
| 7.45 (1H) | 7.42 (1H) | 7.20-7.40 (m, 5H) | ||
| 7.39 (1H) | 7.31 (1H) | 7.20-7.40 (m, 5H) | ||
| 3.99 (1H, J=4.49) | 3.42 (1H, J=0.85) | 3.57 (d, 1H, J=2.1) | ||
| 3.28 (1H, J= 5.48, 4.49) | 2.78 (1H, J= 5.21, 0.85) | 3.03 (qd, 1H J=5.1,2.1) | ||
| 1.45 (1H, J= 5.48) | 1.68 (1H, J= 5.21) | 1.45 (d, 3H, J=5.1) | ||
| 0.84 (1H, J= 5.48) | 1.58 (1H, J= 5.21) | 1.45 (d, 3H, J=5.1) | ||
| 0.68 (1H, J= 5.48) | 0.72 (1H, J= 5.21) | 1.45 (d, 3H, J=5.1) |
The 13C NMR computed spectral data is shown in the table below for both of the geometric isomers. The aromatic carbon atoms show little deviation between the two isomers, the most notable difference occurs between the methyl carbon. Comparing the values to literature, it is evident that the trans isomer resembles literature more closely, with key shifts corresponding to the methyl carbon and those of the aromatic carbons. The deviations from literature for the trans-isomer is also shown. The largest deviation corresponds to the carbon which has its C-H bond parallel to the epoxide. Deviations may be accounted for by inaccurate modelling of the solvent and the presence of only a single molecule (likely to get π-π stacking of the phenyl rings of multiple molecules).
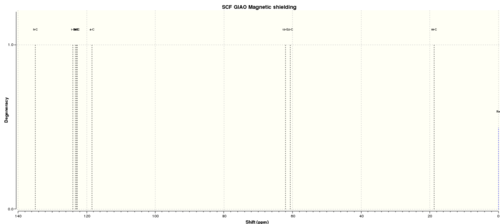 |
Cis-conformation [Log] (ppm) | Trans-conformation [Log] (ppm) | literature (ppm) [15] | 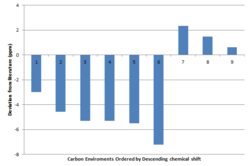 |
|---|---|---|---|---|
| 132.80 | 134.92 | 137.9 | ||
| 123.40 | 124.03 | 128.6 | ||
| 123.12 | 123.29 | 128.6 | ||
| 122.76 | 122.91 | 128.2 | ||
| 122.47 | 122.70 | 128.2 | ||
| 121.40 | 118.49 | 125.7 | ||
| 59.01 | 62.04 | 59.7 | ||
| 57.68 | 60.67 | 59.2 | ||
| 13.11 | 18.71 | 18.1 |
1,2-dihydronapthalene oxide
The tables below show the 1H and 13C NMR spectra for 1,2-dihydronapthalene oxide. The averages of the two energetically different (due to convergence criteria of Gaussian) epoxides are also given. As one can see, the averaged chemical shifts are in accordance with the literature values. The deviations can one again be pinned on factors mention previously.
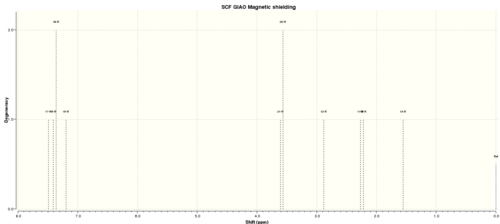 |
Molecule 1 [Log] (ppm) | Molecule 2 [Log] (ppm) | Average (ppm) | literature[16] (ppm) | 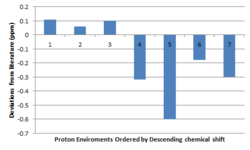 |
|---|---|---|---|---|---|
| 7.49 (1H, J= 8.2) | 7.61 (1H, J= 8.2) | 7.55 | 7.44 (d, 1H, J= 7) | ||
| 7.39 (2H) | 7.39 (2H) | 7.39 | 7.33-7.21 (m, 2H) | ||
| 7.19 (1H, J= 8.2) | 7.26 (1H, J= 8.2) | 7.23 | 7.13 (d, 1H, J= 7) | ||
| 3.59 (2H, J= 4.3) | 3.55 (1H, J= 4.1) | 3.57 | 3.89 (d, 1H, J= 4) | ||
| (This hydrogen is present in the shift above) | 3.46 (1H, J= 4.5) | - | 3.77 (t, 1H, J = 4) | ||
| 2.88 (1H, J= 10.4) | 2.94 (1H, J= 10.5) | 2.91 | 2.83-2.79 (m, 1H) | ||
| 2.27 (1H) | 2.28 (1H) | 2.28 | 2.59-2.55 (m, 1H) | ||
| 2.22 (1H) | 2.19 (1H) | 2.21 | 2.49-2.41 (m, 1H) | ||
| 1.56 (1H) | 1.91 (1H) | 1.74 |
The 13C NMR highlights the reason chosen for averaging the spectral data. The highest chemical shift in the literature shows greater alignment to that of the second molecule while lower chemical shifts show greater alignment with the first molecule. The largest deviations from literature is that of the aromatic carbons. A plausible reason for this is due to the inaccuracy of simulating the π-stacking and direct interactions with solvent molecules. The carbon atoms corresponding to the epoxide show great correspondence with that of literature.
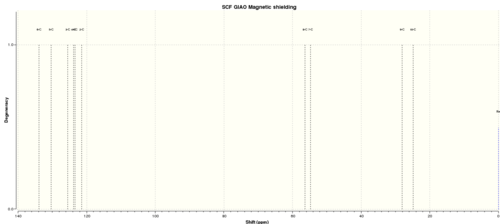 |
Molecule 1 [Log] (ppm) | Molecule 2 [Log] (ppm) | Average (ppm) | literature[16] (ppm) | 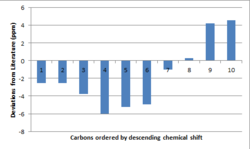 |
|---|---|---|---|---|---|
| 133.84 | 135.33 | 134.59 | 137.1 | ||
| 130.39 | 130.39 | 130.39 | 132.9 | ||
| 125.56 | 126.69 | 126.13 | 129.9 | ||
| 123.81 | 123.76 | 123.79 | 129.8 | ||
| 123.41 | 123.66 | 123.54 | 128.8 | ||
| 121.46 | 121.70 | 121.58 | 126.5 | ||
| 56.43 | 52.55 | 54.49 | 55.5 | ||
| 54.79 | 52.22 | 53.51 | 53.2 | ||
| 28.04 | 30.01 | 29.03 | 24.8 | ||
| 24.92 | 28.65 | 26.79 | 22.2 |
Determining the Absolute Conformation
The determination of the absolute configuration of the enantiomer present is of upmost importance in pharmaceuticals. There are several methods available for doing just this. This section focuses on critically comparing the effectiveness of each method (for that of a computational prediction).
Optical Rotation
Optical rotation can easily be determined in a laboratory setting. Plane polarised light of a specified wavelength is passed through the sample. The light that passes through is analysed for changes in the polarisation. This measurement provides swift determination of the dominant product present. The concentration of the sample and the temperature at which the experiment was carried out in the lab can be corrected for to give a comparable value for a specific solvent. Significant deviations from that of literature gives a rough qualitative understanding to how enentiomerically pure the sample is. Once again, for newly synthesised compounds, computational data can provide a loose guidance to the expected value.
The data presented below was calculated by adoption of the DFT B3LYP method and a 6-31++g(2df,p) basis set (a further optimization was done prior to the optical rotation calculation), chloroform was incorporated using the CPCM solvation model. This basis set adds polarisability functions to the carbon and hydrogen atoms, thus increasing the realism of the calculation. Initial calculations were done using the same basis set as the initially optimized files in section 2.2, however these results yielded the opposite assignment as to that below, thus a larger basis set was used. The literature stated used chloroform as a solvent.
| Methyl-styrene oxide | 1,2-dihydronapthalene oxide | ||||
|---|---|---|---|---|---|
| (R,R) [Log] | (S,S) [Log] | Literature | (S,R)[Log] | (R,S)[Log] | Literature |
| 38.02o (589 nm) 106.04o (365 nm) | -38.02o (589 nm) -106.04o (365 nm) | (R,R)= +47.2o[17](589 nm), (S,S)= -46.9o [15] (589 nm) | 36.45o (589 nm) 212.49o(365 nm) | -36.45o (589 nm) -212.49o(365 nm) | (S,R)=-38.8o[15], -144.9o[18] (589 nm) |
Note: There was no literature values found for the 365 nm data
The trans-methylstyrene oxide shows a deviation from literature of approximately 10o. This is a reasonable correspondence since there is a relatively large deviation in the literature, mostly likely due to errors in concentrations and temperatures recorded. At first inspection, the 1,2-dihydronapthalene oxide rotation value appears to deviate massively compared to that of literature, however this may not the case. As this is a measured angle, one can add or subtract 180o to each value, due to the reference point that was being used. There is numerous values in literature that show a 180o difference with that of other literature values. Thus subtracting 180o from 36.45o yields -143.55o which is in good correspondence to the cited value of -144.9o. In general one can quote an optical rotation whose value is greater than |100o| with more confidence than one with an absolute value of less than 100o.
Possible reasons for these deviations is errors in the stated temperatures and concentrations as well as the overall purity of the sample submitted (factors such as, has the measurement vessel been cleaned properly), it may not be as enantiomerically pure as one was lead to believe. The instrument used can also lead to variations in recorded data. Initially instruments required user input to obtain the optical rotation whereas most of the modern machines is automated thus reducing that of user error.
This section shows how a single difference in the sign of the rotation is able to show the presence of one enantiomer or the other. There is a vast trove of literature values available so determining the absolute configuration is a relatively easy feat, but the accuracy leaves something to be desired.
Vibrational Circular Dichroism
This is a method that utilises the response a molecule has to left/right circularly polarised IR-radiation. It can be used to determine the absolute configurations of a sample along with the enantiomeric excess[19][20]. This method can be advantageous over that of the chiral shift reagent method due to not requiring any additional species being added, and saves time in having to find a suitable shift reagent.
There is a reflection plane in the x-axis. This is expected since the enantiomers absorb the opposite polarisation compared to the other. This method proves possible to distinguish between the two enantiomers, unfortunately this option was not available in the synthesis lab. However, if literature did exist, analysis of the sign corresponding to each peak can yield an excellent assignment.
| Config. | Methyl-Styrene Oxide | Config. | 1,2-Dihydronapthalene Oxide |
|---|---|---|---|
| (R,R) |  [Log] |
(R,S) | 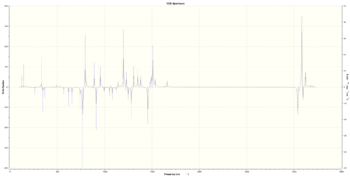 [Log] |
| (S,S) | 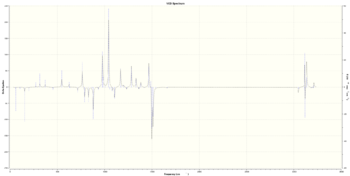 [Log] |
(S,R) | 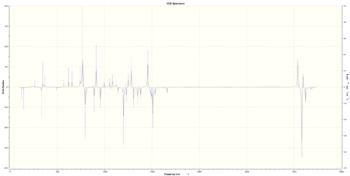 [Log] |
Electronic Circular Dichroism
It was predicted that this method would yield the least useful results in being able to assign an absolute configuration, due to the lack of a significant chromophore. It was included in this report for completeness in the comparison as well as for the experience of observing the type of data produced by this technique.
This is very similar to that of the VCD method previously mentioned, instead of IR-radiation, visible light up to UV-vis is used to irradiate the sample at different polarisations. The enantiomers contain an aromatic conjugated system and will thus absorb light. The spectrums shown below have some distinctions between the enantiomers present, for example that of the 1,2-dihydronapthalene has the two initial peaks reflected in the x-axis. It is clear that the output of this method is not as "clean" as that of the VCD spectrum, and experimental literature spectra require significantly more interpretation than an optical rotation to determine the configuration.
| Config. | Methyl-Styrene Oxide | Config. | 1,2-Dihydronapthalene Oxide |
|---|---|---|---|
| (R,R) | 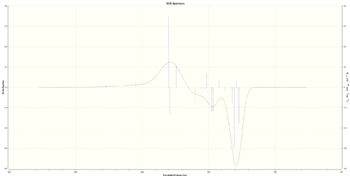 [Log] |
(R,S) | 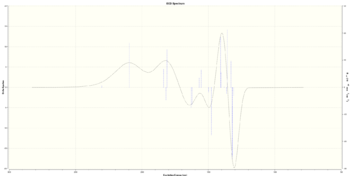 [Log] |
| (S,S) | 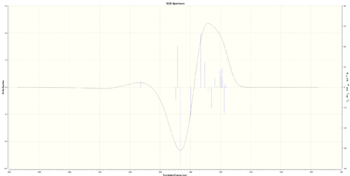 [Log] |
(S,R) |  [Log] |
Summary
Optical rotation measurements proved to be the most successful method due to the simplicity of the output, i.e. a single number corresponding to a rotation. ECD and VCD requires closer inspection of each spectrum. Most compounds already have an optical rotation literature value assigned to them, VCD and ECD assignment are more uncommon. The problems associated with optical rotation have also been uncovered, thus if the scientific community took a greater interest in the VCD method, assignments could be made with a greater degree of certainty.
The synthetic procedure of an optical rotation is relatively easy, it only involves making up a solution of known concentration and applying a simple correction to the output value to account for the concentration and temperature factors.
Transition States of the Catalysts
Optimized files for both the Shi and Jacobsen catalysts with the 4 different alkenes in a variety of configurations were provided for analysis (these can be found [here]).
Shi-Transition State
The optimized transition states were analysed in-order to probe the thermodynamic quantities associated with each. (S,R)2 is the highest energy conformation (12.6 kcal/mol larger than the lowest energy conformation). This high energy can be accounted for by the twist-boat conformation adopted by the central 6-membered ring. The lowest energy transition state has the 6-membered ring adopting the more stable chair conformation, also noting that the alkene substrate approaching from a different direction. The higher energy conformation approaches in a planar manner from the top face while the lower energy approaches from a side face, a spirocyclic transition state.
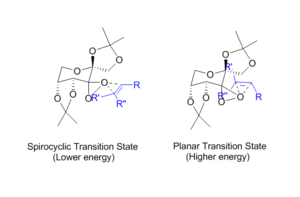
The lowest energy of the other enantiomer (R,S)3 has a higher energy primarily due to repulsive interactions of the aromatic ring in 1,2-dihydronapthalene with the substituents on the catalyst. This interaction dictates the selectivity of the catalyst.
| Transition State | Sum of Electronic and Thermal Free Energies (Hartrees) | Difference Relative to Lowest Energy Conformation (Hartrees) | kcal/mol | Comments |
|---|---|---|---|---|
| (R,S)1 | -1381.120782 | 0.015457 | 9.699416 | |
| (R,S)2 | -1381.125886 | 0.010353 | 6.496607 | |
| (R,S)3 | -1381.134059 | 0.002180 | 1.367971 | (S,R to R,S Energy Difference) |
| (R,S)4 | -1381.126722 | 0.009517 | 5.972009 | |
| (S,R)1 | -1381.131343 | 0.004896 | 3.072287 | |
| (S,R)2 | -1381.116109 | 0.020130 | 12.631768 | (Highest Energy) |
| (S,R)3 | -1381.126039 | 0.010200 | 6.400598 | |
| (S,R)4 | -1381.136239 | 0.000000 | 0.000000 | (Lowest Energy Conformation) |
The expected enantiomeric excess can be calculated by considering the difference in energy of going from (S,R) to (R,S). The table above reveals the energy difference corresponds to 5.72359 kJ/mol.
, kJ mol-1 K-1 This means that for every 1 product of (R,S), there are 10 molecules of (S,R). The excess was calculated as follows,
A literature value of 32% (for (-)(S,R)) at -10 oC was recorded by Wang et al.[21]. Comparing the computational result above and that of the literature shows that the same enantiomer is favoured, but the excess has a relatively large variation. One possible reason for this is that regarding the temperature used for the calculation. The calculation used a temperature of 25 oC, this can be altered by specifying the desired temperature in the calculation input file. However this is unlikely to account for the large difference.
The equation below determines the ratio of the difference in energy between the transition states to that of the thermal energy, in this case we have . Failed to parse (syntax error): {\displaystyle \frac{\Delta G}{K_B T × N_a} } → This shows the difference in energy between the transition states is in the same order of magnitude of the thermal energy of the reaction. If one was to do the same calculation but with the -10 oC as reported in the literature, it is observed that the reaction will be less affected by temperature deviations.
A more plausible account for the difference is that of the solvent and pH. When selecting a solvent in Gaussian, a dielectric value is applied across the system. This does not take into account specific interactions such as hydrogen bonding. In-order to simulate these interactions, one would need to directly add water molecules to the system, thus increasing the computational cost. Solvents may stabilise one transition state more than another, please see this wiki page for solvent effects on transition states of cycloadditions [Jake Greenfield Physical Computational]. The pH was also omitted from the calculation where the reference used a pH of 10.3, is was a compromise between reactivity to the desired product to that of side-products, thus a lower ee value.
It is easy to overlook simple differences between the real system and that of the computational system. For example, the calculated transition states was done in the gas phase, with only one molecule present, i.e. not bulk interactions with other molecule or with solvents for that matter. These simple differences can lead to significant deviations in the outcome of the calculation to that of the experimental data.
NCI Analysis
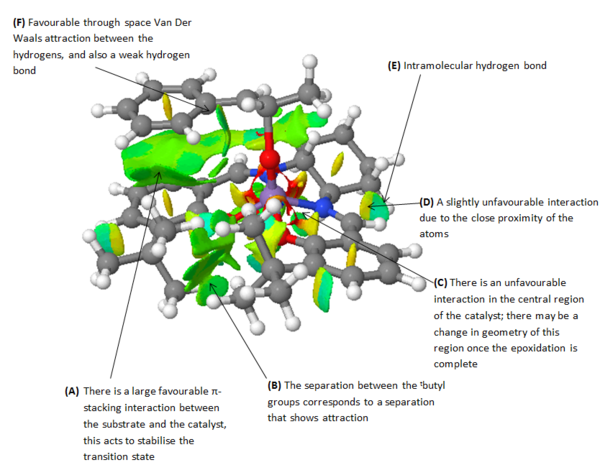
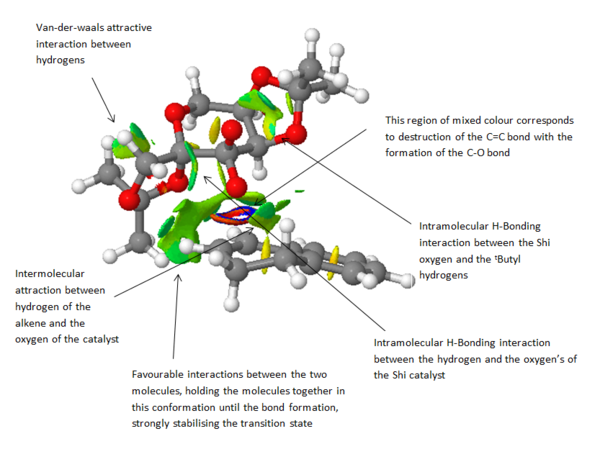
The non-covalent-interactions were probed, the isosurfaces indicate regions of non-covalent interaction. A cube was generated of the lowest energy transition state in Gaussian using the total density and a "fine" grid. Blue regions represent intense attraction whereas red regions indicate repulsion. From the diagram below, one can see that the location of the epoxide formation is represented by the multi-coloured ring representing both repulsion and attraction indicates the half covalent interaction. Intramolecular hydrogen bonds are also shown as an attractive interaction (isosurface in regions between hydrogen and oxygen). The large green surface is a highly favourable interaction between the two substrates, acting to stabilise the transition state, making it more favourable.
The size of the largest surface is limited due to the cis-geometry of the substrate. If a trans-substrate was used, such as the methylstyrene one can imagine how the methyl region would be in a complimented geometry as to bend around the catalyst as to further increase this region of van der waal attraction. This effect would result in a greater stabilisation of the transition state, and thus improving the selectivity.
|
In terms of the strengths of these interactions, they are relatively much weaker than a definitive bond, but do show strength in numbers.
QTAIM Analysis
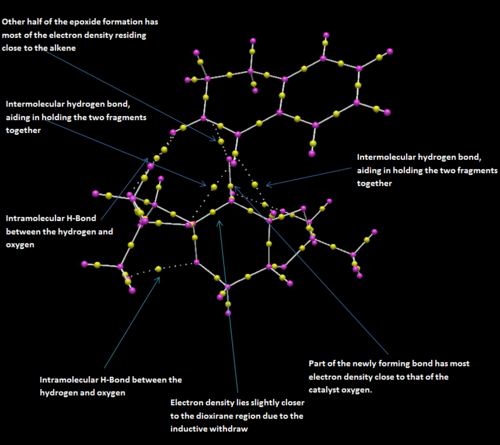
The bond critical points, (BCP), were also analysed in order to determine the positions of electron density between interactions. The QTAIM diagram below shows numerous favourable Van der waal and hydrogen bond interactions acting to stabilise the transition state.
The transition state is that of spiro-character rather than planar. with the substrate approaching side on as to maximise the Van der waal attraction. As noted by Shi et al.[15], there is a favourable electronic interaction between the lone pair of a dioxirane oxygen with that of the π* of the alkene, resulting in further stabilisation of the system. This effect can be further improved by an increase in the conjugation length, which acts to reduce the HOMO- LUMO energy gap, thus lowering the energy of the π* making donation into this orbital easier (for example stilbene).
The majority of the carbon σ-framework shows a central BCP. However the C-H bonds show the BCP residing closer to the hydrogen atoms. This is also observed for the BCP of H-bonding interactions. A possible reason for this is that the QTAIM takes into account the orbital size of each atom, thus the oxygen atom is larger than that of the hydrogen so if one was to take into account of the radius of oxygen and hydrogen, the BCP may actually reside close to the hydrogen atom.
Jacobsen-Transition State
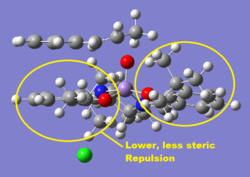
Analysing the geometry associated with each transition state, The two lowest energy configurations of the trans conformations correspond to the (S,S) enantiomers. The key different between the two (S,S) is the side that the large aromatic group of the alkene substrate approaches the catalyst. (S,S)1 has the large group approach over the lower-lying side, thus a less hindered approach (with respect to hydrogen atoms sticking up from the plane along with a lower lying tButyl group), this is shown in the adjacent thumbnail. The difference between 2(R,R) and 2(S,S) is that the former has the hydrogens of the cyclohexane ring in a vertical axial position where the distance between these hydrogens and the incoming substrate is less than 210 A (van-der-waals repulsion). The dominating difference between the (R,R) and (S,S) conformations is the curvature away from planarity of the salen ligand around the metal. (S,S) has the larger curvature, thus the tbutyl groups of differing phenyl rings experience less repulsion.
The favoured route of approach is that of coming in over the diamine[13]. The least favoured transition state shows repulsion between the substrate and the protruding tButyl groups.
The cis-alkene was also analysed in case any of this was present in the starting reagents. It is pleasing to see that the transition state resides at a higher energy than that of the trans-conformation, thus further supporting the decision to assume only the trans-alkene reacts. The energy difference between the cis and trans lowest energy transition state is 1.83 kcal/mol.
| Cis | Trans | ||||||
|---|---|---|---|---|---|---|---|
| Transition State | Sum of Electronic and Thermal Free Energies (Hartrees) | Difference Relative to Lowest Energy Conformation (Hartrees) | kcal/mol | Transition State | Sum of Electronic and Thermal Free Energies (Hartrees) | Difference Relative to Lowest Energy Conformation (Hartrees) | kcal/mol |
| (R,S)1 | -3383.251060 | 0.008499 | 5.333204 | (R,R)1 | -3383.253816 | 0.008665 | 5.437371 |
| (R,S)2 | -3383.250270 | 0.009289 | 5.828937 | (R,R)2 | -3383.254344 | 0.008137 | 5.106046 |
| (S,R)1 | -3383.259559 | 0.000000 | 0.000000 | (S,S)1 | -3383.262481 | 0.000000 | 0.000000 |
| (S,R)2 | -3383.253442 | 0.006117 | 3.838476 | (S,S)2 | -3383.257847 | 0.004634 | 2.907880 |
The enantiomeric excess of the (S,S) configuration has been calculated. This was done by comparing the lowest energy arrangement of the two possible enantiomers. The equations below were adopted to determine the equilibrium constant K. , kJ mol-1 K-1 This means that for every 1 product of (R,R), there are 5533 molecules of (S,S). The excess was calculated as follows,
A literature value of 47% favouring the (R,R) was found[22]. This gigantic deviation may be due to the missing tbutyl groups on the phenyl ring of the catalyst. This groups would hinder direct side on approach making it an unfavourable approach due to the large steric bulk. Other possible reasons originate from the simplified solvation model. This has the effect of applying a dielectric value to the background that the molecule experiences. There are several different methods to choose from ranging from different considerations. It is important to point out that selecting a solvent, such as water, hydrogen bonding will not be considered. Hydrogen bonding can be a dominant factor in how some solvents interact with the reactants. If hydrogen bonding needs to be considered, it can be achieved by placing numerous water molecules around the reactant and selecting the solvent feature to apply a dielectric over the background. This has the drawback of being very computationally expensive. The literature also carried out the reaction at a pH of 11.3, once again this has not been taken into account in the calculation.
NCI Analysis
The non-covalent-interactions have been determined by visualisation of a computed isosurface for the transition state. A cube was generated of the lowest energy transition state in Gaussian using the total density and a "fine" grid. Arguably the most dominant NCI is that of the π-π stacking of the phenyl rings. This is an extremely favourable interaction, drastically stabilising the transition state. This overlap can be maximised by a side on approach to the catalyst.
If the Jacobsen catalyst was re-optimized with the addition of the missing tbutyl groups, one can see that there is likely to be a degree of repulsion with the phenyl ring on the substrate. This would act to reduce this stacking interaction, thus destabilising the transition state. This might be a large enough difference that the opposite enantiomer is favoured.
There is also an attraction as well as a small degree of repulsion between the aromatic protons of the substrate and the tButyl groups. The fact that this is present indicates that the if the substrate was to approach over these groups, there would be a greater repulsive interaction, far less favourable than a side on approach.
|
As seen in the NCI, there is some repulsion between the atoms involved in the coordination and the central metal. There is expected to be a lengthening of these coordination bonds and this is just what was observed in the vibration corresponding to the transition state. As the oxygen leaves the metal, the heteroatoms involved in coordination adopt a more planar-like arrangement.
QTAIM Analysis
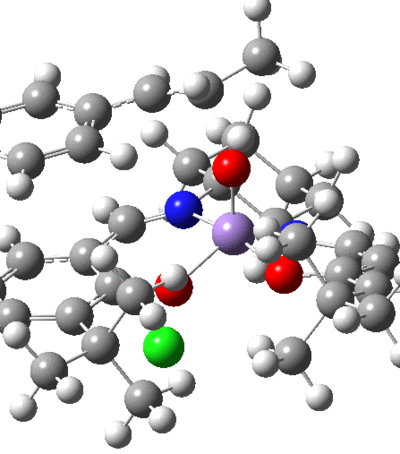
This shows that the coordination of the salen ligand to the manganese centre is a non-covalent interaction. This is not that surprising as the bonds to the metal are dative, and the QTAIM correctly shows that the BCP resides closer to the heteroatoms. There is also shown to be attraction between the tButyl groups with the BCP residing in the centre of the interacting nuclei. This attraction is accomplished by the distortion of planarity of the catalyst. The hydrogens on the tButyl group also show interactions with the oxygen atoms coordinated to the Mn centre, thus hydrogen bond like behaviour.
Multiple interactions are shown between the approaching substrate and the catalyst, these aide in directing the substrate into the preferred orientation, helping to enforce the selectivity.

New Candidate for Investigation
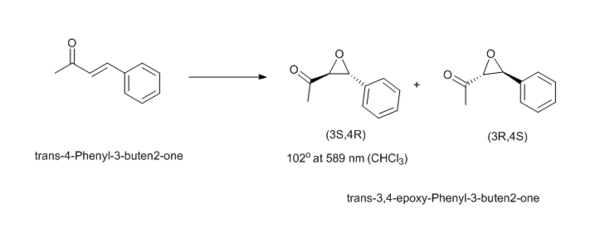
Trans-4-Phenyl-3-buten2-one is similar to the structures used in the synthesis part of the experiment but now has the ketone withdrawing some electron density from the conjugated system, which may reduce the donation of the oxirane of the Shi-catalyst into the π* alkene bond. Also the increased length of the chain may show some form of conformation preference for the direction the terminal methyl group adopts to stabilise the transition state. This can be purchased from Aldrich and is relatively cheap (£34.80 per 50 g, CAS: 1896-62-4 ). The (3S,4R) has an optical rotation of 102o in CHCl3 at 25 oC[23].
Conclusion
This investigation has successfully shown the mechanical reasons for the observed selectivity in the dimerisation of cyclopentadiene. The analysis of the transition states correctly shows that the endo-TS lies lower in energy. This supports the observation that the reaction does not favour the thermodynamic product but actually proceeds via kinetic control. The transition state data also uncovered that the reaction proceeds asynchronously, leading to the idea that there is a continuum between the classification of synchronous and asynchronous behaviour. NICS analysis showed that both transition states can be considered aromatic, one being more so than the other. The strengths and weaknesses of Multi-nuclear NMR have been exhibited in the data produced. The data produced by computations can show moderate agreement to literature (for the method and basis set shown), while the deviations can be accounted for by the way Gaussian interprets the molecule.
Out of the three methods investigated for determining the absolute configuration optical rotation emerged the clear winner, due to the vast amount of literature data available that can be used as a comparison to experimental results. The transition state provided for the Jacobsen catalyst was missing two tButyl groups, the literature predicts that the opposite value is in excess than the one computed. Further study can be done using the correct structure of the Jacobsen catalyst to determine if the computed values will then be in agreement with literature. The ee of the Shi-catalysed reaction was found to be similar to that of the literature. NCI and QTAIM analysis provided good insight into the non-covalent interactions present in the two catalyst transition states.
Further experimentation could include investigation of the selectivity for substrates not containing an aromatic ring. It has been shown that the π-π stacking interaction is favourable, and is likely to be an important factor in the approach the substrate makes. If this interaction is not present, we might expect to see approach primarily over the cyclohexane region. Similar to the study done by Jacobsen et al.[13], the cyclohexane could be replaced by two bulky phenyl groups as to add hindrance to this approach. One may expect to see a significant decrease in the yield of reaction.
References
<references>
<ref name="twentythree"> L. A. Paquette, N. A. Pegg, D. Toops, G. D. Maynard, R. D. Rogers, J. Am. Chem. Soc.,1990, 112 (1), 277-83, DOI:10.1021/ja00157a043
- ↑ 1.0 1.1 D. Skala, J. Hanika, Petroleum and Coal, 45, 3-4, 105-108
- ↑ 2.0 2.1 H. Rzepa,Chemistry with a Twist,[DOI]
- ↑ 3.0 3.1 R. Hoffmann, R. Woodward, 1965, [DOI]
- ↑ 4.0 4.1 J. Greenfield, Inorganic computational Assignment, 2014,[DOI]
- ↑ 5.0 5.1 S. W. Elmore, L. Paquette, Tetrahedron Letters, 1991, 319; DOI:10.1016/S0040-4039(00)92617-0
- ↑ 6.0 6.1 W. Maier, P. Schleyer, J. Am. Chem. Soc., 1981, 103 (8), pp 1891–1900, DOI:10.1021/ja00398a003
- ↑ 7.0 7.1 H. Rzepa, Conformational Analysis, DOI:10042/a3uy9
- ↑ 8.0 8.1 J. Bredt, Justus Liebigs Ann. Chem, 1924, 437, DOI:10.1002/jlac.19244370102
- ↑ 9.0 9.1 J. Kim, J. Am. Chem. Soc., 1981, 103.[DOI]
- ↑ 10.0 10.1 Cite error: Invalid
<ref>tag; no text was provided for refs namedtwentythree - ↑ 11.0 11.1 N. Trinajstić, Tetrahedron Lett., 1968, 9, 1529-1532 DOI:10.1016/S0040-4039(01)98993-2
- ↑ 12.0 12.1 G. Glocker, J. Phys. Chem., 1958, 62, 1049–1054, DOI:10.1021/j150567a006
- ↑ 13.0 13.1 13.2 13.3 E. Jacobsen, W. Zhang, A. Muci, J. Am. Chem. Soc., 1991, 113, 7063-7064
- ↑ 14.0 14.1 T. Beringhelli, A. Gavezzotti, M. Simonetta, J. Mol. Struct. , 1972, 12 333-342, DOI:10.1016/0022-2860(72)87042-X
- ↑ 15.0 15.1 15.2 15.3 15.4 15.5 Z. Wang, Y. Tu, M. Frohn, M. Zhange, Y. Shi, J. Am. Chem. Soc., 1997, 7863, 11224-11235DOI:10.1021/ja972272g 10.1021/ja972272g
- ↑ 16.0 16.1 16.2 M. Robinson, M. Davies, R. Buckle, I. Mabbett, S. Taylor, A. Graham, Org. Biomol. Chem., 2009, 7, 2559-2564, DOI:10.1039/B900719A
- ↑ 17.0 17.1 B. Witkop, C. Foltz, J. Am. Chem. Soc., 1957, 79, 197-201
- ↑ 18.0 18.1 H. Sasaki, R. Irie, T. Hamada, K. Suzuki, T. Katsuki, Tetrahedron, 1994, 50, 11827-11838, DOI:10.1016/S0040-4020(01)89298-X
- ↑ 19.0 19.1 R. K. Dukor and L. A. Nafie, Encyclopedia of Analytical Chemistry: Instrumentation and Applications, Ed. R. A. Meyers, 2000, 662-676
- ↑ 20.0 20.1 L. Nafie, T. Keiderling, P. Stephens, J. Am. Chem. Soc., 1976, 98, 2715-2723, DOI:10.1021/ja00426a007
- ↑ Wang, Shi, J. Am. Chem. Soc., 1997, 119
- ↑ 22.0 22.1 P. Pietikainen, Tetrahedron Lett., 1994. 35, 942, DOI:10.1016/S0040-4039(00)76006-0
- ↑ 23.0 23.1 T. Nemoto, T. Ohshima, K. Yamaguchi, M. Shibasaki, J. Am. Chem. Soc., 2001, 123, 2725-2732 DOI:10.1021/ja004201e

