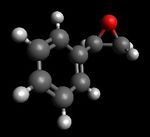
Rep:Mod:1Caachatin211
Introduction
Thanks to computational modelling, it is now possible to accurately predict organic structures in order to study their specific properties and reactivities to rationalise outcomes of reactions, determine useful modifications to existing reactions or even find new types of reactions. [1]
The objective of this experiment is illustrate the diversity of such molecular modelling[1] and to verify the reliability of such techniques by comparing the obtained computations to experimental data. The first part of the experiment involves predicting the structure and reactivities of well known molecules, including Cyclopentadiene and Taxol. The second part of the experiment involves determining the absolute configuration of two unkown epoxides, formed using two well known catalysts - the Jacobsen and Shi one -, for instance, by computing their optical rotation. Transition states will also be analysed in order to understand the enantioselectivity of both catalysts.
To do so, several softwares including Avogadro, Gaussian 9.0, Mercury and ConQuest, will be used.
PART 1: Conformational Analysis using Quantum Mechanics
Dimerisation of Cyclopentadiene
The objective of this first part is to determine whether the cyclodimerisation of cyclopentadiene and the hydrogenation of the dimer are kinetically or thermodynamically controlled, based on the results obtained from the molecular mechanics technique.
Comparison of both dimers: the 'Endo' and the 'Exo'

The Diels-Alder reation is a [π4s + π2s] cycloaddition and hence belongs to a class of reactions known as 'pericyclic reactions', which occur in a concerted stereospecific fashion[2]. The Diels-Alder reaction occur between a conjugated diene, in its s-cis conformation, and a dienophile[2]. Usually, the diene is electron rich, and hence has high-energy HOMO, while the dienophile, is electron poor, and hence has a low energy LUMO, as this combination gives a better overlap in the transition state[2]. This is known as a 'normal electron demand'[2]. In the case cyclopentadiene's cyclisation, cyclopentadiene both acts as the diene and the dienophile.
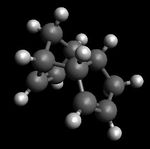
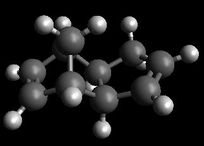
According to Woodward-Hoffmann's rules, this reaction should proceed suprafacially via a Huckel transition state. In fact, such a suprafacial approach can occur in two different way, resulting in the formation of two different adducts: the 'exo' and the 'endo'[2]; the latter being the major product. Both structures were created on Avogadro and optimised using a MMFF94s force field, in order to determine their relative energies and stabilities, and hence find out whether the 'endo' dimer is the thermodynamic or the kinetic product. The MMFF94s force field was chosen to run the following calculations as it is more sophisticated and hence more precise than the UFF method. However, it is worth noting that this method is limited to only a certain combinations of elements. [1]
It is clear from the table on the left that that the 'exo' dimer is much more stabler than the 'endo' one: in fact, the 'exo' dimer is 2.8 kcal/mol, i.e. 12 kJ/mol lower in energy than the 'endo' one. This means that the 'endo' dimer is not the thermodynamic product and that the reaction proceeds under kinetic control.
| H-H Van der Waals interactions | C-C Van der Waals interactions |
|---|---|
 |
|
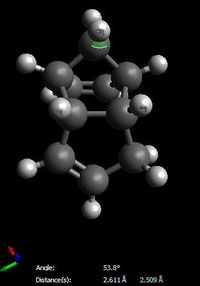
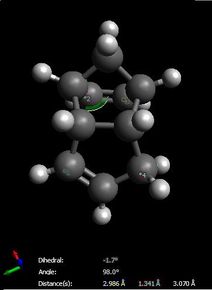
The increased stability of the 'exo' dimer can be explained by the reduced steric hindrance, and torsional strain, in the 'exo' dimer, where the smaller (that is, the one-atom) bridge eclipses the cyclopentene ring. As shown here below, in the 'endo' dimer, the overhanging proton of the small bridge and the two protons of cyclopentene's ring are relatively close to each (2.51/2.61 Å) which is only 0.1/0.2 Å larger than 2.4 Å, i.e. twice Van der Waals radii[3]. Also, C1-C2 and C3-C4 through space distances are 2.99 and 3.07 Å respectively, which is shorther than 3.40 Å, i.e. twice Van der Waals radii[3]. Both effects result in unfavourable interactions and hence destabilisation of the 'endo' dimer relative to the 'exo' one.
| Endo Dimer | Exo Dimer |
|---|---|
 |

|
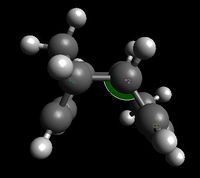
However, the main effect in contributing to exo's instability is the angle bending term, which accounts for 82.1% of the dimers' energy difference. This can be explained by the differences in the C1-C2-C3 angles; as shown here below, it is equal to 115.6° in the 'exo' product whilst it is equal to 118.6° in the 'endo' product. As a result, deviation from an ideal sp3 hybridised bond angle (109.5°) is larger in the case of the 'endo' product than in the case of the 'exo' product, which results in greater instability of the former.
For reactions under thermodynamic control, the outcome is determined by the relative energies of the products, whilst for reactions under kinetic control, it is determined by the relative energies of the transition states. The relative stabilities of both transition states can be explained by looking at the Frontier Orbitals.[4]
As shown in the diagram here below, the red dashed lines, present in both transition states, represent the sites of the new bonds and are called 'primary interactions', whilst the blue thick lines, only present in the 'endo' transition state, identify through space bonding interaction and are called 'secondary interactions'[4]. Those additional attractive orbital interactions are not directly involved in the formation of new bonds but 'leave their imprint in the stereochemistry of the product'[2]: by stabilising the 'endo' transition state relative to the 'exo' transition state and hence leading to the selective formation of the 'endo' product under kinetic control, even though it is the least stable product.

Hydrogenation of the Endo Dimer

Hydrogenation of the 'endo' dimer results in two possible outcomes depending on which double bond will be hydrogenated. As previously, geometries of both products were optimised using a MMFF94s force field, and there relative energies were compared, in order to find out found whether the reaction is kinetic or thermodynamic control.
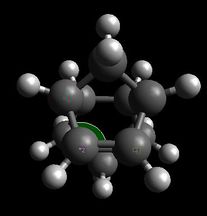
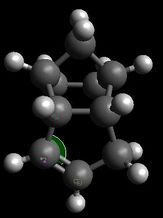
It is clear from the table shown on the left that product 4 is much more stable than product 3. In fact, product 4 is 9.5 kcal/mol, i.e. 39 kJ/mol, lower in energy than product 3. This is mainly due to mainly to the increased amount of steric hindrance in product 3 compared to product 4, illustrated by its the higher degree of torsional strain (0.059 vs -0.373 kcal/mol), due to the eclisping of the allyl group. This also results in a much higher degree of angle bending in product 3 compared to product 4 (30.9 vs 24.7 kcal/mol i.e. +6.2 kcal/mol), in which the allylic group adopt a staggered conformation. The difference in strain is also associated to the difference in bond angles involving sp2 hybridised alkene carbons and an adjacent sp3 carbon. Indeed, as illustrated here below, in the case of product 3, the C1-C2-C3 is equal to 107.2°, whilst in the case of product 4, it is equal to 112.0°. As a result, deviation from an ideal sp2 bond angle, i.e. 120°, is larger in the case of product 3; this contributes the instability of product 3 relative to product 4.
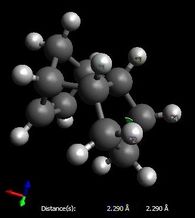
The higher Van der Waals energy of product 3 compared to product 4 (13.3 vs 10.6 kcal/mol)is due to an increased amount of H-H Van der Waals repulsive interactions : as shown here below, product 3 suffers from two of these, whilst product 4 only suffers from one.
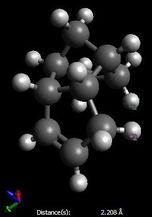
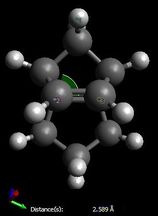
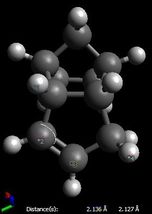
Finally, it is worth noting that the difference in electrostatic energies can be explained by the through space distance between the partially negative, nucleophilic allylic carbons, and the electrophilic overhanging hydrogens: indeed, as shown here below, these distances are shorter in the case of product 4 (2.14 and 2.13 Å vs 2.59 Å), resulting in increasing interactions in product 4 relative to product 3; however, this effect is negligible space compared to the others.
| Strain at the sp2 centre | Van der Waals interactions | Electrostatic interactions | |||
|---|---|---|---|---|---|
 |
 |
 |
 |
 |
|
| Product 3 | Product 4 | Product 3 | Product 4 | Product 3 | Product 4 |
Comparison of both Atropisomers
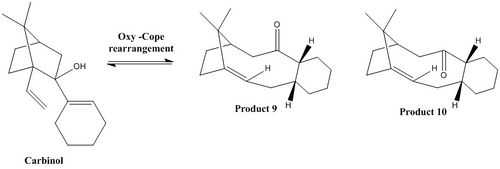
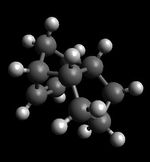
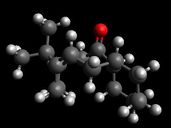
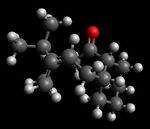
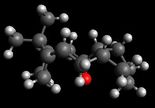
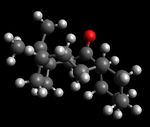
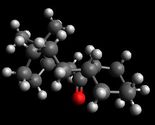
This part experiment consists in looking at the geometry of an intermediate, involved in the synthesis of Taxol, proposed by Paquette, which is obtained from a reversible anionic oxy-Cope rearrangement of a carbinol, shown here below. This intermediate possesses two atropisomers, product 9 and product 10, shown here above, according to Paquette[5]. Atropisomers are 'nonsuperimposable enantiomers'[2] due a restricted rotation along a single bond: associated with a high energy barrier.
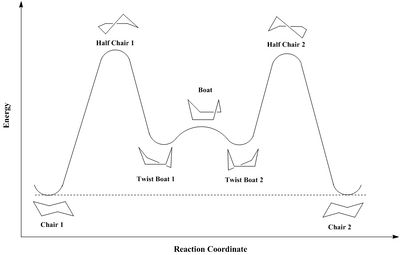
These intermediates correspond to fused rings, which each can adopt different conformations, resulting in multiple different geometries. Indeed, as shown on following the energy profile, cyclohexane possesses four different energy minima: 2 chairs (which global minima) and 2 twist-boats (which correspond to local minima). Because of 'transannular interactions'[5], the cycloheptane ring possesses a much higher degree of strain than the cyclohexane one; therefore, the lowest transition state energy conformer is determined by modifying cyclohexane ring's conformation and not cycloheptane ring's conformation.
Both atropisomers were created on Avogadro and were optimised using the MMFF94s force field. Both chair conformations for both atropisomers were studied and compared to both twist-boats.
The previous results confirm that the twist-boat geometry does not correspond to a global energy minimum and hence is 'more energetically expensive' than the chair conformation[5]. Indeed, in the case of product 9: twist-boat 1 is higher in energy than both chair conformations (60 and 24 kJ/mol respectively), whilst twist-boat 2 is 26 kJ/mol lower in energy than chair 1, but still 6 kJ/mol higher in energy than chair 1, corresponding to the lowest energy conformation for product 9. In the case of product 10, both twist-boats are lower in energy than chair 1 (16 and 7 kJ/mol respectively) but still higher in energy than chair 2 (25 and 34 kJ/mol respectively), corresponding to the lowest lowest energy conformation for product 10. This is due to a higher degree of steric hindrance in the twist-boat compared to the chair conformation, due to stronger torsional strain (product 9: 6.71 and 3.01 kcal/mol higher than chair 1 for twist-boat 1 and 2 respectively/ product 10: 3.35 and 4.31 kcal/mol higher than chair 2 for twist-boat 1 and 2 respectively)and angle bending (5.8 and 1 kcal/mol higher than chair 1 for twist-boat 1 and 2 respectively/ product 10: 0.7 and 2.28 kcal/mol higher than chair 2 for twist-boat 1 and 2 respectively), as well as an increased amount of unfavourable Van der Waals interactions (product 9: 3.6 and 1.4 kcal/mol higher than chair 1 for twist-boat 1 and 2 respectively/ product 10: 1.73 and 1.31 kcal/mol higher than chair 2 for twist-boat 1 and 2 respectively).
Moreover, product 10's most stable chair conformation is 9.9 kcal/mol, i.e. 60 kJ/mol, lower in energy than that of product 9. This is essentially due to the much higher angle bending energy of product 9 compared to product 10 (9.4 kcal/mol), which can be explained by looking at two significant angles: the first one being the bond angle involving sp2 hybridised centres and an adjacent sp3 carbon, which is is equal to 123.4° for product 9 and 122.6° for product 10, and hence is closer to an ideal sp2 bond angle in the case of product 10; and the second one corresponding to the angle at the carbonyl center, which is equal to 123.4° for product 9 and 118.4° for product 10, and hence is closer to an ideal sp2 bond angle in the case of product 10.
Explanation for their abnormal unreactivity
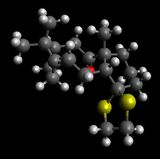
According to Bredt's rule, double bonds at ring junctions are unfavourable due to both ring strain and angle strain, and should therefore lead to increased reactivity[6]. However, subsequent functionalisation of alkene in both product 17 and 18 were found to occur at an abnormally slow rate.[1] In fact, product 9 and 10 belong to class of compounds known as 'hyperstable' olefins, 'which are less strained than the parent hydrocarbon'[6] and hence show 'decreased reactivity because of the bridgehead location of the double bonds'[6]. To check this theory, geometries of the corresponding alkanes were optimised using a MMFF9s force field to determine their relative energies and hence calculate the 'olefin strain' energy (OS), 'defined as the difference between the strain energy of an olefin and that of its parent hydrocarbon'.
The OS was found to be equal to -9.3 kcal/mol i.e. -21 kJ/mol and to -9.8 i.e. -41 kJ/mol for product 9 and 10, respectively; therefore this value was found to be negative, in both cases, which confirms that the enhanced stability of the alkene relative to its corresponding alkane. In other words, such olefins are found to be abnormally unreactive not because of steric hindrance or to enhanced π-bond strength but because of 'special stability afforded by their cage structure'[6].
As shown here below, in both hydrogenated products, C1-C2-C3 angles are approximately equal to 120° (120.3 and 120.7°), which results in a large amount of strain (as an ideal sp3 hybribised bond angle is usually equal to 109.5°) and hence account for their much higher bending energies. Changing C1's hybridisation, at the bridge junction, from sp3 , in the alkane derivatives, to sp2, in the alkenes, minimises the angle bending, in the latter ones, and hence results in their enhanced stability.
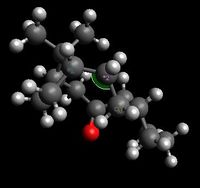

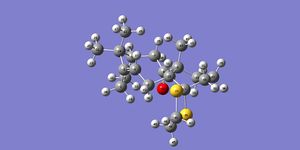
This part of the experiment consists in running a spectroscopic analysis on product 18, which corresponds to a derivative of product 10. As for product 10, it possesses multiple conformers, but such an analysis needs to be done on the most stable conformer. Bearing in mind, the previous results, the cyclohexane ring should be in its chair conformation. However, analysis was also run on the boat conformer, which corresponds to an energy maximum, in order to see how the structure of the molecule might affect the obtained results.
First Optimisation
Both conformers were created in Avogadro and optimised using a MMFF94s force field. As excepted, the chair conformation corresponds to the lower energy conformer; however, surprisingly, energies of both conformers only differ by 2 kcal/mol i.e. 8 kJ/mol.
Comparison between both Atropisomers
For the sake of the argument both atropisomers (17 & 18), in their chair conformations, were optimised using a DFT method at the B3LYP/6-31G(d,p) level of theory, to find their Gibbs free energies and check that 18 is indeed more stable than 17.
| Atropisomer 18 | Atropisomer 17 | |
|---|---|---|
| Gibbs Free Energy G(a.u.) | -1651.418625 | -1651.408874 |
| ΔG (a.u.) | -0.009751 | |
| ΔG (kJ mol-1) | -25.60 | |
| Equilibrium constant K | 30577.0 | |
The Gibbs free energies conform the predicted enhanced stability of atropisomer 18 relative of atropisomer 19, which results in an extremely high value equilibrium constant and hence a very poor concentration of atropisomer 17 in solution. Therefore, NMR simulation was only performed on 18, for better comparison with experimental data.
NMR Analysis
The previous geometries were loaded onto Gaussian and were further optimised using a DFT method at a 6-31G(d,p)higher level of theory. To run the NMR simulation, the addditional keywords were added: FREQ NMR and EmpiricalDispersion=GD3, and the chloroform was used as the solvent.
1H NMR Spectrum
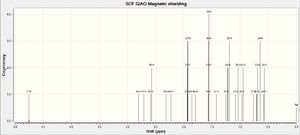
The obtained 1H NMR Spectrum for both conformers are shown here below. The obtained chemical shifts were tabulated and then compared to experimental data.
| Chair Conformation | Boat Conformation | |
|---|---|---|
| Structure | 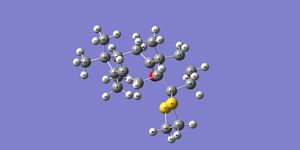 |
|
| Spectrum | 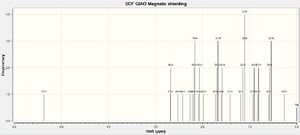 |
 |
| Atom # | Chemical Shift (ppm) | |
| 37 | 5.37 | 4.75 |
| 46 | 2.68 | 2.80 |
| 47 | 2.71 | |
| 45 | 2.53 | 2.58 |
| 48 | 2.43 | |
| 35 | 2.26 | 2.32 |
| 49 | 2.18 | 2.23 |
| 50 | 1.89 | |
| 19 | 1.56 | |
| 51 | 2.08 | 1.93 |
| 22 | 1.98 | |
| 31/32 | 1.89 (1.69+2.08/2) | 1.56 |
| 34/20 | 1.59 | |
| 21 | 1.41 | 1.42 |
| 29/30 | 1.26 (1.70+0.82/2) | 1.22 |
| 36 | 1.14 | 1.06 |
| 52/53 | 1.03 (1.14+0.92/2) | 1.24 (1.79+0.68/2) |
| 42-44 | 0.96 (1.70+0.92+0.27+/3) | 0.95 (1.21+1.22+0.68/3) |
| 23-25 | 0.95 (1.37+0.57+0.57/3) | 0.74 (1.05+0.58+0.58/3) |
| 26-28 | 0.84 (1.14+0.57+0.57/3) | 0.79 (0.96+0.76+0.68/3) |
| Literature [7] | Computational Results | ||
|---|---|---|---|
| Atom # (possible assignment) | δ Range (ppm) | ||
| Chair Conformation | Boat Conformation | ||
| 5.21 (m, 1H) | 34 | 5.37 | 4.75 |
| 3.00-2.70 (m, 6H) | 35/ 49/ 50/ 22/ 31/ 32 | 2.18-1.89 | 2.23-1.93 |
| 2.70-2.20 (m, 4H) | 45-48 | 2.62-2.43 | 2.80-2.58 |
| 2.70-2.20 (m, 6H) | 19/ 34/ 20/ 21/ 29/ 30 | 2.18-1.26 | 1.56-1.05 |
| 1.58 (t, 1H) | 51 | 2.08 | 1.56 |
| 1.50-1.20 (m, 3H) | 36/ 52/ 53 | 1.14-1.02 | 1.21-1.07 |
| 1.10 (m, 3H) | 42-44 | 0.96 | 0.95 |
| 1.07 (m, 3H) | chair : 23-25 boat: 26-28 |
0.95 | 0.80 |
| 1.03 (m, 3H) | chair : 26-28 boat: 23-25 |
0.84 | 0.74 |
As expected and shown in the above table, the most deshielded proton is # 34, which corresponds to the alkene proton, due to 'ring current'. Both conformers exhibit chemical shifts that are close to the literature value of 5.21 ppm; however, the chair conformation shows a smaller chemical difference: Δδ(chair) = 0.16 ppm and Δδ(boat) = 0.46 ppm.
However, several differences arise between the reported spectrum and the calculated one. First, it should be noted that all calculated chemical shits are lower the reported literature values (0.56 ppm lower on average), which shows the limitations of these methods in predicting the real spectrum.
The second main difference involves the reordering of multiplet 2 and 3 in the calculated spectra. As a result, in the calculated spectra, protons on the dithiane ring (# 45-48), are the most deshielded among all other ring protons. This could be have been explained by the close proximity of the sulfur atoms; however, this is does not fit with the experimental data.
The chemical shift of proton # 51, differ significantly to the experimental value (0.5 ppm higher), in the case of the chair conformation ; whilst it very close to the experimental value (only 0.02 ppm lower), in the case of the boat conformation. Proton # 51 was assigned as a triplet to due its coupling to protons # 49 and 50.
It is worth noting theses calculations are based on the assumption that the molecule static and hence uses a time-averaged geometry of to compute the spectrum. However, terminal carbon-carbon bonds are free rotate; and this phenomenon is faster than the NMR timescale, which leads to the degeneracy of the three methyl protons. Therefore, to obtain sensible results (and comparable to the literature), the calculated shifts of methyl protons (# 42-44, # 23-25 and 26-28), as shown in the first table. This gives rise two three singlets of multiplicity 3 As expected from the experimental data, with chemical shifts that are relatively close the experimental data, especially in the case of the chair conformation, where Δδ(#42-44) = 0.15 ppm, Δδ(#23-25) = 0.12 ppm and Δδ(#26-28) = 0.19 ppm.
This method was also applied on protons attached to the cyclohexane ring (# 29/30, 31/32 and 52/53) due to ring flipping, which occurs faster than the NMR timescale. It is worth noting that the other chair conformer of the cyclohexane ring could have also been computed in order to average chemical shifts of axial and equatorial protons between both conformations. Further study could also involve computing Boltzmann distributions for both extreme conformers, i.e. and the chair and the boat conformers, in order to find their relative contributions to the chemical shifts. These weighing coefficients could be then applied to the calculated chemical shifts of both conformers to find new data, which should in theory fit better with the experimental data.
This averaging was not not computed for protons attached the 10-membered ring due to the rigid cage structure, preventing ring flipping. As a result, hydrogens that are closer to the electronegative oxygen of the carbonyl group, for example protons # 19 and 22, which are pointing inwards, are more deshielded than protons # 20 and 21, which are pointing outwards: in the case of the chair conformer, δ(19)= 2.17 ppm, where d(O-H)=2.47 Å, and δ(22)= 1.98 ppm, where d(O-H)= 2.37 Å, whilst δ(20)= 1.59 ppm, where d(O-H)=4.01 Å, and δ(21)= 1.41 ppm, where d(O-H)= 3.937 Å.
This shows the limitations of these methods to predict the real spectra. Another a basis set could have been chosen, to optimize further the molecule, in the hope of obtained more precise results.
13C NMR
| Chair Conformation | Boat Conformation |
|---|---|
 |
 |
Including correcting terms
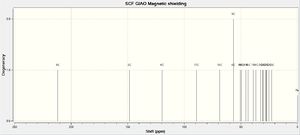
Simulating 13C NMR spectra using the previous results in systematic errors in the carbonyl chemical shift: it is usually off by 5ppm. This can be corrected using the following formula: δcorr = 0.96δcalc + 12.2.
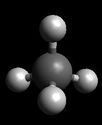
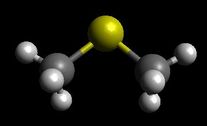
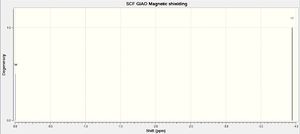
Carbons that are directly attached to 'heavy' elements, including sulfur, also need to be corrected, in order to include Spin-orbit coupling. To find the correction term, both dimethylsulfide and methane structures were first optimised on Avogadro, using a MMFF94s force field,and then re-optimised at a DFT B3LYP/ 6-319(d,p)higher level of theory on Gaussian 09 to obtain an NMR simulation of both structures.
| Dimethylsulphide | Methane | |
|---|---|---|
| 13C NMR spectrum | 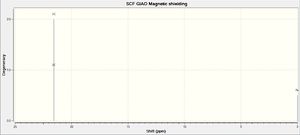 |
 |
| Link to D-space | DOI:10042/26725 | Calculation perfomed on the laptop |
| δ (ppm) | 21.5487000000 | -3.9476000000 |
| δcorrec (ppm) | 25.4063 ≈ 25.41 | |
As a result, 25.4 ppm should be added to chemical shifts corresponding to C40 and C41, directly bonded to one sulfur, whilst a correction term of 50.8 ppm should be included for C17, attached to two sulfur atoms.
Assignment and Comparison with literature
| Atom # | 8 | 3 | 4 | 17 | 18 | 6 | 9 | 16 | 10 | 40 | 14 | 41 | 7 | 5 | 13 | 1 | 11 | 2 | 12 | 15 |
|---|---|---|---|---|---|---|---|---|---|---|---|---|---|---|---|---|---|---|---|---|
| Literature[7] | 211.49 | 148.72 | 120.90 | 74.61 | 60.53 | 51.30 | 50.94 | 45.53 | 43.82 | 43.28 | 38.73 | 36.78 | 35.47 | 30.84 | 30.00 | 25.56 | 25.35 | 22.21 | 21.39 | 19.83 |
| Chair conformation | 212.33 | 147.77 | 121.05 | 94.15 | 61.22 | 55.82 | 54.64 | 50.13 | 50.58 | 48.04 | 43.17 | 43.09 | 40.21 | 35.70 | 35.54 | 29.65 | 28.44 | 26.24 | 24.60 | 23.37 |
| Chair conformation [corrected] | 216.04 | 144.97 | 73.45 | 68.42 | ||||||||||||||||
| Boat conformation | 211.84 | 148.43 | 119.75 | 89.23 | 68.58 | 56.56 | 56.56 | 50.55 | 49.43 | 45.52 | 43.63 | 39.08 | 36.75 | 32.41 | 30.81 | 30.29 | 27.75 | 26.99 | 25.34 | 22.79 |
| Boat conformation [corrected] | 215.57 | 140.04 | 74.84 | 70.93 |
The differences between the obtained chemical shifts and the ones reported in the literature were calculated and the following graphs were drawn in order to better visualise deviations from the excepted values. As shown above, deviations from the reported values are essentially less than +/-5 ppm (Δδ(average)= 4.76 and 2.77 ppm for the chair and boat respectively); the main difference arises for carbons bonded to sulfur atoms: for example, Δδ(C17)= 19.54 and 14.64 ppm for the chair and boat respectively. However, applying the previous correction term, does not help; in fact, it increases strongly the difference in chemical shifts: now, Δδ(C17)= 70.36 and 65.43 ppm for the chair and boat respectively. However, the method used to determine the correction is relatively simplistic and hence not very reliable. In fact, Spin-orbit couplings can probably not be summed up directly, which might explain why deviation between the calculated value and the one reported in the literature is larger for C17 than for C40 & 41. Finally, the differences between the literature values and the chemical shifts calculated for both conformations are relatively similar. In fact, the chemical shifts calculated for the boat conformation seem to be closer to the ones reported in the literature; this is not consistent with the fact that the boat conformation is higher in energy and that, hence, the chair conformation should predominate in solution, which illustrates the limitations of such computational analysis.
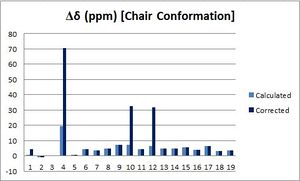 |
 |

|
PART 2 : Analysis of the properties of the synthesised alkene epoxides
Crystal Structures of Shi and Jacobsen Catalysts
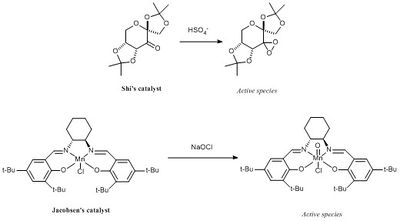
Both Shi and Jacobsen catalysts can be activated as shown here below to carry out asymmetric epoxidation of alkenes. To understand their relative selectivity both crystal structures were found in the Cambridge Crystal Database (CCD) using Conquest and then directly loaded was directly loaded onto Mercury for analysis.
Shi catalyst
Shi's catalyst is fructose-derived ketone, reported as a 'highly reactive and enantioselective asymmetric epoxidation catalyst for trans-and trisubstituted olefins'[8], which could be due 'steric effects between the dimethyl ketal groups and the substituents on the incoming alkene'[9].
The NELQEA01 crystal structure found on the CCD was directly loaded onto Mercury for analysis. The structure showed a pair of molecules in the unit cell. For both molecules, carbon-oxygens bond lengths were measured to analyse bond distances at the anomeric centres.

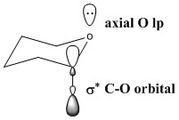
An anomeric centre is a stereocentre resulting from the formation of an acetal (or ketal) due to the intramolecular attack of an aldehyde (or ketone)[10]. Two configurations of at the anomeric center exist, leading to two diastereisomers, the α and the β anomers, in equilibrium with each other[2]. Due to unfavourable 1,3 diaxial interactions, hetero substituents usually adopt the equatorial position; however, in this case, electronic effects need to be considered. Indeed, as shown on the left, the axial position of the -OR group allows electron donation of the axial oxygen lone pair into the the C-O σ* orbital, which stabilises the α-anomer relative to the β-anomer[2]. It is worth noting that this effect increases with increasing electronegativity of the anomeric substituent. Therefore this effect should be relatively strong in the Shi catalyst. This effect also accounts for the different C-O bond lengths in the α-anomer (donation of the O lp into the C-O σ* orbital results in a weakening and hence a lengthening of the C-O bond) and is perfectly illustrated by Shi's crystal structure.
Each molecule has 3 anomeric centers: one on each 5-membered ring and one on the 6-membered ring. Several points can be highlighted : firstly, carbon-oxygens bond distances and more specifically anomeric bonds are different between both molecules; secondly, as expected, within the same molecule, carbon-oxygens distances are different on either side of the anomeric center; finally, the anomeric distances are different at every anomeric center.
Looking at molecule 1: C10-O4 is 0.028 Å longer than C10-O5 and hence weaker; this is due to donation the axial O4 lp into of into the C10-O5 σ* orbital. Similarly, C9-O2 is 0.031 Å longer than C19-O1 due to donation of the axial O2 lp into of into the C9-O2 σ* orbital. Finally, C2-O2 is only 0.011 Å longer than C2-O6 (and is fact shorter than a normal C-O bond, equal to 1.438 Å). This is because of two competing anomeric effects almost cancelling each other. Similar effects are also observed in molecule B.
Comparison with NELQEA crystal structure
Jacobsen catalyst
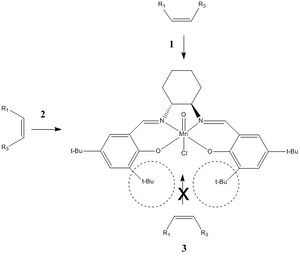
Jacobsen et al. initially rationalised the high degree of Jacobsen's catalyst for asymmetric epoxidations by a 'side-on' perpendicular approach of the olefin to the metal-oxo bond allowing favourable orbital overlap[11]. They favoured approach 1 over approaches 2 & 3 due of the presence of the sterically bulky tert-butyl groups.
However, Katsuki showed that this could not account for the exceptionally high enantiomeric excess observed for cis-olefins, nor chirality effects at the 3,3'-positions. Later computational studies, performed by H. Jacobsen and Cavallo, showed that the salen ligand is in fact nonplanar. This means that the tert-butyl groups will not sterically block approach 2 of the olefin, and that approach 2 is actually the favoured one.
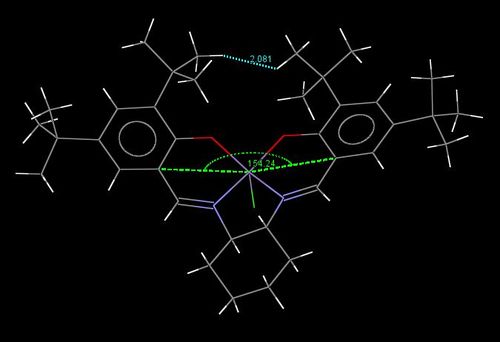
This is illustrated by Jacobsen's TOVNIB01 crystal structure, which was found on CCDC and was then loaded onto Mercury, as shown here below. Contact interactions between the tert-butyl groups were analysed.

As shown in the picture here above, the crystal structure presents multiple unfavourable Van der Waals interactions due to the close proximity of several hydrogens: seperated by less than 2.4 Å, i.e.less than twice Van der Waals radii. This includes distances hydrogens within a same t-butyl group [e.g. 2.278 Å], between phenyl hydrogens and t-butyl hydrogens attached onto the same phenyl group [e.g. 1.920 Å].
However, it worth noting that several protons are present at their 'maximum stickiness' i.e. are seperated by distances that are almost exactly equal to twice Van der Waals radii [e.g. 2.421 Å], which corresponds to favourable Van der Waals interactions. Other protons that are seperated by larger distances [e.g. 2.694 Å] will also experience favourable interactions their magnitude will decrease with increasing distance.
Comparison with TOVNIB02 crystal structure
Analysis of two alkenes epoxides: (R)-Styrene & (R,R)-trans-Stilbene Oxides
Epoxidations of Styrene and Trans-Stilbene using Shi and Jacobsen catalysts, will give relative mixtures of (R) and (S)-Styrene oxides and (R,R) and (S,S)-trans-Stilbene oxides, respectively. The absolute configurations of both enantiomers can then be assigned by looking their chiral properties, as demonstrated here below.

Optimisation and NMR Analysis
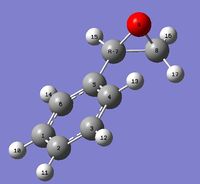
The epoxides' structures, starting with (R)-Styrene oxide, were initially optimised in Avogadro using the MMFF94s force field. Then they were further optimised on Gaussian using a DFT method at a B3LYP 6-31G(d,p) level of theory. A NMR simulation was then performed, chemical shifts were compared to literature values. Each epoxide posseses two enantiomers; however, calculations were only run on one of them as the NMR should not differ from enantiomer to the other. It is worth noting that coupling constantscould have been calculated but due to lab constrained; this was not done.
(R)-Styrene Oxide
Optimisation
NMR Analysis
| Spectrum | Atom # | Calculated δ(ppm) | Literature [400 MHz, CDCl3][12] | Comparison with literature |
|---|---|---|---|---|
 |
10-14 | 6.87 | 7.33-7.24 (m,5H) | 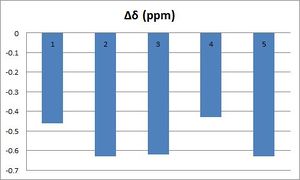
|
| 13 | 6.61 | |||
| 15 | 3.18 | 3.80 (dd, J= 2.8, 4.1, 1H) | ||
| 16 | 2.65 | 3.08 (dd, J= 4.1, 5.6, 1H) | ||
| 17 | 2.12 | 2.75 (dd, J=2.8, 5.6, 1H) | ||
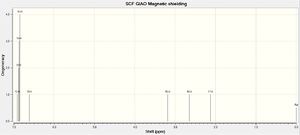
| The relative chemical were tabulated and compared to literature values. They all appear at slightly lower chemical shifts than the excepted values. However, the major difference is that in the real spectrum all aromatic protons are in the same environment, whilst calculations lead to two distinct environments : H10-14 are showed at 6.87, whilst H13 (closer to the electronegative oxygen: d= 2.54 Å)) appears at 6.61ppm. As previously mentioned, this is due to the lack of time-averaging effects when running calculations.To determine the differences in chemical shifts, 6.87 ppm was compared to the maximum of the aromatic's chemical shift range (7.33 ppm), whilst 6.61 was compared to the minimum value (7.24). As illustrated by the graph, the calculated chemical shifts are in good agreement with the ones reported in the literature: Δδ(max)=0.63 ppm and Δδ(max)= 0.56 ppm. | ||||
| Spectrum | Atom # | Calculated δ(ppm) | Literature [100 MHz, CDCl3][12] | Comparison with literature |
|---|---|---|---|---|
 |
5 | 134.71 | 137.5 | 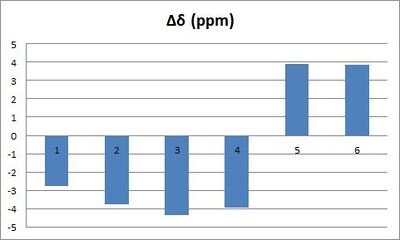
|
| 1/3 | 124.45 | 128.2 | ||
| 2 | 123.66 | 128.0 | ||
| 4/6 | 121.36 | 125.3 | ||
| 8 | 55.01 | 51.1 | ||
| 7 | 54.85 | 51.0 | ||
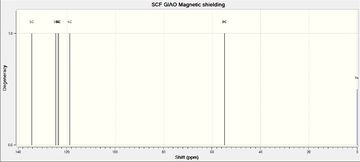
| Carbon 1 and 3 and 4 and 6 should be equivalent because of the rapid rotation of the C-C single bond between the aryl ring and the epoxide group, therefore, their chemical shifts were averaged using an arithmetic mean.
The results obtained by calculation are pretty consistent with the chemical shifts reported in the literature. Indeed, as illustrated by the graph here below, deviations are always less than +/-5 ppm; as a matter of fact, Δδ(max)=4.43 ppm and Δδ(average)= 3.76 ppm. | ||||
(R,R)-Trans-Stilbene Oxide
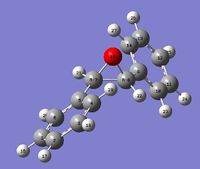
Optimisation
NMR Analysis
| Spectrum | Atom # | Calculated δ(ppm) | Literature [400 MHz, CDCl3][12] | Comparison with literature |
|---|---|---|---|---|
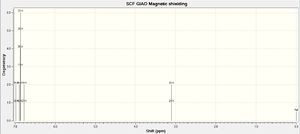 |
18/ 26 | 6.96 | 7.59-7.25 (m, 10H) | 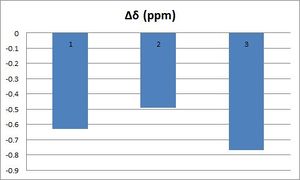 |
| 16/ 24/ 17/ 25/ 20/ 23 | 6.86 | |||
| 27/ 19 | 6.76 | |||
| 21/ 22 | 3.10 | 3.87 (s, 2H) | ||
| Again, they all appear at slightly lower chemical shifts than the excepted values. However, the major difference is that in the real spectrum all aromatic protons are in the same environment, whilst calculations lead to two distinct environments : H18 & 26 are showed at 6.96ppm, whilst H16, 24, 17, 25, 20 & 23 appear at 6.86 ppm and H 27 & 19 at 6.76. Again, this is due to the lack of time-averaging effects when running calculations and the difference in chemical shifts between the protons correlates with their relative distances to the oxygen atom. To determine the differences in chemical shifts, 6.96 ppm was compared to the maximum of the aromatic's chemical shift range (7.59 ppm), whilst 6.76 was compared to the minimum value (7.25).As illustrated by the graph, the calculated values of the chemical shifts fit pretty well with the ones reported in the literature: Δδ(max)=0.77 ppm and Δδ(max)= 0.63 ppm. | ||||
| Spectrum | Atom # | Calculated δ(ppm) | Literature [100 MHz, CDCl3][12] | Comparison with literature |
|---|---|---|---|---|
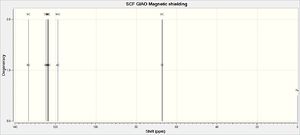 |
5/9 | 133.69 | 137.1 | 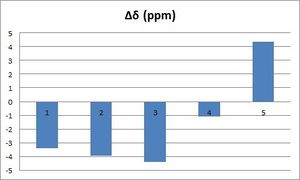 |
| 1/3/11/13 | 124.54 | 128.5 | ||
| 2/12 | 123.92 | 128.3 | ||
| 4/6/10/14 | 121.42 | 125.5 | ||
| 7/8 | 67.17 | 62.8 | ||
| As illustrated by the graph here, after taking into account time-averaging effects, the computed chemical shifts are pretty consistent with the chemical shifts reported in the literature. Indeed, as illustrated by the graph here below, deviations are always less than +/-5 ppm; as a matter of fact, Δδ(max)=4.38 ppm and Δδ(average)= 3.44 ppm. | ||||
Determination of their absolute configurations
In order to predict the enantioselectivity of each catalyst, the absolute configurations of the studied epoxides were determined by calculating Optical Rotary Power (ORP) for both (R)-Styrene and (R,R)-trans-Stilbene oxides. OPR were also calculated for their enantionmers, i.e. (S)-Styrene and (S,S)-trans-Stilbene oxides, to check that their values were identical and of opposite signs. To check further check that their absolute configurations were assigned properly, all four Vibrational Circular Dichroism (VCD) spectra were analysed. It is worth noting that usually, this can have further be done by looking at the Electronic Circular Dichroism (ECD); however, this useless for epoxides, for which no appropriate chromophore exist[1].
Optical rotations
The job was run using the output optimised geometries of the previous NMR simulation, using the same basis set, including 'polar(optrot)' in the keyword section. The ORP were calculated found at both 589 and 365nm, in chloroform, and compared to literature.
| Light Frequency (nm) | Epoxide | |||
|---|---|---|---|---|
| (R)-Styrene Oxide DOI:10042/26753 |
(S)-Styrene Oxide DOI:10042/26749 |
(R,R)-Tans-Stilbene Oxide DOI:10042/26754 |
(S,S)-Tans-Stilbene Oxide DOI:10042/26750 | |
| 589 | -29.57 [lit1: -33.3° ] [13] [lit2: -22.5°, CHCl3][14] |
+208.95 or +28.95 | +302.34 [lit1: +319.8 (c 0.80, benzene) (93% ee)] [15] [lit2: +239.2 (c 0.45, CHCl3)][16] |
-103.3 or -283.33 |
| 365 | -92.20 | +794.90 or +94.90 | +1271.31 | -319.38 or -1219.33 |
As shown here above, and as expected, in the case of Styrene Oxide, OPRs for both enantiomers are almost equal and opposite: as a matter of fact, Δ(ORP)=0.62° as ORP((R)-Styrene Oxide)=-29.57 and OPR=((S)-Styrene Oxide)= +208.95°, which also corresponds to +28.95°. Also, the calculated value for(R)-Styrene Oxide is very close to the first literature value found[Δ(ORP)=3.6°]. However, it is worth noting that calculations were run using chloroform and that in the first reference, the solvent was not precised, whilst in the Dictionary of Organic Compounds, the optical rotation was measured to be -22.5° in chloroform. This is still relatively close to the calculated data[Δ(ORP)=7.5°]; and, the signs match up, meaning that the absolute configuration was properly assigned. It is worth noting that this method is reliable for optical rotations larger than 100°, but becomes, but becomes increasingly unreliable for lower values, and here ORP≈25 i.e (1/4)x100, which may explain the difference in the values obtained.
In the case of trans-Stilbene Oxide, OPRs for both enantiomers are also, almost, equal and opposite:Δ(ORP)=19.01 as ORP((R,R)-trans-Stilbene Oxide)=+302.34 and OPR=((S,S)-trans-Stilbene Oxide)= -103.3, which also corresponds to +283.3° In the case of (R,R)-trans-stilbene epoxide, ORP>100°; therefore, the calculated value should be more reliable. As shown here above, the calculated value is relatively close to the experimental one measured by Shi et al.[15] [Δ(ORP)=17.5°]. However, this was reported in benzene and calculations were performed in chloroform; therefore, these values cannot be directly compared, but it should be noted that the signs match up, meaning that the absolute configuration was properly assigned. The calculated ORP is still reasonable close to reported one measured in chloroform [Δ(ORP)=63.1°].
The differences between the calculated ORP and the experimental data highlight the limitations of such computational techniques to determine precisely the absolute configurations of compounds. In fact, the ORP is affected by the solvent, temperature but also concentration, which makes it difficult to compare the calculated values to the experimental data. Also, this program is becomes unreliable for small ORP is is highly sensitive to the conformation; hence changing slightly the conformation of one of the epoxide will directly affect the calculations.
VCD
By detecting differences in attenuation of left and right circularly polarized light passing through a sample, VCD proves to be an excellent technique for assigning absolute configuration of epoxides; therefore, VCD spectra of the all four epoxides were simulated and compared. This was done by using the previously optimised structures and adding the following keywords: 'EmpiricalDispersion=GD3 integral=grid=ultrafine'.
| Styrene Oxide | trans-Stilbene Oxide | ||
|---|---|---|---|
| (R)-Styrene Oxide | (R)-Styrene Oxide | (R,R)-trans-Stilbene Oxide | (S,S)trans-Stilbene Oxide |
DOI:10042/26755 |
DOI:10042/26751 |
DOI:10042/26752 | |
| As expected, VCD spectra are of 'opposite signs' for both enantiomers; in other words, they are mirrors images of each other with respect to the x axis. This is because both chiral centers absorb equal amounts of light, but in opposite direction, with respect to the circularly polarized light's center, as previously illustrated by the calculated optical rotations. | |||
Analysis of Transition State Data for Trans-β-Methyl Styrene's epoxidation

In order to understand better the high enantioselectivities associated with both catalyst, transitions states involved in Trans-β-Methyl Styrene's epoxidation, i.e. (R,R) and (S,S) Transition States, were studied.
Calculation of the enantiomeric excess
By measuring how pure a substance is, the 'enantiomeric excess' highlights the level of enantioselectivity of the a reaction. It can be predicted using free energies, by converting them into an equilibrium constant. By considering that both enantiomers, in this case (R,R) and (S,S), the following can be shown:

All transitions states for the formation both enantiomers using Shi catalyst, were inspected in order to determine the lowest transition state. To do so, values of the total energy of each system was thermally corrected, the entropic contribution was included to the free energy and solvation was taken into account. The 'sum of electronic and thermal Free Energies' are reported here below. The same procedure was applied using Jacobsen's catalyst.
| Shi's Catalyst | Jacobsen's Catalyst | |||
|---|---|---|---|---|
| Transition State # | (R,R)-Transition State | (S,S)-Transition State | (R,R)-Transition State | (S,S)-Transition State |
| 1 | -1343.022970 | -1343.017942 | -3383.253816 | -3383.262481 |
| 2 | -1343.019233 | -1343.015603 | -3383.254344 | -3383.257847 |
| 3 | -1343.029272 | -1343.023766 | ||
| 4 | -1343.032443 | -1343.024742 | ||
After the lowest energy transition states were identified using both catalysts, the enantiomeric excesses were calculated, using the procedure explained above.
| Shi | Jacobsen | |
|---|---|---|
| Lowest Energy Transition State | (R,R)-4 | (S,S)-1 |
| ΔG (a.u) | 0.007701 | -0.008665 |
| ΔG (kJ.mol-1) | 20.219 | 22.750 |
| K | 0.0002868 | 9679.25 |
| ee (%) | 99.94 | 99.98 |
| Literature | 91-92 % [CH3CN/DMM, 0°C] [17] | not directly reported |
| 95.5 % [CH3CN/DMM, -10°C] [18] | For the cis-olefin: 92 % [DCM, 4°C] [11] | |
| 96 % [CH3CN/DMM][8] | Using a slightly modified version of Jacobsen's catalyst : 83 & 86 % [19] |
As shown, here above, the enantiomeric excess using Shi's catalyst was found to be equal to 99.94%. This fits pretty well with the values reported in the literature: between 91%[17] and 96%[8], depending on the reactions conditions: temperature and solvent. It is worth noting, that these calculations were run using water as the solvent; this is therefore not representative of reaction conditions, and might explain why the obtained value is higher than the expected one.
The very high degree of enantioselectivity of trans-β-methyl styrene's epoxidation is consistant with how Shi's catalyst was previously defined: i.e. 'highly reactive and enantioselective asymmetric epoxidation catalyst for trans-and trisubstituted olefins'[8].
The enantiomeric excess using Jacobsen's catalyst was found to be equal to 99.98%, which is surprisingly high. Indeed, Jacobsen's catalyst was proven to be a 'highly enantioselective catalyst for epoxidation of conjugated cis-disubsituted olefins' (for example,cis-methyl styrene was epoxidation was performed with 92% enantioselectivity[11])and up until 1994 only slow rates and low enantioselectivities (<65% ee)[20] were reported for analogous trans-disubstitued olefins. This was previously rationalised by the 'side-on' approach (trajectory 1)[20] of the olefin, leading to steric repulsion between the metal center and the the R2 group, in the case of trans-disubstitued olefins (and trisubstituted olefins, but not in cis-disubstitued olefins) as shown here below .

However, it was more recently demonstrated by Jacobsen, that, this is not the right trajectory of approach (and that trajectory 2 was favoured over trajectory 2). As a result, higher levels of enantioselectivity, for instance 86% and 83%[19], were achieved using slightly modified versions of the catalyst as well as extreme conditions of temperature.
Again, the difference between the calculated value and the ones reported in the literature may be due to the choice of solvent. Finally, it should be pointed out that, in fact, calculations were not run with Jacobsen's catalyst, but with one of its derivative (probably to reduce the calculations times), which does not possess as many tert-butyl groups, enabling a complete unhindered approach 2. This might explain, why such a reaction should not be as unfavourable as reported in the literature, and should proceed with such a high level of enantioselectivity. This will be further investigated by looking at Jacobsen's (S,S)transition state.
Analysis of Shi & Jacobsen's Transition States
In order to better understand the high enantioselectivity of both catalysts, their associated transitions states were analysed.
(R,R) Shi Transition State
Comparison of the relative stabilities of (R,R) and (S,S) Transition States: a first approach
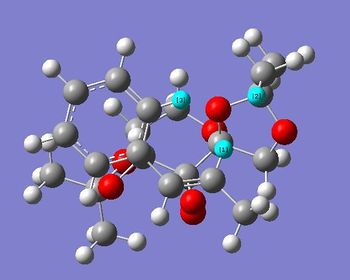
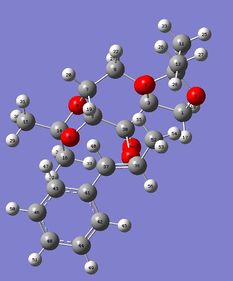
To understand the high (R,R) enantionselectivity, both (R,R) and (S,S) lowest energy transitions states were examined and compared, in a first approach.
| (R,R)- Transition State | (S,S)- Transition State |
|---|---|
 |
|
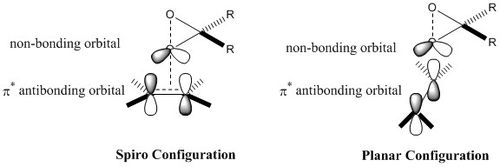
First, it should be noted that both Transition states are in there 'spiro'[8]configuration, as depicted on the image below for (R,R)- Transition State . In fact, epoxidation with Shi's catalyst can either operate with dioxiranes being in their 'spiro' or 'planar' configuration; however, the 'spiro' one is usually preferred due to favourable interaction between the oxygen lone pair (non bonding orbital) and the antibonding π* alkene orbital, which is not possible in the planar arrangement[8], as depicted here below. This is perfectly illustrated by the studied transition states.
 |
 |
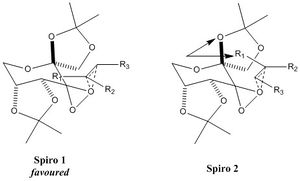
In fact, there are two spiro configurations, as illustrated here below. Here, R2=H; and in both cases, the first one is preferred due to less steric bulk. This further confirms that selectivity of Shi's catalyst arises due to steric effects between the dimethyl ketal groups and the substituents on the incoming alkene[9].
Further analysis of the transition states' geometries showed that the (S,S) Transition State presented a higher degree of steric hindrance, associated with an increased number of unfavourable Van der Waals interactions, increasing the energy of (S,S) Transition State the and hence disfavouring it relative to the (R,R) one. Indeed, in the case of the (S,S) Transition State, H19-H28 and H28-H24 through space distances are all shorter than 2.4 Å, i.e. twice Van der Waals radii: 2.32, 2.19 and 2.26 Å respectively. The (R,R) Transition State only possesses one unfavourable interaction between H1 and H2, seperated by 2.02 Å, but also one favourable dispersion interaction between H2 and H3, present at their 'maximum stickiness', i.e. seperated by 2.44 Å, which stabilises the Transition State. In fact, it is mainly the presence of these favourable interactions that explain the relative stabilities of both transition states.
Further analysis of the (R,R) Transition State
To fully understand the the high degree enantionselectivity, the lowest energy (R,R) transition state was further examined. To do so, NCI and QTAIM analysis were performed.
NCI Analysis
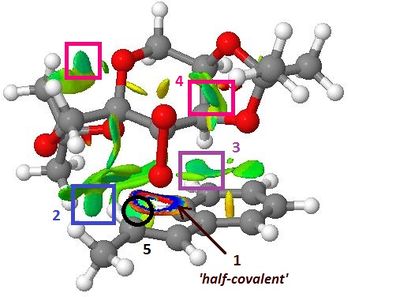
A Non-Covalent Interaction (NCI) analysis was first performed. Non-covalent interactions are weak intra or inter-molecular interactions, ranging from 0.5 to 30 kcal/mol[21], which involve dispersed electromagnetic interactions rather, contrarily to covalent bonds, which involve sharing of electrons. NCI include four types of different interactions: Van der Waals forces, π-effects, electrostatic and hydrophobic effects. As for covalent bonds, NCI are defined by the electron density curvature of a molecule.
In an NCI analysis, the colours indicate the nature of the interaction: blue for very attractive and red for strongly repulsive[1].
NCI analysis was first performed using a medium size grid cube and then using fine one. The obtained electron density surfaces look very similar; the difference lies in the precision of the contours when using a fine cube.
|
|
| Intra-molecular Interactions | Inter-molecular Interactions | ||
|---|---|---|---|
| 2 | Favourable H-H interaction Van der Waals interactions, between one of the hydrogens on the phenyl ring and the one of the hydrogens on the diacetal methyl group resulting the enhanced stability of (R,R) Transition States. | 1 | 'Half-covalent' interaction[1], both attractive and repulsive, illustrating the formation of the two new C-O bonds: the dioxirane oxygen alkene carbons are seperated by 2.27 and 2.07 Å, which is larger than typical C-O bonds (1.43 Å), but much smaller than the sum of their respective Van der Waals radii: 1.55 + 1.70=3.35 Å. |
| 3 | Favourable inter-molecular interaction between one of the phenyl carbons and of one the catalyst's cyclohexyl proton, again stabilising the transition state and hence accounting for the relative enantioselectivity of the reaction | 4 & 5 | Additional favourable inter-molecular interactions: both within the alkene [4: attraction between one of the hydrogens on the phenyl ring and one of the alkene proton], and within the catalyst [5: attraction between the dioxirane oxygen and one of the methyl protons], which further contribute to the stability of the transition state. |
QTAIM Analysis
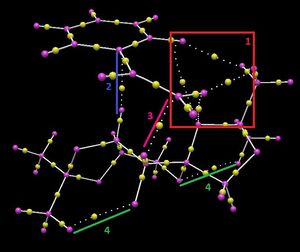
A Quantum Theory of Atoms In Molecules (QTAIM) analysis was then perfomed, which focusses on the electron density (and its curvature) in the covalent regions of molecules as well as the weaker interactions identified in a NCI analysis. It allows to identify the presence of four special critical points: either associated with bonded atoms (BCP), nuclei (NA), rings (rcp) or cages (CCL).
Inspection of the (R,R) Transition State reveals the presence of several BCPs, as small yellow spheres located along a straight path connecting two nuclei. These illustrate four different types of interactions, including three inter-molecular interactions and one intra-molecular interaction within the catalyst, which is consistent with the NCI analysis.
| Intra-molecular Interactions | Inter-molecular Interactions | ||
|---|---|---|---|
| 4 | Intra-molecular interactions within the catalyst occuring between the cyclohexyl protons and methyl protons, which stabilise the structure of the transition state. | 1 | Favourable set of inter-molecular interactions involving multiple atoms, resulting in a 'cage' like through space interaction, holding the structure still and hence accounting for the stability of the transition state and the high selectivity of the reaction. Favourable BCP interactions between one the diacetal oxygen with one of the olefin protons and the one of the phenyl protons, as well as interactions between those same protons with one of the catalyst's methyl proton. [This is consistent with the previous results.] |
| 2 & 3 | Additional BCP interactions, between one of the phenyl carbons and one of the catalyst's cyclohexyl protons (2) and one between one of the olefin carbons and another cyclohexyl proton (3). These interactions stabilise further the transition structure and hence account for the high enantioselectivity of the reaction. | ||
(R,R) Jacobsen Transition State
NCI analysis
|

|
| Intra-molecular Interactions | Inter-molecular Interactions | ||
|---|---|---|---|
| 1 | Favourable H-H Van der Waals interactions between the adjacent tert-Butyl groups, as well as attractive interaction between some of the tert-Butyl H and the O, hence blocking this site of approach | 3 | Extensive favourable non-covalent interaction in between two phenyl rings: one belonging to catalyst and the other to the olefin. This π-π stacking stabilises this transition states, and hence favours this trajectory of approach. |
| 2 | Additional favourable H-H Van der Waals interactions, stabilising the transition state | 4 | There is a very high degree of interaction between the oxygen and the alkene carbon, illustrating the formation of a new C-O bond. In fact, the oxygen is actually bonded to the alkene carbon. This is not the case in the Shi transition state, where the interaction in-between the oxygen and the alkene carbon is both attractive and repulsive and hence considered as being 'half-covalent' [in any case, contrarily to the other interactions, this is not a non-covalent interaction!]. This might explain the very high stability of the transition state and hence the strong enantioselectivity of the reaction. |
QTAIM analysis

| Intra-molecular Interactions | Inter-molecular Interactions | ||
|---|---|---|---|
| 1 | Extensive BCP interactions between the adjacent tert-Butyl groups, and between H attached to the tert-Butyl group and the oxygen, hence blocking this site of approach. | 3 | Extensive favourable BCP interaction in between the phenyl rings due π-π stacking stabilises this transition states, hence favouring this trajectory of approach. |
| 2 | Additional BCP in-between hydrogens, within the catalyst, stabilising it and hence the transition state. | 4 | Interaction between the alkene carbon and the catalyst's oxygen, illustrating the formation of a new C-O bond. |
| 5 & 6 | Additional BCP interactions: firstly, between the olefin's phenyl hydrogens and the catalyst's tert-butyl hydrogens (5) and secondly between one of the olefin's carbon and one of the catalyst's nitrogen. These inter-molecular interactions hold still the transition state's structure, stabilise it, and hence account for the high degree of enantioselectivity. | 7 | These BCP interactions illustrate co-ordination of the salen ligands to the metal center. |
Suggesting new candidates for investigation
The final part of this experiment consists in suggesting a new canditate for investigation. Two constraints must to be taken into consideration: the first one being that the absolute configuration of a compound can only be successfully determined if the magnitude of the optical rotation is greater than 100°[1]; the second one being that the alkene from which the epoxides are synthesised, must be commercially available, in order to compare computational work with expermential data, obtained by students during their lab period.

By restricting this search, on Reaxys database, to epoxides optical rotations of magnitude greater than 500°, (R)-Pulegone, a readily commercially available alkene, including from Sigma-Aldrich, was found to be a potential new candidate for investigation. Optical rotations for both enantiomers are shown here below.
| (R,R)-Enantiomer | (R,S)-Enantiomer |
|---|---|
| [α]324= + 853.9° | [α]324= -1177.9° |
Such an epoxidation could be achieved by oxidation of (R)-Pulegone with 30% hydrogen peroxide in a 30% sodium hydroxide solution[23], to achieve an ee of 64.2%[23] in favour of the (R,R) enantiomer. It would therefore be interesting to compare level of enantioselectivity using such technique to the ones obtained using either Shi or Jacobsen's catalysts.
References
<references> [13] [15] [14] [16] [17] [18] [11] [2] [1] [4] [5] [6] [7] [9] [8] [10] [12] [19] [20] [22] [23] [3] [21]
- ↑ 1.0 1.1 1.2 1.3 1.4 1.5 1.6 1.7 1.8 H. Rzepa, 'Structure Modelling, NMR simulation and Chiroptical properties', 3rd Year Synthesis Lab, Imperial College, 2013
- ↑ 2.00 2.01 2.02 2.03 2.04 2.05 2.06 2.07 2.08 2.09 J. Clayden, N. Greeves, S. Warren and P. Wothers, Organic Chemistry, Oxford University Press, Oxford, 8th edn., 2009
- ↑ 3.0 3.1 3.2 A. Bondi, J. Phys. Chem., 1964, 68, 441–451 DOI:10.1021/j100785a001 10.1021/j100785a001
- ↑ 4.0 4.1 4.2 I. Fleming, Frontier Orbitals and Organic Chemical Reactions, John & Wiley Sons, 1976
- ↑ 5.0 5.1 5.2 5.3 S. W. Elmore, L. A. Paquette, Tetrahedron Letters, 1991, 32, 319-322 DOI:10.1016/S0040-4039(00)92617-0
- ↑ 6.0 6.1 6.2 6.3 6.4 W. F. Maier and P. Von Rague Schleyer, J. Am. Chem. Soc., 1981, 103, 1891–1900 DOI:10.1021/ja00398a003
- ↑ 7.0 7.1 7.2 L. A. Paquette , N. A. Pegg , D. Toops, G. D. Maynard and R. D. Rogers, J. Am. Chem. Soc., 1990, 112, 277–283DOI:10.1021/ja00157a043
- ↑ 8.0 8.1 8.2 8.3 8.4 8.5 8.6 O. A. Wong and Y. Shi, Chem. Rev., 2008, 108, 3958-3987
- ↑ 9.0 9.1 9.2 O. A. Wong , B. Wang , M. X. Zhao and Y. Shi, J. Org. Chem., 2009, 74, 6335–6338DOI:10.1021/jo900739q 10.1021/jo900739q
- ↑ 10.0 10.1 R. V. Stick and S. J. Williams, Carbohydrates, Amsterdam; Elsevier, 2009
- ↑ 11.0 11.1 11.2 11.3 E. N. Jacobsen , W. Zhang , A. R. Muci, J. R. Ecker and Li Deng, J. Am. Chem. Soc., 1991, 113, 63–7064 DOI:10.1021/ja00018a068
- ↑ 12.0 12.1 12.2 12.3 12.4 C. Wiles, M. J. Hammond and Paul Watts, Beilstein Journal of Organic Chemistry, 2009, 5, 1-12 DOI:10.3762/bjoc.5.27 10.3762/bjoc.5.27
- ↑ 13.0 13.1 F. R. Jensen and R. C. Kiskis, J. Am. Chem. Soc., 1975, 97, pp 5825–5831 DOI:10.1021/ja00853a029G655
- ↑ 14.0 14.1 Dictionary of Organic Compounds, ed. J. Buckingham, Chapman and Hall, 1982, 5, 4649
- ↑ 15.0 15.1 15.2 B. Wang , X. Wu , O. A. Wong , B. Nettles , M. Zhao , D. Chen and Yian Shi,J. Org. Chem., 2009, 74, 3986–3989 DOI:10.1021/jo900330n
- ↑ 16.0 16.1 S. E. Denmark and H. Matsuhashi, J. Org. Chem., 2002, 67, 3479–3486, DOI:10.1021/jo020050h
- ↑ 17.0 17.1 17.2 Z. X. Wang , L. Shu , M. Frohn , Y. Tu and Yian Shi, Organic Syntheses, 2003, 80, 9–17
- ↑ 18.0 18.1 Z. X. Wang , Y. Tu , M. Frohn , J. R. Zhang and Yian Shi, J. Am. Chem. Soc., 1997, 119, 11224–11235 DOI:10.1021/ja972272g
- ↑ 19.0 19.1 19.2 E. M. McGarrigle and D. G. Gilheany, Chem. Rev., 2005, 105, 1563-1602DOI:10.1021/cr0306945 10.1021/cr0306945
- ↑ 20.0 20.1 20.2 B. D. Brandes and E. N. JacobsenJ. Org. Chem., 1994, 59, 4378–4380DOI:10.1021/jo00095a009 10.1021/jo00095a009
- ↑ 21.0 21.1 F. Blanco, B. Kelly, G. Sánchez-Sanz, C. Trujillo, I. Alkorta , J. Elguero & Isabel Rozas, J. Phys. Chem. B, 2013, 117, 11608–11616 DOI:10.1021/jp407339v 10.1021/jp407339v
- ↑ 22.0 22.1 US Department of Health and Human Services, 'Toxicology and Carcinogenesis Studies of Pulegone',NTP Technical Report, 2011, 1-202
- ↑ 23.0 23.1 23.2 J. Katsuhara,J. Org. Chem., 11967, 32, 797–799DOI:10.1021/jo01278a062 10.1021/jo01278a062

