Rep:Mod:12Dschubertroadmod2
Module 2
BH3
Creation and optimisation
The BH3 molecule was created, it was then manipulated so that all 3 B-H bond lengths were 1.5Å. This molecule was then submitted to Gaussian for optimisation, using the parameters set out below:
| File Type | .log |
| Calculation Type | FOPT |
| Calculation Method | RB3LYP |
| Basis Set | 3-21G |
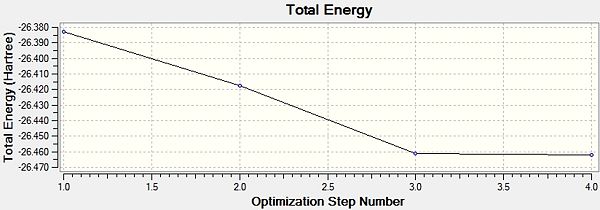
| Final Energy (au) | -26.462 |
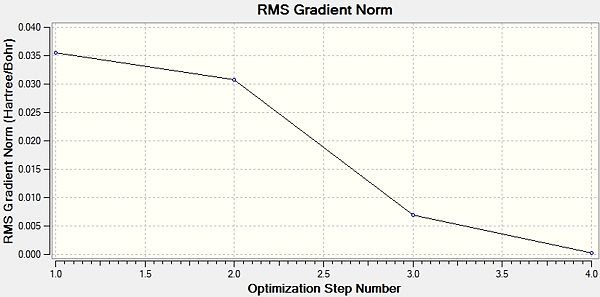
| Gradient | 0.0002 |
| Dipole Moment (Debye) | 0.00 |
| Point Group | D3H |
| Run Time | 32 seconds |
The result of this operation was a BH3 with:
- B-H bond length = 1.19Å
- H-B-H bond angle = 120.0o
The .log file can be found here.
Upon analysis of this data and the .log file we can confirm that this optimisation was correct. This is evident, first in the fact that the Gradient is less than 0.001, secondly, at the end of the .log file the convergence of the optimisation is confirmed.
Then for a further understanding we visualised the total energy and the gradient over the optimisation steps. These can be seen to the right.
We were also able to visualise the molecule for each step of the optimisation. Interestingly, Gaussian for all but the final step, shows the molecule without bonds. This helps remind us that bonds are simply structural motifs that we use for ease of understanding. In reality all they represent is a distance between two atoms where they are at the lowest energy conformation. For example in the case of a covalent bond they represent an area of high electron density between two atoms. This electron density is scerrening the electrostatic repulsion between their positively charged nuclei and lowering the energy of this conformation. In the case of an ionic bond this represents the lowest energy seperation between two charged atoms.
MO Calculation
For this we used the basis set below(note, upon further investigation this set was copmputed with a different basis set to the other calculations on BH3, this was because in the instruictions we followed the screen shots provided, however this was bad practice):
| File Type | .fch |
| Calculation Type | SP |
| Calculation Method | RB3LYP |
| Basis Set | 6-31G |
| Final Energy (au) | -26.605 |
| Gradient | 0.0000 |
| Dipole Moment (Debye) | 0.00 |
| Point Group | N/A |
| Run Time | 6 seconds |
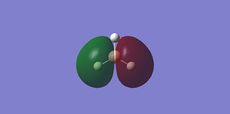
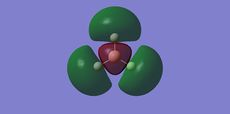
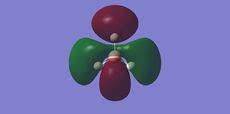
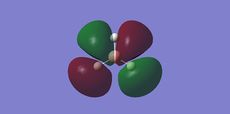
The MO's produced can be seen below:
 |
 |
 |
 |
 |
 |
 |
 |
These can be compared with the MO's formed from a basic MO Diagram:
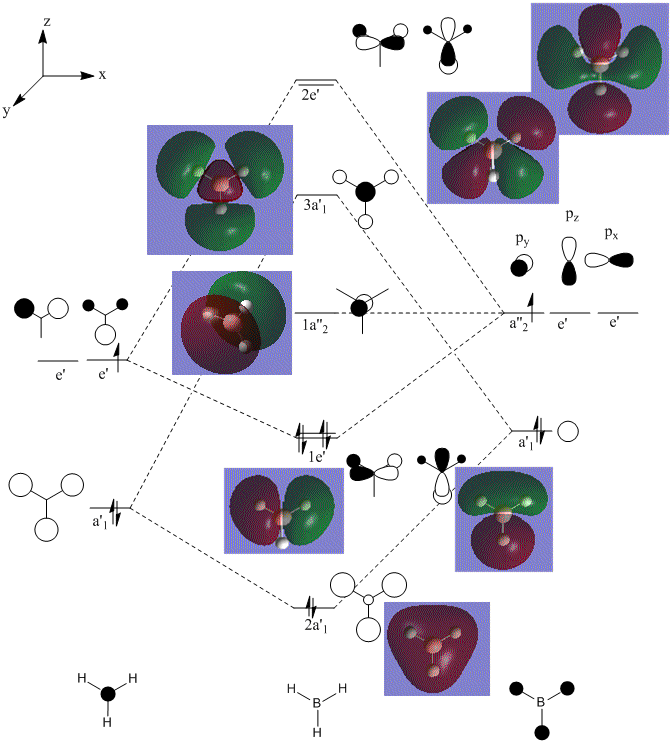
We can see from that this diagram, that in general there is a good agreement with what we expected and what was computed. However for the MO's computed for the MO's above the HOMO, the shapes appear distorted, larger and more diffuse. This can be reasoned by looking at the method used in the calculation. This DFT-based calculation is performed using point charges. For the MO's above the HOMO the distorion occurs as there are unoccupied therefore the calculation based on charges distorts.
NBO Analysis
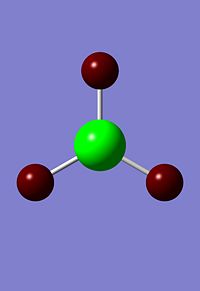
For the NBO analysis we first toggled the view to show us charge distribution by colour, this can be seen on the right. We then got the program to give us the charge by numbers, this gave us:
- B = 0.278
- H = -0.093
These calculations make sense as we think of Boron as an electropositive element with respect to Hydrogen(as shown in their relative positioning on the MO diagram).
We can also look further into the .log file (DOI:10042/to-6522 ) for the NBO's. Within this file we can find information on the nature of the bonds. For this case the information we extracted was:
- The 3 B-H bonds consist of 45.36% from the B orbital, which is 33.33%s:66.66%p; and 54.64% from the H orbital which is 100%s
From this analysis we can see that the Boron centre is forming 3 sp3 hybrid orbitals, each of which is interacting with an s-orbital on a hydrogen atom.
Vibrational Analysis
The vibrational analysis was undertaken with the following parameters:
| File Type | .log |
| Calculation Type | FREQ |
| Calculation Method | RB3LYP |
| Basis Set | 3-21G |
| Final Energy (au) | -26.462 |
| Gradient | 0.0002 |
| Dipole Moment(Debye) | 0.00 |
| Point Group | D3H |
| Run Time | 37 seconds |
Using the 3N-6 rule, we can expect that this molecule will have 6 vibrational modes, this is what was seen in the result. The results can be seen in the table below.
| Mode # | Form of Vibration | Frequency (cm-1) | Intensity | Symmetry D3h point group |
|---|---|---|---|---|
| 1 | 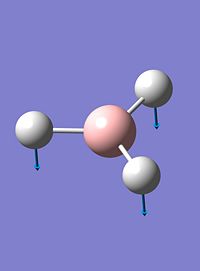 |
1144 | 93 | a2 |
| 2 |  |
1204 | 12 | e' |
| 3 | 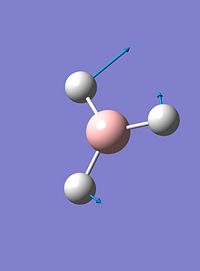 |
1204 | 12 | e' |
| 4 | 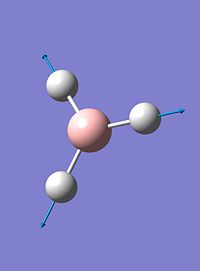 |
2598 | 0 | a'1 |
| 5 | 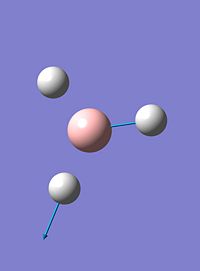 |
2737 | 104 | e' |
| 6 | 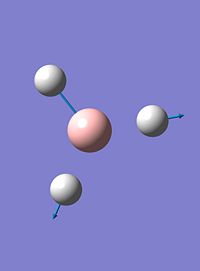 |
2737 | 104 | e' |
We can also plot the Infrared spectrum of the molecule:
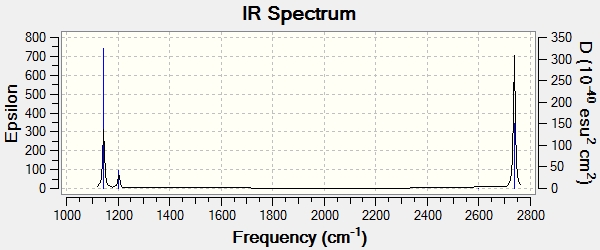
From this we can clearly see that there are only 3 peaks in this spectrum, and yet we have 6 modes of vibration. This can be explained by 2 reasons.
- Firstly there are 2 degenerate sets of vibrational modes, 2 & 3 are both degenerate, as are 5 & 6, thus each set will only appear as one peak.
- Secondly, vibrational mode 4 has an intensity of 0, this is because the vibration has no overall change in dipole moment of the molecule. This is due to the symmetry (a'1) of the vibration.
TlBr3
Optimisation
The TlBr3 molecule was created, it's symmetry was then restricted to D3h, and the very tight (0.0001) setting. This molecule was then submitted to Gaussian for optimisation, using the parameters set out below:
| File Type | .log |
| Calculation Type | FOPT |
| Calculation Method | RB3LYP |
| Basis Set | LANL2DZ |
| Final Energy (au) | -91.218 |
| Gradient | 0.0000009 |
| Dipole Moment(Debye) | 0.00 |
| Point Group | D3H |
| Run Time | 43 seconds |
The result of this operation was a TlBr3 with:
- Tl-Br bond length = 2.65Å
- Br-Tl-Br bond angle = 120.0o
The .log file can be found here.
Vibrational Analysis
The vibrational analysis was undertaken with the following parameters:
| File Type | .log |
| Calculation Type | FREQ |
| Calculation Method | RB3LYP |
| Basis Set | LANL2DZ |
| Final Energy (au) | -91.218 |
| Gradient | 0.0000009 |
| Dipole Moment (Debye) | 0.00 |
| Point Group | D3H |
| Run Time | 53 seconds |
Using the 3N-6 rule, we can expect that this molecule will have 6 vibrational modes, this is what was seen in the result. The results can be seen in the table below.
| Mode # | Form of Vibration | Frequency (cm-1) | Intensity | Symmetry D3h point group |
|---|---|---|---|---|
| 1 | 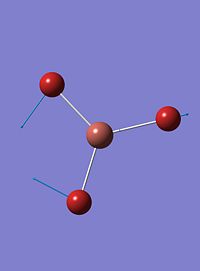 |
46 | 4 | a2 |
| 2 | 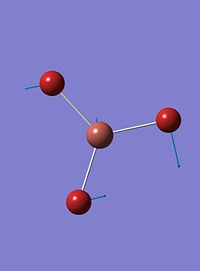 |
46 | 4 | e' |
| 3 | 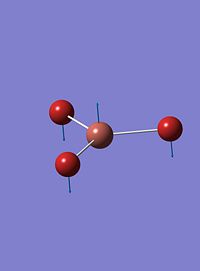 |
52 | 6 | e' |
| 4 |  |
165 | 0 | a'1 |
| 5 |  |
211 | 25 | e' |
| 6 | 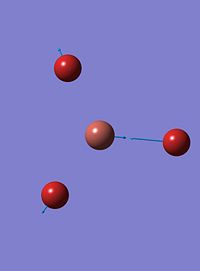 |
211 | 25 | e' |
We can also plot the Infrared spectrum of the molecule:

From this we can clearly see that there are only 3 peaks in this spectrum, and yet we have 6 modes of vibration. This can be explained by 2 reasons.
- Firstly there are 2 degenerate sets of vibrational modes, 2 & 3 are both degenerate, as are 5 & 6, thus each set will only appear as one peak.
- Secondly, vibrational mode 4 has an intensity of 0.0, this is because the vibration has no overall change in dipole moment of the molecule. This is due to the symmetry (a'1) of the vibration.
Questiions
- Frequency analysis is carried out as it helps us confirm that we have the lowest energy conformation of the molecule. This is because frequency analysis is based on the second derivative of the PES. As it is the second derivative, we can establish if the stationary point we achieved in the optimisation is a minima or a maxima. If the frequency analysis produces all posivive values then we can confirm that the stationary point we reached in out optimisation was an energy minima. If one of the frequencies was negative that would indicate our stationary point we optimised to would be a maxima, or transition state. If many of the frequencies are negative, this indicates a stationary point had not been found and the optimisation was unsuccessful.
- The low frequencies observed in frequency analysis are the motions of the centre of mass of the molecule, they are accounted for in the 3N-6 rule, in that they are the 6 vibrations removed in the statement.
Isomers of Mo(CO)4(PCl3)2
Both isomers were created and optimised with the following parameters:
| File Type | .fch |
| Calculation Type | FOPT |
| Calculation Method | RB3LYP |
| Basis Set | LANL2MB |
| Final Energy (au) | -617.522 |
| Gradient | 0.0001 |
| Dipole Moment (Debye) | 0.00 |
| Point Group | n/a |
| Run Time | 1min 29 seconds |
| File Type | .fch |
| Calculation Type | FOPT |
| Calculation Method | RB3LYP |
| Basis Set | LANL2MB |
| Final Energy (au) | -617.525 |
| Gradient | 0.000016 |
| Dipole Moment (Debye) | 8.47 |
| Point Group | N/A |
| Run Time | 5 min 47 seconds |
The geometries of these were then altered according to instruction, then run again for an optimistaion, but on a different basis set:
| File Type | .fch |
| Calculation Type | FOPT |
| Calculation Method | RB3LYP |
| Basis Set | LANL2DZ |
| Final Energy (au) | -623.576 |
| Gradient | 0.000028 |
| Dipole Moment (Debye) | 0.31 |
| Point Group | n/a |
| Run Time | 11min 49 seconds |
| File Type | .fch |
| Calculation Type | FOPT |
| Calculation Method | RB3LYP |
| Basis Set | LANL2DZ |
| Final Energy (au) | -623.577 |
| Gradient | 0.000005 |
| Dipole Moment (Debye) | 1.31 |
| Point Group | N/A |
| Run Time | 17 min 53 seconds |
Both Isomers were then run for frequency analysis, to ensure that their optimisations were to minima.
| File Type | .log |
| Calculation Type | FREQ |
| Calculation Method | RB3LYP |
| Basis Set | LANL2DZ |
| Final Energy (au) | -623.576 |
| Gradient | 0.000028 |
| Dipole Moment (Debye) | 0.31 |
| Point Group | C1 |
| Run Time | 5min 51 seconds |
All Frequencies came out positive, and thus this confirmed to us that the optimisation to a stationary point was a minima, and therfore sucsessful lowest energy optimisation.
| File Type | .log |
| Calculation Type | FREQ |
| Calculation Method | RB3LYP |
| Basis Set | LANL2DZ |
| Final Energy (au) | -623.577 |
| Gradient | 0.000005 |
| Dipole Moment (Debye) | 1.31 |
| Point Group | C1 |
| Run Time | 7 min 46 seconds |
All frequencies were also positive, thus confirming a minima had been found.
As the minima have been found we can now display the molecules:
Vibrational Analysis
Here we have displayed the IR spectra for both molecules:
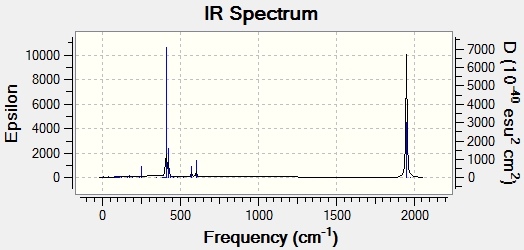
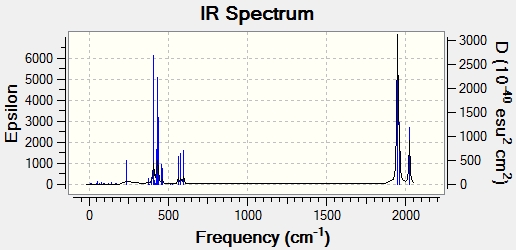
The trans- isomer had two low frequency vibrational modes. These can be seen in the table below:
| Mode # | Form of Vibration | Frequency (cm-1) | Intensity |
|---|---|---|---|
| 1 | 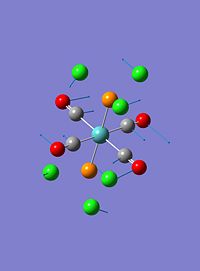 |
5 | ~0 |
| 2 | 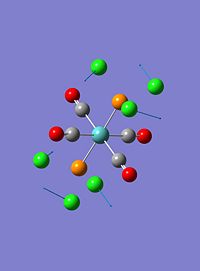 |
6 | 0 |
These vibrations are both twisting vibrations. The first involving a strong twist of all 4 CO ligands whilst the Cl's on the P ligands twist in the opposite direction with similar intensity. The second involves a much stronger twist of the PCl3 groups, and small rocking of two of the CO ligands.
The cis- isomer also had two low frequency vibrational modes. These can be seen in the table below:
| Mode # | Form of Vibration | Frequency (cm-1) | Intensity |
|---|---|---|---|
| 1 |  |
11 | ~0 |
| 2 |  |
18 | ~0 |
The first vibration in this case concerns mainly the antirotatory twisting of the PCl3 groups, with the rest of the molecule adopting a weak rocking-like motion. The second vibration is very similar except the PCl3 groups are rotating in the opposite direction to before, and the weak rocking motion of the rest of the molecule is now a weak twisting motion.
As these vibrations are occurring at low wavenumbers and therefore low energy, it is likely that at room temperature there is sufficient thermal energy to populate these vibrational states.
We have also tabulated the CO stretches:
| Frequency (cm-1) | Intensity |
|---|---|
| 1950 | 1475 |
| 1951 | 1467 |
| 1977 | 1 |
| 2031 | 4 |
Literature Trans CO stretches:
- [1] trans-Mo(CO)4(PMe3)2: 1895cm-1
We can see here that there is a reasonably good agreement (within the error margins) here with the literature. Only one stretch is reported in the literature, which is in agreement with our results. This is because 2 of the stretches are a degenerate set, and the second 2 are of negligible intensity. The degenerate set arises out of the geometry around the metal centre, with both sets of trans-pairs that are vibrating, being in equivalent environments. The negligible intensity peaks do not appear as the stretches have very little or no change in dipole moment and are therefore IR-inactive.
| Frequency (cm-1) | Intensity |
|---|---|
| 1945 | 763 |
| 1949 | 1498 |
| 1958 | 633 |
| 2023 | 598 |
Literature Cis CO stretches:
- [2]cis-Mo(CO)4(PMe3)2 : 2019cm-1, 1922cm-1, 1905cm-1, 1899cm-1.
Again there is good agreement with the literature here (within the error margins). Also in good agreement is the nmber of stretches. Both the literature and the computed compounds identify 4 stretches being visible. This can be explained by there being 2 separate environments for the CO ligands. This leads two a cis-pair of CO's stretching, a trans pair of CO's stretching (first 2 peaks). Then the two higher wave number stretches are where the cis and trans pairs are stretching together, one where they are in phase, the other when they are out of phase. Both these do involve a change in the dipole moment, mainly due to the cis- pair's vibration. This results in both vibrations being IR active.
Bond Lengths
| Complex | Mo-P bond length (Å) |
|---|---|
| Computed trans-[Mo(CO)4(PCl3)2] | 2.44 |
| lit.[3] trans-[Mo(CO)4(PPh3)2] | 2.50 |
| Computed cis-[Mo(CO)4(PCl3)2] | 2.51 |
| lit.[4]cis-[Mo(CO)4(PPh3)2] | 2.58 |
| lit.[5]cis-[Mo(CO)4(PMePh2)2] | 2.56 |
| lit.[6]cis-[Mo(CO)4(PMe2Ph)2] | 2.55 |
We can see from the literature that there are 2 evident trends which agree with my results.
- Firstly, observing the literature cis- isomers we can see that there is a trend that as the R-groups on the PR3 reduce in size, the Mo-P bond distance decreases. This is in good agreement with our result as our R-group is Cl, which is smaller than all the groups used in literature. This reduced steric bulk has led to the smaller bond length in our cis- isomer
- Secondly we can see that by comparing the two literature values for the cis- and trans- [Mo(CO)4(PPh3)3] there is a reduction in Mo-P bond length as we move from cis- to trans-. There are two factors that can rationalise this. The first is that the cis- isomer has longer bonds to minimise steric interactions between the bulky PR3 ligands. However the literature[7] states the case that if we compare Mo-P bonds in [Mo(CO)5(PPh3)] and trans-[Mo(CO)4(PPh3)2] there is still a reduction in length. This can be attributed to a structural trans-effect. This effect is evident in the shortening of a Mo-P bond when the ligand trans to it is changed and can be related to the relative trans influence of PPh3 against CO.
Energy Comparison
| Complex | Computed energy (a.u.) | Computed energy (kJmol-1) |
|---|---|---|
| Computed trans-[Mo(CO)4(PCl3)2] | -623.576 | -1637199 |
| Computed cis-[Mo(CO)4(PCl3)2] | -623.577 | -1637202 |
The energy differences between these two molecules are very small, (~2 kJmol-1). This is smaller than the error for these types of calculation (~10kJmol-1/0.004 a.u).
If we were to add much more sterically demanding R groups on the PR3 ligands, it is likely that the trans- isomer will become the lower energy of the two, this is because it will avoid the steric clashes that will be encountered in the cis- conformation.
Mini-Project
For my mini-project I decided to investigate the influence of the ligand in one of the species of the schlenk equilibrium[8] as shown below.
This species was chosen as I could investigate the relationship between the ligand lewis basicity and Mg-Cl bond lengths for the two Mg's.
Me2Mg2Cl2.THF2
At first an attempt to optimise this molecule was made with B3LYP/3-21G basis set. When limited to 50 cycles this optimisation failed. After discussion with other students and a demonstrator, a solution was achieved. This was to first optimise using B3LYP/LANL2MB, then to follow with B3LYP/3-21G. Both these steps were successful, and can be seen summarised below:
| File Type | .log |
| Calculation Type | FOPT |
| Calculation Method | RB3LYP |
| Basis Set | LANL2MB |
| Final Energy (au) | -569.770 |
| Gradient | 0.000008 |
| Dipole Moment (Debye) | 15.50 |
| Point Group | C1 |
| Run Time | 11 min 14 seconds |
| File Type | .log |
| Calculation Type | FOPT |
| Calculation Method | RB3LYP |
| Basis Set | 3-21G |
| Final Energy (au) | -1855.957 |
| Gradient | 0.000009 |
| Dipole Moment (Debye) | 11.89 |
| Point Group | C1 |
| Run Time | 18 min 03 seconds |
After the initial optimisation we followed up with a more accurate optimisation using the 6-31G(d) basis set:
| File Type | .log |
| Calculation Type | FOPT |
| Calculation Method | RB3LYP |
| Basis Set | 6-31G(d) |
| Final Energy (au) | -1865.523 |
| Gradient | 0.000004 |
| Dipole Moment (Debye) | 11.66 |
| Point Group | C1 |
| Run Time | 28 min 39 seconds |
This optimisation was then checked to be a minimum by frequency analysis (DOI:10042/to-6891 ). This had a negative frequency. This was an indication of a not fully optimised structure (as discussed earlier in this module). After discussion with a demonstrator, it was decided that we could run another optimisation, but this time instructing it to calculate the force constants once. We also used the same additional keywords used in the optimisation of the molybdenum complex earlier. Unfortunately there were queues on the Chem1 and Chem 2 Cluster in excess of 14 hours. Resulting in the structures not being able to be optimised.
Me2Mg2Cl2.(Et2O)2
This molecule was optimised using the same 3 steps as used before:
| File Type | .log |
| Calculation Type | FOPT |
| Calculation Method | RB3LYP |
| Basis Set | LANL2MB |
| Final Energy (au) | -572.144 |
| Gradient | 0.000001 |
| Dipole Moment (Debye) | 18.63 |
| Point Group | C1 |
| Run Time | 20 min 46 seconds |
| File Type | .log |
| Calculation Type | FOPT |
| Calculation Method | RB3LYP |
| Basis Set | 3-21G |
| Final Energy (au) | -1858.364 |
| Gradient | 0.000005 |
| Dipole Moment (Debye) | 13.83 |
| Point Group | C1 |
| Run Time | 37 min 51 seconds |
| File Type | .log |
| Calculation Type | FOPT |
| Calculation Method | RB3LYP |
| Basis Set | 6-31G(d) |
| Final Energy (au) | -1867.937 |
| Gradient | 0.000004 |
| Dipole Moment (Debye) | 13.4233 |
| Point Group | C1 |
| Run Time | 1 hour 12 min 30 seconds |
This optimisation was then checked to be a minimum by frequency analysis: (DOI:10042/to-6890 ). This also had some negative frequencies, and as a result was sent off for further optimisation(DOI:10042/to-6928 ). This further optimisation was successful, as it converged over all four parameters. This optimisation was sent off for frequency analysis (DOI:10042/to-6954 ) This came back with all positive frequencies and thus confirmed that the optimisation was successful.
Me2Mg2Cl2.(H2O)2
This molecule was optimised using the same 3 steps as used before:
| File Type | .log |
| Calculation Type | FOPT |
| Calculation Method | RB3LYP |
| Basis Set | LANL2MB |
| Final Energy (au) | -261.330 |
| Gradient | 0.00001 |
| Dipole Moment (Debye) | 13.36 |
| Point Group | C1 |
| Run Time | 1 min 38 seconds |
| File Type | .log |
| Calculation Type | FOPT |
| Calculation Method | RB3LYP |
| Basis Set | 3-21G |
| Final Energy (au) | -1545.543 |
| Gradient | 0.000010 |
| Dipole Moment (Debye) | 12.13 |
| Point Group | C1 |
| Run Time | 2 min 42 seconds |
| File Type | .log |
| Calculation Type | FOPT |
| Calculation Method | RB3LYP |
| Basis Set | 6-31G(d) |
| Final Energy (au) | -1553.441 |
| Gradient | 0.000016 |
| Dipole Moment (Debye) | 8.45 |
| Point Group | C1 |
| Run Time | 7 min 2 seconds |
This optimisation was then checked to be a minimum by frequency analysis(DOI:10042/to-6889 ). This also had some negative frequencies, and as a result was sent off for further optimisation. update: after an 18hr wait the file for the final optimisation has comeback, it has failed to converge ((DOI:10042/to-6903 ) Due to time constraints the decision was made to go no further with this molecule.
Analysis
analysis made on incomplete structures due to all structures being stuck on the scan (C1 and C2), pending for 12+ hours...
| Complex | Mg-C bond length (Å) | Mg-O bond length (Å) | L2Mg-Cl bond length (Å) | Me2Mg-Cl bond length (Å) | Mg-Mg Separation (Å) | Me-Mg-Me Bond angle (o) |
|---|---|---|---|---|---|---|
| Me2Mg2Cl2.THF2 | x | y | z | a | b | c |
| Me2Mg2Cl2.(Et2O)2 | 2.12 | 2.07 | 2.29 | 2.94 | 3.48 | 150.7 |
| Me2Mg2Cl2.(H2O)2 | 2.11 | 2.06 | 2.27 | 3.12 | 3.43 | 159.2 |
We can see that there are general trends as the lewis basicity of the ligand increases. As the basicity increases (THF->Et2O->H2O) there is a general trend of all of the bond lengths to increase, this is in agreement with the literature[9].
However, one of the key changes is that the ligand bound Mg-Cl bonds decrease, whereas the Methyl bound Mg-Cl bonds increase. This can be rationalised as the increase in sigma-donation onto the Mg core from the Ligands causing the sp3 hybridised orbitals on the ligand bound Mg to swell. This swelling results in better overlap between the L2Mg and the Chlorines, shortening their bond distances.
A result of this is a poorer overlap between the Me2Mg and the Chlorines resulting in their bond lengths increasing.
Not modelled here but well reported in the literature[10], is that upon increasing the donor ability of the ligands there is a certain point where the schlenk equilibrium will cease to exist and dimers will no longer be the major species. This is shown below in the scheme:

This influence of the donor ability can be seen when we do a MO analysis.
Update : This analysis could not be fully run due to time constraints, however I have managed to get one of the molecules analysed (DOI:10042/to-6939 )
Using NBO analysis, we can also extract information from the log file such that:
- For the ligand bound magnesium, Mg(3) the Mg-Cl bonds are essentially ionic in character, however if we observe the hybridisation of the magnesium in this bond it is:
3 s( 41.05%)p 1.40( 57.31%)d 0.04( 1.63%) Which shows it is closer to sp3 hybridisation than sp2 (this is also evident if we look at the geometry of the magnesium core - tetrahedral)
- For the methyl bound magnesium, Mg(4), the hybridisation of the Mg centre in the Mg-C bonds is:
4 s( 48.00%)p 1.08( 51.97%) Which shows it is essentially sp in character
From this we can see the hybridisation that has occurred, and if the time constraint allowed we could've done this same analysis on all three molecules showing how this hybridisation varies across the series, the difference I was expecting to see here is between the two Magnesium's as the lewis basicity of the donor increases. The trend is expected to be that the ligand bound magnesium becomes more sp3 in character and the methyl bound magnesium more sp in character as the lewis basicity of the ligand increases.
Also further into the NBO analysis we can see the interactions between the Oxygen and the magnesium:
                                                                         E(2)    E(j)-E(i)   F(i,j)
    Donor NBO (i)                     Acceptor NBO (j)                  kcal/mol   a.u.      a.u.

 82. LP (   2) O  13                  77. LP*(   1)Mg   3                   20.77    0.72    0.111
This tells us that there is a donor acceptor interaction, with the oxygen lone pair donating into the Magnesium. This is another interaction which across the series I was expecting to increase as lewis basicity of the ligands went up.
Conclusion
In the initial parts of this project we showed how computational chemistry can be used as a diverse and powerful tool in chemical analysis. We learned about the varying degrees of accuracy of the methods we can employ and how to use tools such as frequency analysis in the confirmation of our finding of minima. We also learned how we can employ MO based analysis to visualise orbitals and rationalise particular structures. We also saw the limitations of MO modelling in that non-occupied orbitals when computed can often be distorted in shape due to the way the calculation is operated. Using all these techniques we embarked on a Mini-Project. Unfortunately due to the difficult nature of the molecules chosen to model, time constraints and poor time management this was not completed. We did demonstrate how frequency analysis can be used as in this case it helped tell us that what we thought was a fully optimised molecule required further optimisation, which for the case of the L=Et2O molecule we successfully completed and confirmed with vibrational analysis. However analysis was completed on some of the partially optimised structures, and this was generally successful. We were also partially to use NBO analysis to rationalise the results, however this could only be done on the one fully optimised structure, and so we could not fully show the variations across the series as were expected.
References
- ↑ F. Albert. Cotton, Donald J. Darensbourg, S. Klein, Brian W. S. Kolthammer Inorg. Chem., 1982, 21 (7), pp 2661–2666 DOI:10.1021/ic00137a026
- ↑ F. Albert. Cotton, Donald J. Darensbourg, S. Klein, Brian W. S. Kolthammer Inorg. Chem., 1982, 21 (7), pp 2661–2666 DOI:10.1021/ic00137a026
- ↑ G. Hogarth, T. Norman, Inorganica Chimica Acta, 1997, 254 (1), pp167-171 DOI:10.1016/j.inoche.2004.09.012
- ↑ F. Albert. Cotton, Donald J. Darensbourg, Simonetta. Klein, Brian W. S. Kolthammer Inorg. Chem., 1982, 21 (1), pp 294–299 DOI:10.1021/ic00131a055
- ↑ F. Albert. Cotton, Donald J. Darensbourg, Simonetta. Klein, Brian W. S. Kolthammer Inorg. Chem., 1982, 21 (1), pp 294–299 DOI:10.1021/ic00131a055
- ↑ F. Albert. Cotton, Donald J. Darensbourg, Simonetta. Klein, Brian W. S. Kolthammer Inorg. Chem., 1982, 21 (1), pp 294–299 DOI:10.1021/ic00131a055
- ↑ G. Hogarth, T. Norman, Inorganica Chimica Acta, 1997, 254 (1), pp167-171 DOI:10.1016/j.inoche.2004.09.012
- ↑ W. Schlenk, W. Schlenk, Jr., Chem. Ber., 1929, 62, pp920 DOI:10.1002/cber.19290620422
- ↑ Jaana Tammiku-Taul,, Peeter Burk, and Ants Tuulmets The Journal of Physical Chemistry A 2004 108 (1), pp133-139 DOI:10.1021/jp035653r
- ↑ Richard A. Andersen, Geoffrey Wilkinson, Inorg. Synth., 1979, 19, pp262-263 DOI:10.1002/9780470132500.ch61

