Rep:Mod:10/09/1990
Bonding and molecular orbitals in main group compounds
Part 1:Optimizing simple molecules
Introduction
This project aims to investigate the structure and bonding of small molecules such as BH3, TlBr3 and NH3BH3. Gaussian will be used to optimize these molecules and find there minimum energies and optimum bond lengths.
Optimizing BH3
Using a low basis set
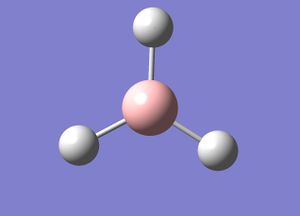
By using GaussView and setting the initial bond distances to 1.5 A, it was possible to calculate the optimum bond distances and the lowest energy of the BH3 molecule. A initial basis set of 3-21G was used. The results are shown below:
File:PC09 BH3 OPTIMISATION.LOG
| Parameters | |
|---|---|
| File type | .log |
| Method of Calculation | RB3LYP |
| Calculation type | FOPT |
| Basis Set | 3-21G |
| Final energy (au) | -26.46226338 |
| Gradient (au) | 0.00020672 |
| Dipole Moment | 0 |
| Point Group | D3H |
| Calculation time (s) | 9 |
This minimum energy optimization gave a bond distance of 1.19A and bond angles of 120o.
          Item               Value     Threshold  Converged?
 Maximum Force            0.000413     0.000450     YES
 RMS     Force            0.000271     0.000300     YES
 Maximum Displacement     0.001610     0.001800     YES
 RMS     Displacement     0.001054     0.001200     YES
 Predicted change in Energy=-1.071764D-06
 Optimization completed.
    -- Stationary point found.
Using a higher basis set
By changing the base set to 6-31G (d,p), it is possible to improve the accuracy of the calculation. This basis set includes p and d orbitals. The results are shown below:
| Parameters | |
|---|---|
| File type | .log |
| Method of Calculation | RB3LYP |
| Calculation type | FOPT |
| Basis Set | 6-31G |
| Final energy (au) | -26.6153263 |
| Gradient (au) | 0.00000235 |
| Dipole Moment | 0 |
| Point Group | D3H |
| Calculation time (s) | 10 |
    Item               Value     Threshold  Converged?
 Maximum Force            0.000005     0.000450     YES
 RMS     Force            0.000003     0.000300     YES
 Maximum Displacement     0.000019     0.001800     YES
 RMS     Displacement     0.000012     0.001200     YES
 Predicted change in Energy=-1.304899D-10
 Optimization completed.
    -- Stationary point found.
File:PC09 BH3 631G OPTIMISATION.LOG
TlBr3 optimization
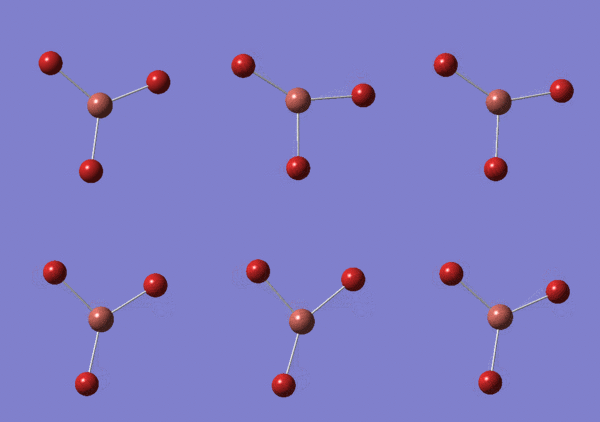
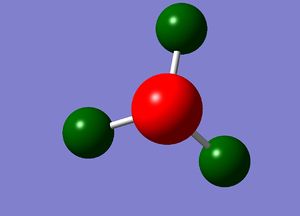
Using a similar method as previously, it is possible to estimate the optimal energy and bond distances of TiBr3 molecule. During this method it was necessary to restrict the geometry of the molecule to D3h and increase the tolerance to a high value in order to prevent problems with vibrations. This calculation was carried out using the HPC and the result was published on D-space and shown below.
Gaussian found that the optimum bond distance was 2.651A and the bond angle as 120 degrees. This value is reasonably similar to the literature value of 2.51A[1] .
     Item               Value     Threshold  Converged?
 Maximum Force            0.000002     0.000450     YES
 RMS     Force            0.000001     0.000300     YES
 Maximum Displacement     0.000022     0.001800     YES
 RMS     Displacement     0.000014     0.001200     YES
 Predicted change in Energy=-6.084107D-11
 Optimization completed.
    -- Stationary point found.
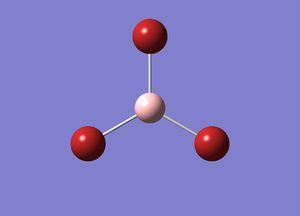
BBr3 optimization
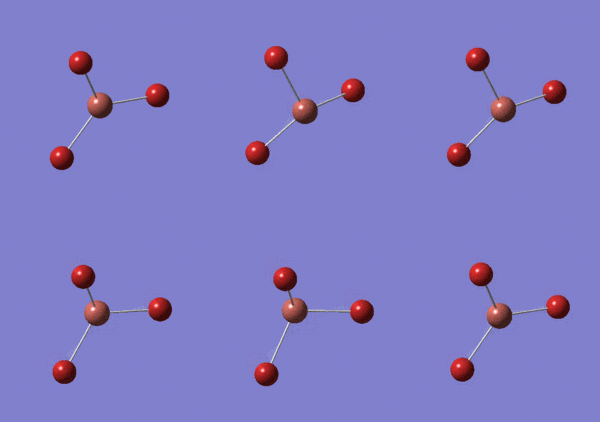
In order to optimize BBr3 I used the higher basis set BH3 calculation. The hydrogen atoms were exchanged for bromine atoms and the method was changed so that the boron atom was set to a normal basis set and the bromine atoms were set to a psuedo-potential basis set. This calculation was again run on the HPC and the results are shown below.
This calculation gave an optimum bond length of 1.93A and an optimum bond angle of 1200.
  Item               Value     Threshold  Converged?
 Maximum Force            0.000008     0.000450     YES
 RMS     Force            0.000005     0.000300     YES
 Maximum Displacement     0.000036     0.001800     YES
 RMS     Displacement     0.000023     0.001200     YES
 Predicted change in Energy=-4.027279D-10
 Optimization completed.
    -- Stationary point found.
Comparison of bond lengths
| Bond type | Bond length (A) |
| B-H | 1.19 |
| Tl-Br | 2.51 |
| B-Br | 1.93 |
The difference in the bond lengths in the three molecules can be attributed to the size of the ligands and/or to the size of the central atom.
If you compare the Tl-Br bond and the B-Br bond you can see that the Tl-Br bond is a lot longer. This is due to the size difference between the boron and thallium atoms. Both atoms are in group 13 so are likely to bond in a similar way to bromine. However, the atomic mass and radii is a lot larger for thallium then boron meaning that the frontier orbitals of thallium are larger and more diffuse and therefore have a poorer overlap with bromine then boron does. This means the bonds will be weaker and hence longer.
A similar comparison can be made when comparing the bond length of B-H and B-Br. Both bromine and hydrogen are x-type ligands but boron and hydrogen are more similar in size, there is therefore better orbital overlap and hence stronger, shorter bonds.
A chemical bond in an interaction between two atoms which results in a larger body being formed. A covalent bond involves the sharing of atoms between two nuclei, whereas an ionic bond is the electrostatic interaction between two oppositely charged ions. Sometimes in GaussView chemical bonds are not shown when they would be expected. This is because Gaussview normally deals with organic molecules which generally have bond lengths of around 1.5A. If the bond length is much larger then this then GaussView will not show a bond, even though an interaction will still exist.
Frequency analysis
BH3
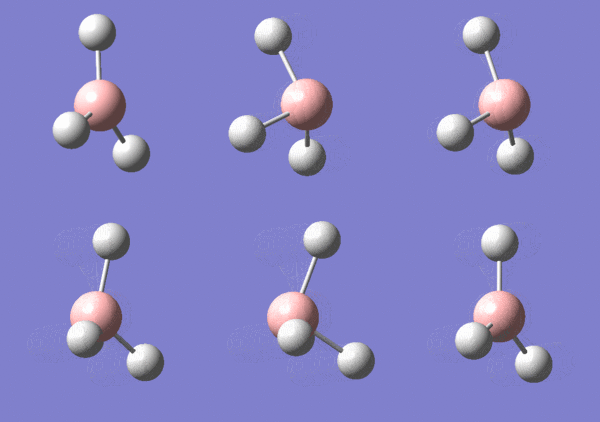
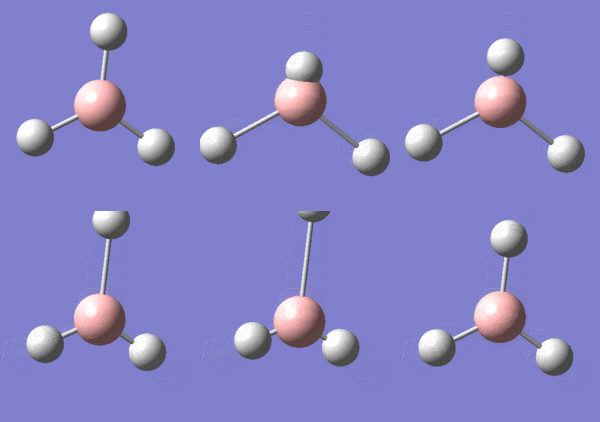
The frequency calculations were carried out on the 6-31G(d,p) optimised BH3 molecule. For these calculations the job type was changed to frequency. The frequencies below are from the Gaussian output file. The calculation was proven to be correct as the low frequencies are in the range of +/- 15cm-1, the other frequencies are all positive and the energy is the same as in the 6-31G(d,p)calculation.
Low frequencies ---   -0.9034   -0.7346   -0.0054    6.7355   12.2480   12.2812
Low frequencies --- 1163.0003 1213.1853 1213.1880

Item               Value     Threshold  Converged?
 Maximum Force            0.000005     0.000450     YES
 RMS     Force            0.000002     0.000300     YES
 Maximum Displacement     0.000019     0.001800     YES
 RMS     Displacement     0.000009     0.001200     YES
 Predicted change in Energy=-1.324717D-10
 Optimization completed.
    -- Stationary point found.
File:PETERCROSBIE BH3 FREQ 2.LOG
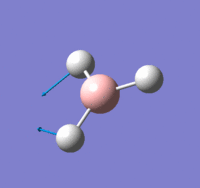
The predicted IR shows 3 expected peaks even though there is six types of vibrations shown in the table above. This is because two of the vibrations are degenerate, at 1213.19cm-1 and 2715.43cm-1. This would leave 4 expected peaks but the vibration at 2582.26cm-1 is completely symmetrical, meaning that there is no change in dipole moment and hence no peak is observed.
TiBr3
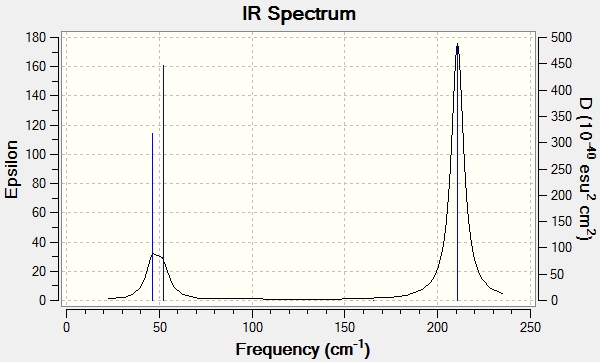
The same analysis was used in order to predict the vibrations of the TlBr3 molecule. The previous output Gaussian file was used and the symmetry was restricted to d3h.
Low frequencies ---   -3.4213   -0.0026   -0.0004    0.0015    3.9362    3.9362
 Low frequencies ---   46.4289   46.4292   52.1449
The predicted IR spectrum again only shows three peaks as appose to six. This is due to the same reasons as stated for the BH3 molecule (two are degenerate and one has no change in dipole).
Comparison of TlBr3 and BH3
Below is a comparison of the results from the vibrational analysis of BH3 and TlBr3.
| TlBr3 frequency / cm-1 | BH3 frequency / cm-1 |
|---|---|
| 46.43 | 1152.77 |
| 46.43 | 1209.64 |
| 52.14 | 1209.64 |
| 165.27 | 2576.40 |
| 210.69 | 2714.68 |
| 210.69 | 2714.68 |
You can see from these values that the frequencies for the Tl-Br bonds are lower then for the B-H bonds. This implies that the B-H bonds are stronger and this is because the reduced mass is larger in the case of Tl-Br meaning the frequency will be lower. The two molecules have the same number of vibrational modes but symmetry labels are in a different order. This is expected as the two molecules are isostructual.
In order to compare the two molecules it is necessary to use the same basis set and method. Carrying out a frequency analysis allows us to confirm that we have found out the minimum structure of the potential energy surface. The low frequency values relate to the movement of the center of mass of the molecule. These values relate to the -6 in 3N-6 rule.
Population analysis
A further calculation was undertaken using the previously optimised BH3 molecule. The population analysis calculation allows us to look at MOs of the molecule and the charge distribution. The details of this calculation are shown below:
File Name = PC09 BH3 NBO
File Type = .log
Calculation Type = SP
Calculation Method = RB3LYP
Basis Set = 6-31G(d,p)
Charge = 0
Spin = Singlet
E(RB3LYP) = -26.61532363 a.u.
RMS Gradient Norm =  a.u.
Imaginary Freq =
Dipole Moment = 0.0000 Debye
Point Group = D3H
Job cpu time:  0 days  0 hours  0 minutes  5.0 seconds.
BH3 population analysis D-space
The molecular orbital diagram shown below can be formed from the linear combination of atomic orbitals. The real molecular orbitals calculated from the population analysis are also shown on the diagram.
The diagram shows that the real MO's are in fact the same as the linear combination of atomic orbitals MO's which shows that qualitative MO theory is accurate for small molecules such as BH3.
NBO analysis
Further practice of molecule optimization was carried out with a NH3 molecule. The basis set was set as (6-31G d,p). As this molecule is small it is possible to go straight to the higher basis set. The results are shown below:
File Name = NH3 optimisation
File Type = .log
Calculation Type = FOPT
Calculation Method = RB3LYP
Basis Set = 6-31G(d,p)
Charge = 0
Spin = Singlet
E(RB3LYP) = -56.55776856 a.u.
RMS Gradient Norm = 0.00000885 a.u.
Imaginary Freq =
Dipole Moment = 1.8464 Debye
Point Group = C1
Job cpu time:  0 days  0 hours  0 minutes 14.0 seconds.
A frequency analysis was then carried out in order to check that a minimum was found.
 Item               Value     Threshold  Converged?
 Maximum Force            0.000022     0.000450     YES
 RMS     Force            0.000009     0.000300     YES
 Maximum Displacement     0.000078     0.001800     YES
 RMS     Displacement     0.000039     0.001200     YES

Low frequencies ---  -30.6847   -0.0018   -0.0013    0.0013   20.2705   28.3113
Low frequencies --- 1089.5554 1694.1245 1694.1864
File:NH3 FREQUENCY ANALYSIS.LOG
A population analysis was also carried out.
File Name = NH3 POPULATION ANALYSIS
File Type = .log
Calculation Type = SP
Calculation Method = RB3LYP
Basis Set = 6-31G(d,p)
Charge = 0
Spin = Singlet
E(RB3LYP) = -56.55776856 a.u.
RMS Gradient Norm =  a.u.
Imaginary Freq =
Dipole Moment = 1.8464 Debye
Point Group = C1
Job cpu time:  0 days  0 hours  0 minutes  4.0 seconds.
File:NH3 POPULATION ANALYSIS.LOG
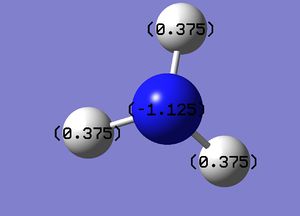
Below is the NBO analysis of NH3
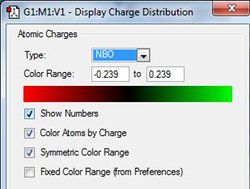
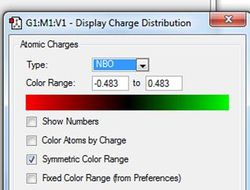
The different colours show different charges on the atoms. As expected the nitrogen atoms have a negative charge and the hydrogen atoms have a positive charge due to there difference in electronegativity. Below is an image of the scale used to determine these charges.
The values of these charges is shown below:
Charge on nitrogen atom: -1.125
Charge on each hydrogen atom: 0.375
NH3BH3 analysis
The molecule NH3BH3 can be analysed but a less accurate basis set must be carried out first as it is a more complex molecule.
File Name = NH3BH3 3-21g
File Type = .log
Calculation Type = FOPT
Calculation Method = RB3LYP
Basis Set = 3-21G
Charge = 0
Spin = Singlet
E(RB3LYP) = -82.76661688 a.u.
RMS Gradient Norm = 0.00001481 a.u.
Imaginary Freq =
Dipole Moment = 5.8438 Debye
Point Group = C1
Job cpu time:  0 days  0 hours  0 minutes 37.0 seconds.

      Item               Value     Threshold  Converged?
 Maximum Force            0.000059     0.000450     YES
 RMS     Force            0.000018     0.000300     YES
 Maximum Displacement     0.001505     0.001800     YES
 RMS     Displacement     0.000660     0.001200     YES
 Predicted change in Energy=-4.236577D-08
 Optimization completed.
    -- Stationary point found.
The optimization was then carried out at a higher basis set in order to get a more accurate result.
File Name = NH3BH3 6-21g
File Type = .log
Calculation Type = FOPT
Calculation Method = RB3LYP
Basis Set = 6-31G(d,p)
Charge = 0
Spin = Singlet
E(RB3LYP) = -83.22468997 a.u.
RMS Gradient Norm = 0.00005129 a.u.
Imaginary Freq =
Dipole Moment = 5.5628 Debye
Point Group = C1
Job cpu time:  0 days  0 hours  0 minutes 48.0 seconds.

Item               Value     Threshold  Converged?
 Maximum Force            0.000124     0.000450     YES
 RMS     Force            0.000036     0.000300     YES
 Maximum Displacement     0.000906     0.001800     YES
 RMS     Displacement     0.000442     0.001200     YES
 Predicted change in Energy=-9.668516D-08
 Optimization completed.
    -- Stationary point found.
A frequency calculation was then carried out in order to check that a minimum was formed.
 Item               Value     Threshold  Converged?
 Maximum Force            0.000230     0.000450     YES
 RMS     Force            0.000052     0.000300     YES
 Maximum Displacement     0.001347     0.001800     YES
 RMS     Displacement     0.000586     0.001200     YES
 Predicted change in Energy=-1.917444D-07
 Optimization completed.

Low frequencies ---   -0.0012   -0.0010   -0.0005   10.5964   11.6365   19.7712
Low frequencies ---  263.3254  631.4441  637.9735
Calculating the dissociation energy
It is possible to calculate the dissociation energy by subtracting the sum of the minimum energies of the BH3 and NH3 molecules from the minimum energy of the NH3BH3.
E=-83.22468997-(-56.55776856+-26.6153263)
=-0.05159511 au
This can be converted into kJ/mol:
= -135.46 kJ/mol
This result seems accurate as it is in the same order of magnitude as one would expect in a chemical bond.
Part 2: Researching aromaticity
Introduction
In this project I will be investigating the aromatic properties of four isoelctronic molecules. These molecules are benzene, boratabenzene, pyridinium and borazine.
Benzene
A molecule of benzene was optimized, initially with a 3-21G basis set and a higher 6-31G (d,p) basis set. This calculation was carried out using the HPC server. It was neccesary to use the symmetrise function in order to make sure the point group was D6h.
File Name = benzenze 6-21g
File Type = .log
Calculation Type = FOPT
Calculation Method = RB3LYP
Basis Set = 6-31G(d,p)
Charge = 0
Spin = Singlet
E(RB3LYP) = -232.25819628 a.u.
RMS Gradient Norm = 0.00004042 a.u.
Imaginary Freq =
Dipole Moment = 0.0000 Debye
Point Group = C1
Job cpu time:  0 days  0 hours  1 minutes 17.3 seconds.

      Item               Value     Threshold  Converged?
 Maximum Force            0.000090     0.000450     YES
 RMS     Force            0.000024     0.000300     YES
 Maximum Displacement     0.000337     0.001800     YES
 RMS     Displacement     0.000103     0.001200     YES
 Predicted change in Energy=-4.743663D-08
 Optimization completed.
    -- Stationary point found.
A frequency calculation was then carried out on the higher basis set optimization (6-31G d,p) in order to make sure the molecule was optimized. The C-C bond length was calculated as 1.396A.
Item               Value     Threshold  Converged?
 Maximum Force            0.000134     0.000450     YES
 RMS     Force            0.000040     0.000300     YES
 Maximum Displacement     0.000429     0.001800     YES
 RMS     Displacement     0.000159     0.001200     YES
 Predicted change in Energy=-5.745568D-08
 Optimization completed.
    -- Stationary point found.

 Low frequencies ---  -17.0045  -16.7791   -4.1580   -0.0008   -0.0007    0.0003
 Low frequencies ---  414.2782  414.5436  620.8181
Boratabenzene
Boratabenzene was also analysed in the same way as benzene. Two optimizations were carried out, initially using a 3-21G basis set and then a higher 6-31G (d,p) basis set.
File Name = boratabenzene 6-31g
File Type = .log
Calculation Type = FOPT
Calculation Method = RB3LYP
Basis Set = 6-31G(d,p)
Charge = -1
Spin = Singlet
E(RB3LYP) = -219.02052984 a.u.
RMS Gradient Norm = 0.00015822 a.u.
Imaginary Freq =
Dipole Moment = 2.8465 Debye
Point Group = C1
Job cpu time:  0 days  0 hours  3 minutes 40.0 seconds.

Item               Value     Threshold  Converged?
 Maximum Force            0.000159     0.000450     YES
 RMS     Force            0.000069     0.000300     YES
 Maximum Displacement     0.000911     0.001800     YES
 RMS     Displacement     0.000335     0.001200     YES
 Predicted change in Energy=-6.630178D-07
 Optimization completed.
    -- Stationary point found.
Boratabenzene 6-31G (d,p) calculation
This calculation gave the corresponding bond lengths:
C=C 1.40A
C-B 1.51A
A frequency calculation was then carried out in order to ensure a minimum was reached.
Low frequencies ---  -13.1243   -0.0011   -0.0006    0.0006   15.0607   18.1733
Low frequencies ---  371.3450  404.2340  565.2523

    Item               Value     Threshold  Converged?
 Maximum Force            0.000435     0.000450     YES
 RMS     Force            0.000158     0.000300     YES
 Maximum Displacement     0.000889     0.001800     YES
 RMS     Displacement     0.000399     0.001200     YES
 Predicted change in Energy=-7.220735D-07
 Optimization completed.
    -- Stationary point found.
Boratabenzene frequency calculation
Pyridinium
The molecule pyridinium was also investigated in the same way as benzene and boratabenzene. Initially the two optimizations were carried out as stated before.
File Name = pyridinium 6-31g
File Type = .log
Calculation Type = FOPT
Calculation Method = RB3LYP
Basis Set = 6-31G(d,p)
Charge = 1
Spin = Singlet
E(RB3LYP) = -248.66807388 a.u.
RMS Gradient Norm = 0.00004925 a.u.
Imaginary Freq =
Dipole Moment = 1.8721 Debye
Point Group = C1
Job cpu time:  0 days  0 hours  3 minutes  4.9 seconds

Item               Value     Threshold  Converged?
 Maximum Force            0.000102     0.000450     YES
 RMS     Force            0.000032     0.000300     YES
 Maximum Displacement     0.000835     0.001800     YES
 RMS     Displacement     0.000253     0.001200     YES
 Predicted change in Energy=-1.441668D-07
 Optimization completed.
    -- Stationary point found.
The bond length were calculated as:
N-C(α) : 1.35A
(α)C –C(β) : 1.38A
(β)C –C(γ): 1.40A
A frequency calculation was then carried out in order to ensure a minimum was formed.
Low frequencies ---   -6.6380   -0.0010   -0.0007   -0.0007   17.2487   18.1511
Low frequencies ---  392.4865  404.0337  620.5133

Item               Value     Threshold  Converged?
 Maximum Force            0.000158     0.000450     YES
 RMS     Force            0.000049     0.000300     YES
 Maximum Displacement     0.000939     0.001800     YES
 RMS     Displacement     0.000337     0.001200     YES
 Predicted change in Energy=-1.508441D-07
 Optimization completed.
    -- Stationary point found.
Pyridinium frequency calculation
Borazine
The molecule borazine was also investigated using the same method as previously.
File Name = borazine 2nd opt
File Type = .log
Calculation Type = FOPT
Calculation Method = RB3LYP
Basis Set = 6-31G(d,p)
Charge = 0
Spin = Singlet
E(RB3LYP) = -242.68458595 a.u.
RMS Gradient Norm = 0.00011870 a.u.
Imaginary Freq =
Dipole Moment = 0.0002 Debye
Point Group = C1
Job cpu time:  0 days  0 hours  2 minutes 14.9 seconds.

Item               Value     Threshold  Converged?
 Maximum Force            0.000152     0.000450     YES
 RMS     Force            0.000053     0.000300     YES
 Maximum Displacement     0.000614     0.001800     YES
 RMS     Displacement     0.000237     0.001200     YES
 Predicted change in Energy=-4.500798D-07
 Optimization completed.
    -- Stationary point found.
Borazine 6-31g (d,p) calculation
The B-N bond distance was calculated as 1.43A.
A frequency calculation was then carried out in order to ensure a minimum was formed.
Low frequencies ---  -18.0704  -11.4369   -9.7624   -0.0012   -0.0005   -0.0004
Low frequencies ---  288.9848  289.6791  404.6485

Item               Value     Threshold  Converged?
 Maximum Force            0.000295     0.000450     YES
 RMS     Force            0.000119     0.000300     YES
 Maximum Displacement     0.000653     0.001800     YES
 RMS     Displacement     0.000300     0.001200     YES
 Predicted change in Energy=-4.521252D-07
 Optimization completed.
    -- Stationary point found.
NBO analysis
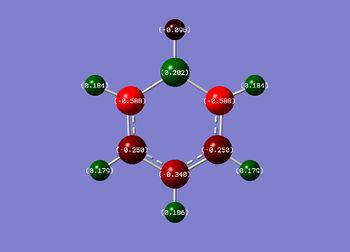
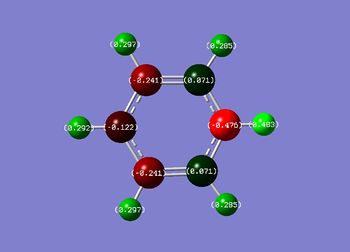
The NBO analysis shows the charge distribution in the four different molecules.
| Benzene | Boratabenzene | Pyridinium | Borazine |
|---|---|---|---|
 |
 |
 |
 |
| https://spectradspace.lib.imperial.ac.uk:8443/dspace/handle/10042/22657 | https://spectradspace.lib.imperial.ac.uk:8443/dspace/handle/10042/22659 | https://spectradspace.lib.imperial.ac.uk:8443/dspace/handle/10042/22658 | https://spectradspace.lib.imperial.ac.uk:8443/dspace/handle/10042/22656 |
| Net charge: 0 | Net charge: -1 | Net charge: +1 | Net charge: 0 |
 |
 |
 |
 |
| In the benzene molecule all the hydorgen atoms have the same positive charge (0.239, shown in green) and all the carbon atoms have the same negative charge (-0.239, shown in red). This is due to the difference in electronegativity between the two atoms and the D6h symmetry of the molecule. | Boratabenzene is isoelctronic with benzene but shows a very different distribution of charges. This is due to the electropositivity of the boron atom. Due to this, the hydrogen atom attached to the boron atom has a negative build up of charge on it and the carbon atoms which are ortho to the boron atom have a higher build up of negative charge then the para and meta ones do. | In the pyridinium molecule a similar but opposite effect can be seen to that of Boratabenzene. This is due the nitrogen atom in the heteroaromatic ring being more electronegative then the carbon atoms. This causes the hydrogen atom attached to the nitrogen atom to have a higher positive charge then the other hydrogen atoms. It also causes the carbon atoms adjacent to the nitrogen to have a higher positive charge then the para and meta carbon atoms. | The borazine molecule has a symmetrical distribution of charges alternating between positive on the boron atoms and negative on the nitrogen atoms. As expected, the hydrogen atoms attached to the electropositive boron atoms have a slight negative charge and the hydrogen atoms attached to the electronegative nitrogen atoms have a positive charge. |
Molecular orbital diagram of benzene
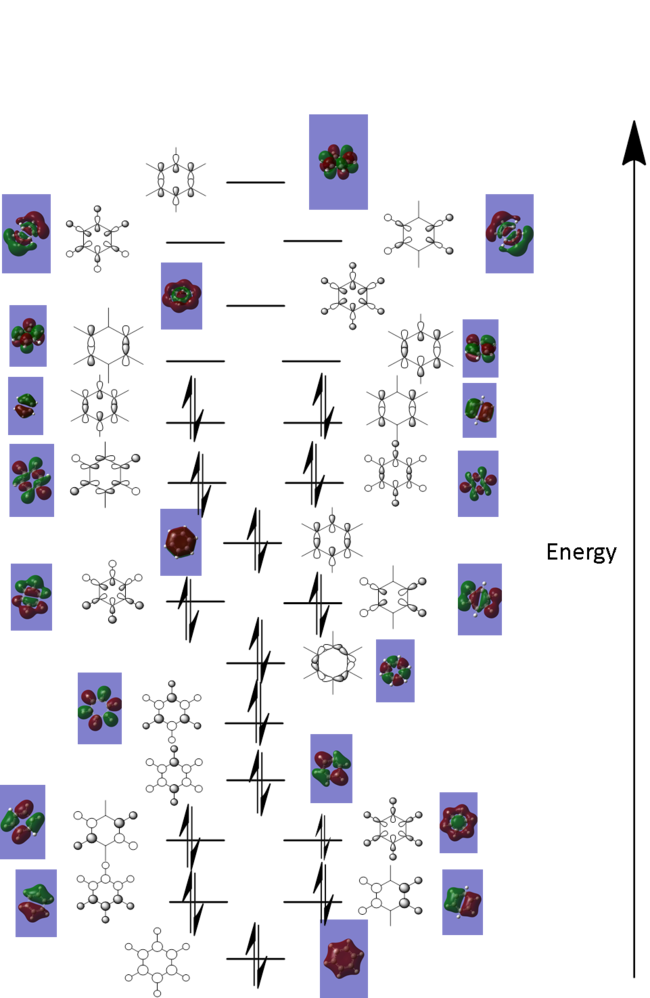
Below is a MO diagram of benzene. This was created by looking at the MOs from the NBO analysis completed previously. It was possible to predict how the linear combination of atomic orbitals diagram would look by viewing the images of the MOs computed by Gaussian.
The concept of aromaticity comes from the inherent stability of conjugated cyclic systems. Huckel theory states that if a molecule has 4n+2 pi elctrons (where n= positive integer) then it is aromatic. However, it does not help explain the degree of aromaticity which is why there is debate about the aromaticity of molecules such as Borazine.
Comparison of MO's
Visual comparison
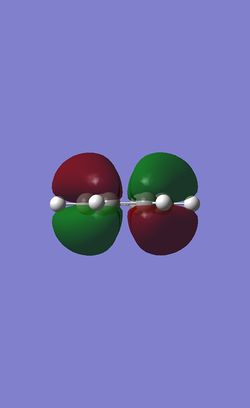
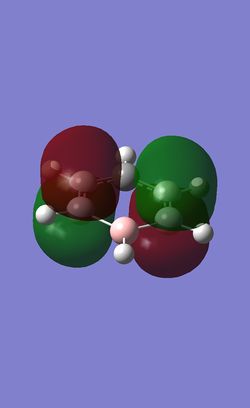
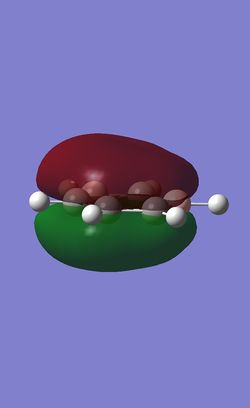
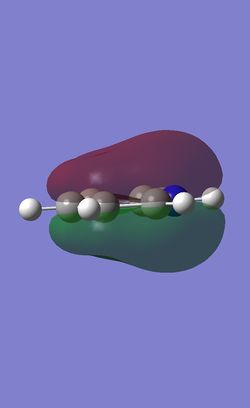
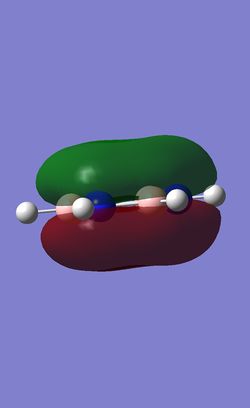
The table below shows the three highest energy occupied pi bonding MOs for each of the four molecules investigated. The energy of the MOs decreases as you move down the table. In the case of benzene and borazine the first two MOs are degenerate and hence they have two HOMOs. Whereas Boratabenzene and pyridinium only have one HOMO.
| Benzene | Boratabenzene | Pyridinium | Borazine |
|---|---|---|---|
 |
 |
 |
 |
 |
 |
 |
 |
 |
 |
 |
 |
Comparison of lowest energy pi orbitals (π1)
As the diagrams above show, all four molecules have a delocalised cloud of electrons above and below them. The MOs of borazine and benzene look very similar. This is because in benzene there are six identical C-H units so the delocalisation of electrons is completely symmetrical. In borazine there are alternating B-H and N-H units. As boron and nitrogen have large differences in electronegativies you might expect a higher electron density to be over the nitrogen atom and a lower electron density over the boron atom. However, as they are perfectly alternating the electron cloud is 'averaged' out making symmetrical clouds.
Due to the elctropositive nature of the boron atom in boratabenzene, the electron cloud is thinner over the Boron atom then it is over the carbon atoms. This means that the pi clouds are not symmetrical. The precise opposite effect can be seen in pyridinium. The electron cloud is denser over the nitrogen atom as nitrogen is more electronegative then carbon.
Comparison of HOMOs
The table below summarizes the energies of the pi orbitals investigated.
| Molecular orbital | Benzene | Boratabenzene | Pyridinium | Borazine |
|---|---|---|---|---|
| Π(3) | -0.25 | 0.01 | -0.48 | -0.28 |
| Π(2) | -0.25 | -0.03 | -0.51 | -0.28 |
| Π(1) | -0.36 | -0.13 | -0.64 | -0.36 |
As the table shows, in benzene and borazine the Π(2) and Π(3) orbitals (the HOMOs) are degenerate. The two molecular orbitals for each molecules have one nodal plan and as the molecules are so symmetrical the two orbitals are degenerate and hence borazine and benzene have two HOMOs.
Both boratabenzene and pyridinium do not have Π(2) and Π(3) orbitals with the same energy. This is because molecules do not have symmetrical orbitals due to boron and nitrogen having different electronegativities to carbon. This causes the two highest occupied pi orbitals to have different energies and hence only have one HOMO.
Comparison of energy
The table above shows the difference in energies of the three highest occupied molecular orbitals of the four molecules investigated. You can see that the molecular orbitals of pyridinium have the lowest relative energy. This is because it contains an elctronegative nitrogen atom which has a lower lying pz orbital which can therefor donate a larger electron density into the ring and hence give a lower, more stable molecular orbital energy. The opposite effect can be applied to boratabenzene as it has the highest relative energy molecular orbitals. Borazine and benzene both have very similar, relative energies and this is expected as they are both highly symmetrical molecules.
Comparison of degeneracy
The benzene molecule is likely to have the highest number of degenerate orbitals as it is the most symmetric of the four molecules. You would expect borazine to have less degenerate orbitals, this is because even though it is a highly symmetrical, it still has alternating nitrogen and boron atoms which means MOs with the same energy are unlikely. Boratabenzene and pyridinium are likely to have few degenerate molecular orbitals and they are fairly unsymmetrical. If you were create a MO diagram for pyridinium or boratabenzene using the LCAO method you would expect them too look fairly different to that of benzene. This due to the differences in size and electronegativity of the boron and nitrogen atoms to that of carbon. This would effect not just the pi orbitals but the sigma orbitals as well.
Conclusion
From these calculation it is possible to compare the aromaticity of the four molecules. Aromaticity can be measured by the extent of the delocalization of electron density. Benzene is clearly the most aromatic as it is a highly symmetrical molecule containing only carbon atoms so the charge is completely delocalized across the six carbon atoms. Borazine is the 'least' aromatic as the charge and hence the electron density is localized on the nitrogen atoms and away from the boron atoms. Comparing boratabenzene and pyridinium is more difficult as the extent of aromaticity lies somewhere in between the two extremes. However, adding a boron atom to the ring seems to change the charge distribution more then adding a nitrogen atoms. This implies that the charge is more localized in boratabenzene then in pyridinimium and hence that the extent of aromaticity is larger in pyridinium.
References
- ↑ J. Glaser and G. Johansson, Acta Chemica Scandinavica 1982, 36a, 125-135


