Rep:Mod:0509rcba
Module 3 - Rachael Bartholomew
The Cope Rearrangement of 1,5-Hexadiene
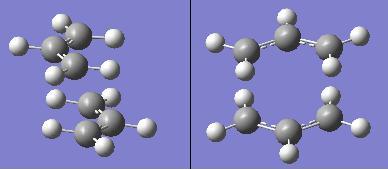
In this section, the Cope rearrangement reaction will be investigated by studying the transition states of the reaction. The [3,3]-sigmatropic shift rearrangment occurs via either a chair or a boat transition state. This is shown in the reaction scheme below.
Creating and Optimising 1,5-hexadiene
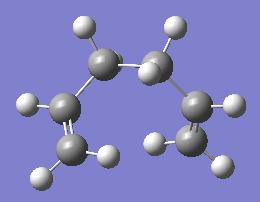
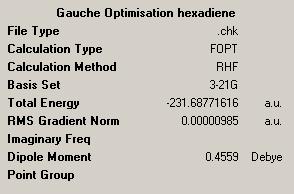
Using Gaussview, 1,5-hexadiene was drawn with an anti-arrangement of 4 mid-chain carbon atoms. The structure was tidied using the 'clean' function. The molecule was optimised by using a Hartree-Fock method, with a 3-21G basis set. In addition to this anti structure, a molecule of 1,5-hexadiene was drawn with a gauche arrangement of the 4 mid-chain carbon atoms. This was optimised using the same method, HF/3-21G. The names 'anti 2' and 'gauche 1' correspond to structures in Appendix 1.
| Anti (Anti 2) | Gauche (Gauche 1) | |
|---|---|---|
| Structure | 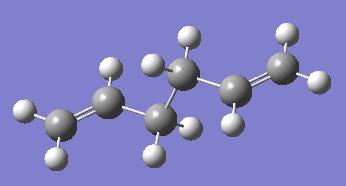 |
|
| Rotatable Structure |
|
|
| Energy (a.u.) | -231.692535 | -231.687716 |
| Point Group | Ci | C2 |
| Log File | http://neon-tmp.cc.ic.ac.uk/wiki/images/b/b0/Rachael_anti2_logfile_opt1.LOG | http://neon-tmp.cc.ic.ac.uk/wiki/images/a/a0/RACHAEL_GAUCHE_OPT1.LOG |
| Results sumary |  |
|
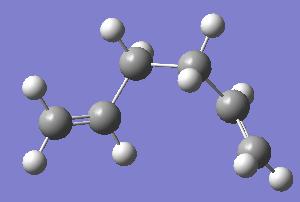
Following these optimisations, two more anti and gauche structures were drawn and optimised to try and achieve the lowest energy structures for the 1,5-hexadiene molecule. The results are shown below.
| Anti (Anti 4) | Gauche (Gauche 3) | |
|---|---|---|
| Structure | 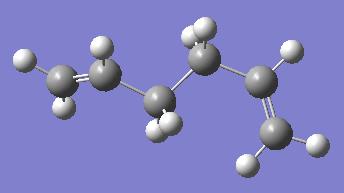 |
|
| Rotatable Structure |
|
|
| Energy (a.u.) | -231.690971 | -231.692661 |
| Point Group | C1 | C1 |
| Log File | http://neon-tmp.cc.ic.ac.uk/wiki/images/3/3c/RACHAEL_ANTI_HEXADIENE_OPT2.LOG | http://neon-tmp.cc.ic.ac.uk/wiki/images/c/c8/RACHAEL_HEXADIENE_GAUCHE_OPT2.LOG |
| Results sumary | 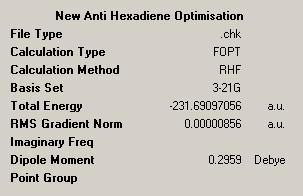 |
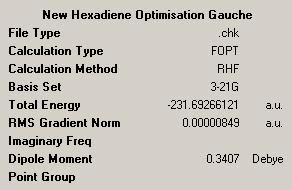
|
By looking at both results tables it can be seen that the Anti 2 and Gauche 3 structures have the lowest energy conformations of the two types of conformer.
In comparison to the energies listed in Appendix 1, these optimised structures have the same energies correct to 5 decimal places, as the example conformers.
Re-optimising Anti 2 Conformer of 1,5-Hexadiene
The anti 2 conformer previously identified was re-optimised using a DFT/B3LYP method and a 6-31g(d) basis set.
| Method | HF/3-21g | DFT-B3LYP/ 6-31g(d) |
| Diagram |  |
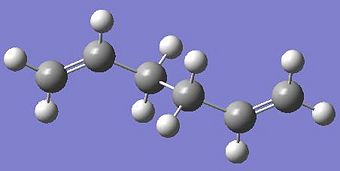
|
| Results Summary |  |
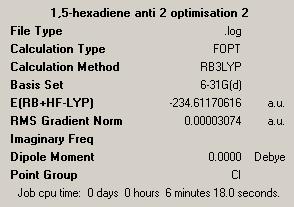
|
| Log File | http://neon-tmp.cc.ic.ac.uk/wiki/images/b/b0/Rachael_anti2_logfile_opt1.LOG | http://neon-tmp.cc.ic.ac.uk/wiki/images/6/67/RACHAEL_ANTI2_HEXADIENE_OPT_2.LOG |
| Diagram to show bond angles | 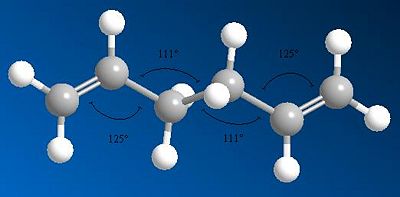 |
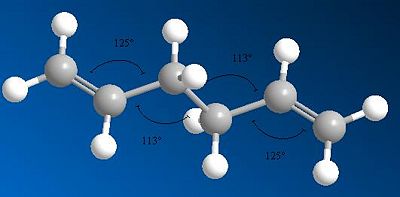
|
It can be seen from the results files from these optimisations that the DFT/B3LYP method has produced a geometry with a lower energy of -234.6a.u. This lower energy is obtained because the method and basis set used in the second optimisation is more accurate than for the first optimisation, therefore the energy is expected to be lower. However, because the optimisations were using different methods and basis sets, the energies are not directly comparable.
The diagrams showing the bond angles of the molecules from different optimisations show that the two central bond angles are 111o for the HF optimised conformer, and 113o for the DFT optimised structure. The increase in bond angle here lengthens the molecule, reducing steric repulsion within the structure. This leads to a lower energy of the conformation after DFT optimisation compared to HF optimisation. The molecule is more stable when there is less steric repulsion, giving a lower total energy for the molecule.
Frequency Analysis of Anti 2 Conformer
A frequency analysis can be carried out in order to verify the success of an optimisation. An optimisation calculation will only find a stationary point, where the first derivative of the potential energy curve becomes very close to zero. A frequency analysis uses the second derivative to characterise the stationary point. If all the frequencies are positive, a minima was reached, and the optimisation was successful. If there is one positive frequency, a maximum has been reached, this is a transition state structure. If more than one frequency is positive, the optimisation was not successful, and the molecule needs to be re-optimised.
When carrying out a frequency analysis it is important to use the same method and basis set as was used for the optimisation. In this case a DFT-B3LYP method was used with a 6-31g(d) basis set, so these were used for the frequency analysis. A log file from the frequency analysis can be found here: http://neon-tmp.cc.ic.ac.uk/wiki/images/f/f4/Log_26037.out .
The checkpoint file from the frequency analysis was opened in Gaussview. The vibrational frequencies were all positive. This shows that the optimisation was successful, and a minima was found, and that the frequency analysis was successful.
Thermochemistry
In the log file for the frequency analysis, under Thermochemistry, the following values can be found.
Sum of electronic and zero-point Energies=           -234.469195
Sum of electronic and thermal Energies=              -234.461847
Sum of electronic and thermal Enthalpies=            -234.460903
Sum of electronic and thermal Free Energies=         -234.500782
These values can be compared to experimental values. The first value, the sum of the electronic and zero-point energies is the potential energy of the molecule at zero kelvin, this energy involves contributions from the zero-point vibrational energy. The second term, the sum of electronic and thermal energies, is the energy of the molecule when the temperature is raised to 298.15K, and pressure of 1 atm. At this higher temperature, the energy now involves contributions from the translational, vibrational, and rotational modes of the molecule. The third energy term is of particular importance when studying dissociation reactions, as it includes correction for RT. The final figure, the sum of electronic and thermal free energies contains contributions from the entropic factor in the free energy.
Optimising Chair and Boat Transition State Structures
Optimising Allyl Fragment
An allyl fragment (CH2CHCH2) was drawn in Gaussview, and optimised using the HF/3-21G method and basis set. The results summary, and structure of the optimised fragment is shown below.
| Diagram of optimised Fragment | 
|
| Rotatable Structure |
|
| Results Summary | 
|
| Log File | http://neon-tmp.cc.ic.ac.uk/wiki/images/3/3b/RACHAEL_ALLYL_FRAGMENT_OPT1.LOG |
This optimised allyl fragment was now ready to be used in the next section.
Optimising Chair Transition State Using the Hartree-Fock and TS Berny Method
Two of the previously optimised allyl fragments were used to create an initial structure of the chair transition state. This initial guess structure is shown below (two views of same geometry).
The distances in between the chain ends were 2.15Å and 2.20Å. This structure was then optimised by using Hartree Fock method and a 3-21g basis set. The following line of text was added as the input for the optimisation and frequency analysis.
# opt=(calcfc,ts,noeigen) freq hf/3-21g geom=connectivity
The log file from this calculation can be found here:http://neon-tmp.cc.ic.ac.uk/wiki/images/1/1a/Log_26157.out
The distance between the ends of the allyl chains are now 2.02Å. The checkpoint file from these results was opened in Gaussview, to show that only one negative frequency was obtained, at -818cm-1, this shows that a maximum has been found, corresponding to a transition state structure. The negative frequency can be found in the log file here:
Low frequencies --- -818.0952   -4.4591   -0.0007   -0.0007   -0.0006    2.6371
Low frequencies ---    7.5515  209.6748  396.4152
******    1 imaginary frequencies (negative Signs) ******
Diagonal vibrational polarizability:
       8.0667050       2.5564952       0.4530692
Diagonal vibrational hyperpolarizability:
      -0.0052713      -0.0183673       0.0000526
Harmonic frequencies (cm**-1), IR intensities (KM/Mole), Raman scattering
activities (A**4/AMU), depolarization ratios for plane and unpolarized
incident light, reduced masses (AMU), force constants (mDyne/A),
and normal coordinates:
                    1                      2                      3
                    A                      A                      A
Frequencies --  -818.0952               209.6748               396.4152
Red. masses --     9.8823                 2.2186                 6.7657
Frc consts  --     3.8969                 0.0575                 0.6264
IR Inten    --     5.9147                 1.5734                 0.0000
Raman Activ --     0.0000                 0.0000                16.7879
Depolar (P) --     0.3228                 0.4870                 0.3871
Depolar (U) --     0.4881                 0.6550                 0.5581
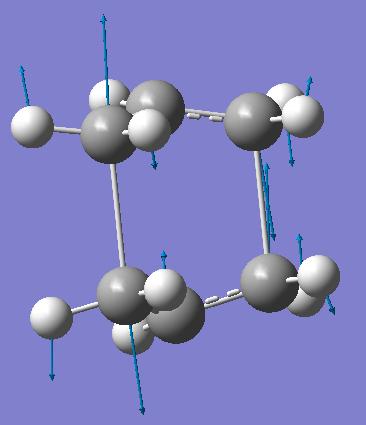
Gaussview was used to animate the vibration and it was seen that the vibration corresponds to the cope rearrangement. This is shown below.
| Optimised Transiiton State Structure | 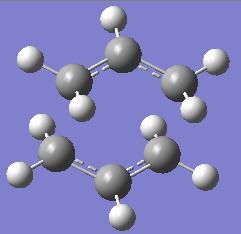
|
| Rotatable Structure |
|
| Diagram to show vibration at -818cm-1 | 
|
Optimising Chair Transition State Using the Hartree-Fock and Frozen Coordinate Methods
The initial guessed geometry of the chair transition state was used for this optimisation. The terminal carbons in the allyl chains were fixed by using the Redundant Coordinate editor. The optimisation was submitted using the following input.
# opt=modredundant hf/3-21g geom=connectivity
The log file from the calculation can be found here: http://neon-tmp.cc.ic.ac.uk/wiki/images/f/fd/Log_26173.out .
The checkpoint file was opened in Gaussview, in order to optimise the bond forming/breaking distances, which were fixed during the last optimisation. A TS Berny method was used to optimise the previously frozen bonds to an equilibrium bond length. The following input was used for the calculation:
# opt=(ts,modredundant,noeigen) freq hf/3-21g geom=connectivity
The log file can be found here: http://neon-tmp.cc.ic.ac.uk/wiki/images/6/6a/Log_26181.out
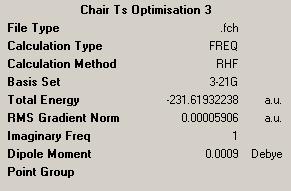
The checkpoint file from this calculation was opened in Gaussview. The distance between the terminal carbon atoms in tha allyl chains was now 2.02Å. The results files from both different methods, the frozen coordinate method and TS Berny method can be compared by looking at the energy of the final optimised structures.
| TS Berny method | Frozen Coordinate Method |
|---|---|
 |
|
The results summaries show that there is marginal difference between the two methods. The energies show that the optimised structure from the frozen coordinate method is very slightly more stable, but this is such a small difference this may be due to errors in the calculations.
Optimising Boat Transition State Using the Hartree-Fock and QST2 Methods
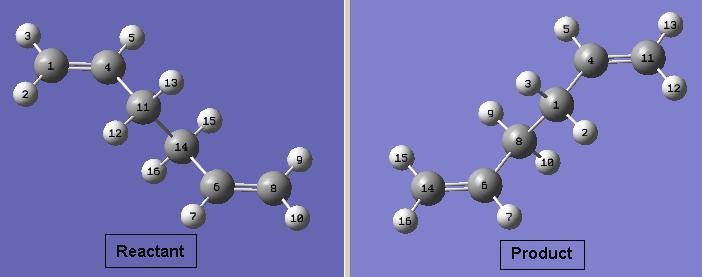
The previously optimised anti 2 structure for 1,5-hexadiene was used to model the reactants and products for the reaction. This method attempts to find the transition state between specified reactants and products. However, for a successful calculation, the reactant and product molecules need to be numbered in the same way. The numbering used for this calculation is shown below.
The following input was used to set up a transition state optimistation using the QST2 method:
# opt=qst2 freq hf/3-21g geom=connectivity
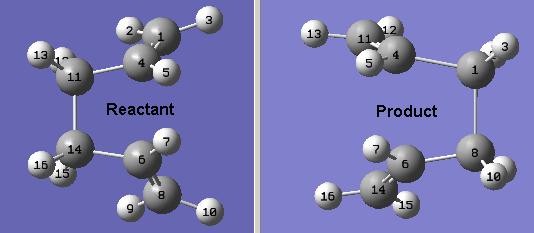
However, the calculation failed (http://neon-tmp.cc.ic.ac.uk/wiki/images/e/ea/Log_26202.out). The checkpoint file was opened in Gaussview, and the transition state obtained resembled the chair transition state, only more distorted. This is because the method uses Hammond's Postulate to calculate the transition state structure, in that the product of the reaction should be similar in structure to the transition state. This method has not produced the boat transition state as desired. In order to achieve a structure for the boat transition state, the initial structure will be modified manually to produce an initial guess structure which is closer to the boat transition state.
The manually altered structures are shown below.
The calculation was repeated using the new structures, but the same method as last time. The log file from the calculation can be found here: http://neon-tmp.cc.ic.ac.uk/wiki/images/b/b5/Log_26214.out .
The log file was checked, and there was only one negative frequency:
Low frequencies --- -840.1453   -4.5470   -2.9569    0.0006    0.0009    0.0009
Low frequencies ---    7.2039  155.4632  382.4331
******    1 imaginary frequencies (negative Signs) ******
Diagonal vibrational polarizability:
       6.2520663       1.1543337       0.3269718
Diagonal vibrational hyperpolarizability:
      -0.0000529      -0.0467417      -0.4800473
Harmonic frequencies (cm**-1), IR intensities (KM/Mole), Raman scattering
activities (A**4/AMU), depolarization ratios for plane and unpolarized
incident light, reduced masses (AMU), force constants (mDyne/A),
and normal coordinates:
                    1                      2                      3
                    A                      A                      A
Frequencies --  -840.1452               155.4628               382.4331
Red. masses --     8.4583                 2.2249                 5.4053
Frc consts  --     3.5176                 0.0317                 0.4658
IR Inten    --     1.6198                 0.0000                 0.0629
Raman Activ --    27.0691                 0.1927                42.0878
Depolar (P) --     0.7500                 0.7500                 0.1863
Depolar (U) --     0.8571                 0.8571                 0.3141
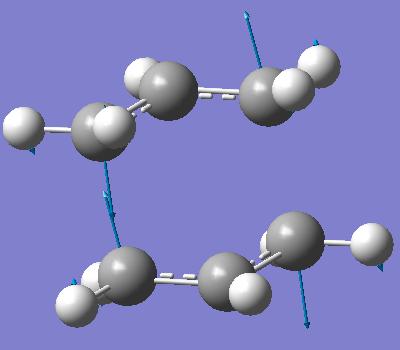
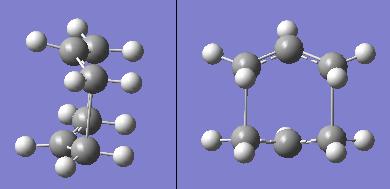
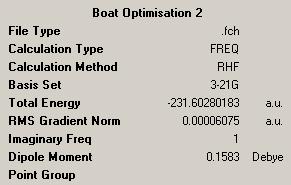
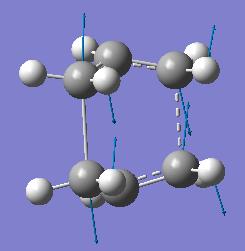
This single negative frequency shows that this is a transition state. The transition state is the boat transition state. The structure and a diagram of the negative vibration are shown below.
| Boat Transition Structure | Results Summary | Diagram to show vibration at -840cm-1 |
|---|---|---|
 |
 |
|
|
|
The negative vibration corresponds to the breaking/forming bonds in the cope rearrangement. So, after rearranging the reactant and product geometry, the boat transition state was obtained using this method. So, when using this method it is important that the initial guess geometries of the reactant and product are chosen carefully to resemble the expected transition state structure.
Calculating the Intrinsic Reaction Coordinate (IRC) for Chair Transition State
The Intrinsic Reaction Coordinate method can be used to follow the minimum energy pathway from the transition state in the reaction to a local minimum on the potential energy curve. It can be used to predict which conformers of the 1,5-hexadiene are reacting together to produce the transition states. From the structure of the transition state, small changes are made to the geometry, until a minimum is reached. The minimum is the product, or reactant. Due to the symmetrical nature of the reaction coordinate, the IRC only needs to be calculated in one direction, in this case the forward direction.
The checkpoint file from the Hartree-Fock and TS Berny optimised chair transition state was opened in Gaussview, and an IRC calculation was set up using the following input, where 50 iterations were used:
# irc=(forward,maxpoints=50,calcfc) rhf/3-21g geom=connectivity
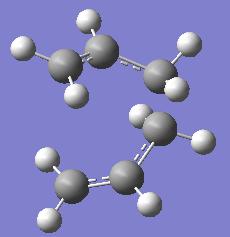
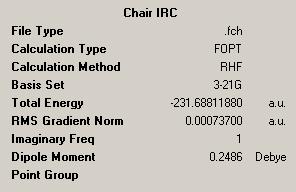
The log file from the calculation can be found here: http://neon-tmp.cc.ic.ac.uk/wiki/images/d/dc/Log_26234.out . The checkpoint file from the calculation was opened in Gaussview, and the intermediate geometries were viewed. It was seen that the structure had not reached a minimum.
| Diagram of Structure after IRC | Rotatable Structure | Results Summary |
|---|---|---|
 |
|
|
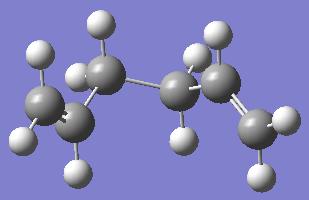
Looking at the structure after the IRC calculation, it can be seen that where a bond is not forming between the two carbon atoms at one of the ends of both allyl chains, the carbons are still quite close together, they are 3.28Å apart. This clearly is not a minimum energy geometry.
In order to improve upon these results, three different approaches were tried, to try and reach a minimum.
Approach 1: Minimising Last Structure of IRC
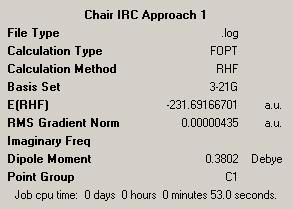
This is the quickest of the three approaches listed. The last structure produced in the IRC calculation was minimised. The log file from the calculation can be found here: http://neon-tmp.cc.ic.ac.uk/wiki/images/f/f8/Log_26238.out .
The log file was used to confirm that the calculation has converged:
     Item               Value     Threshold  Converged?
Maximum Force            0.000024     0.000450     YES
RMS     Force            0.000007     0.000300     YES
Maximum Displacement     0.001459     0.001800     YES
RMS     Displacement     0.000412     0.001200     YES
| Diagram of Minimised Structure | Rotatable Structure | Results Summary |
|---|---|---|
 |
|
|
When Edit --> Symmetrize was used, the structure was found to have C2 symmetry. The structure has been identified as the gauche 2 structure from appendix 1.
Approach 2: Increasing Number of Iterations
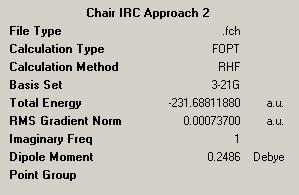
In order to carry out this approach, the number of iterations was increased to 200, and the IRC calculation was run again, using the initial chair structures used in the first IRC calculation.
The log file from the calculation can be found here: http://neon-tmp.cc.ic.ac.uk/wiki/images/0/02/Log_26241.out .
| Diagram of Structure after IRC | Rotatable Structure | Results Summary |
|---|---|---|
 |
|
|
These results show that this further calculation has still not reached a minimum. The structure obtained here has a higher energy than for approach 1, because it has not yet reached a minimum. If the number of steps were increased further, there is a possibility that the wrong structure may be reached if too many steps are used if the calculation goes in the wrong direction.
Approach 3: Calculating Force Constants for Every Step
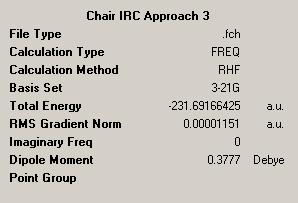
For this approach, the IRC calculation was repeated specifying that the force constants are calculated at every step of the calculation.
The log file from this calculation can be found here: http://neon-tmp.cc.ic.ac.uk/wiki/images/e/ed/Log_26242.out
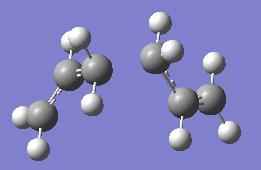
| Diagram of Structure after IRC | Rotatable Structure | Results Summary |
|---|---|---|
 |
|
|
By using Edit-->symmetrize, it was found that this structure had C2 symmetry. The energy and structure of this molecule very closely resembles the gauche 2 structure.
Conclusion to Different Approaches
It was found that the fastest method, approach one found that the minimum energy structure was the gauche 2 structure of the 1,5-hexadiene. This was confirmed by the symmetry and the energy of the structure. A similar result was achieved when using approach 3, where the force constants were calculated at every step. This was also successful in obtaining a minimum energy structure. Approach 2 was not so successful, even after 200 iterations, a minimum had not been reached. If many more steps were used to reach a minimum, this still may have produced the wrong structure, if the calculation went in the wrong direction.
So in conclusion this method can be used to show that the chair transition state arises from the gauche 2 conformer of 1,5-hexadiene.
Calculating the Intrinsic Reaction Coordinate (IRC) for Boat Transition State
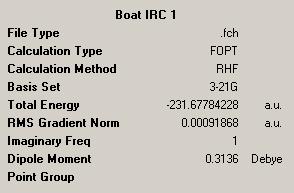
Following the investigation into the best approach using the chair transition state, the IRC will be calculated for the boat transition state to show which conformer of 1,5-hexadiene reacts to give the boat structure. The previously optimised structure of the boat transition state was used for the calculation, and 50 iterations were used.
The log file from the calculation can be found here: http://neon-tmp.cc.ic.ac.uk/wiki/images/5/59/Log_26282.out
| Diagram of Structure after IRC | Rotatable Structure | Results Summary |
|---|---|---|
 |
|
|
As was seen from the IRC calculation for the chair transition state, this calculation does not reach a minimum. So, both approaches 1 and 3 were applied to the boat transition state, in order to show which conformer of 1,5-hexadiene gives the boat structure. Approach 2 was not used because it does not produce very good results.
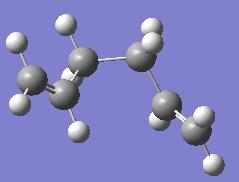
Using Approach 1: Minimising Last Structure of IRC
The final structure achieved using the first IRC calculation was minimised.
The log file from the calculation can be found here: http://neon-tmp.cc.ic.ac.uk/wiki/images/5/56/Log_26284.out .
The log file was checked to show that the calculation had converged:
       Item               Value     Threshold  Converged?
Maximum Force            0.000027     0.000450     YES
RMS     Force            0.000008     0.000300     YES
Maximum Displacement     0.001432     0.001800     YES
RMS     Displacement     0.000317     0.001200     YES
| Diagram of Minimised Structure | Rotatable Structure | Results Summary |
|---|---|---|
 |
|
|
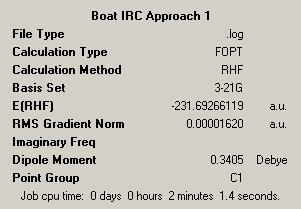
When Edit --> Symmetrize was used, the structure was found to have C1 symmetry. The structure has been identified as the gauche 3 structure from appendix 1. The energy shown on the results file is the same as the energy reported in appendix 1 for the gauche 3 structure.
Using Approach 3: Calculating Force Constants for Every Step
For this approach, the previous IRC calculation, using the optimised boat transition state, was repeated specifying that the force constants are calculated at every step of the calculation.
The log file from this calculation can be found here: http://neon-tmp.cc.ic.ac.uk/wiki/images/1/1b/Log_26285.out
| Diagram of Structure after IRC | Rotatable Structure | Results Summary |
|---|---|---|
 |
|

|
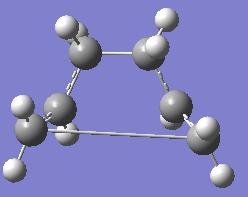
By using Edit-->symmetrize, it was found that this structure had C1 symmetry. The structure of this molecule very closely resembles the gauche 3 structure, even though there is a very long bond still between the terminal carbon atoms. The energy shown in the results file reflects this inaccuracy, it is only the right energy correct to 2 decimal places.
So when these methods are used on the boat transition state structure, it has been shown that the gauche 3 conformer of 1,5-hexadiene gives this transition state structure. However, the first approach is much more reliable in this case. Approach 3 produced a reasonable result, and confirmed that the boat transition state structure arises from the gauche 3 conformer.
Calculating Activation Energies for Reaction via Chair and Boat Transition States
Re-optimising Chair and Boat Transition State Structures
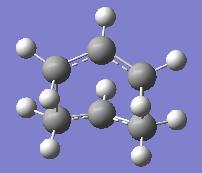
In order to calculate the activation energies for the reaction via both transition states, the transition state structures must be optimised using a more accurate method and basis set. For this optimisation a DFT-B3LYP method and 6-31g(d) basis set will be used. The log files were used to check whether the calculations had converged:
Chair
        Item               Value     Threshold  Converged?
Maximum Force            0.000017     0.000450     YES
RMS     Force            0.000005     0.000300     YES
Maximum Displacement     0.000098     0.001800     YES
RMS     Displacement     0.000043     0.001200     YES
Boat
        Item               Value     Threshold  Converged?
Maximum Force            0.000066     0.000450     YES
RMS     Force            0.000014     0.000300     YES
Maximum Displacement     0.001640     0.001800     YES
RMS     Displacement     0.000564     0.001200     YES
| Transition State Structure | Chair | Boat |
|---|---|---|
| Diagram of re-optimised structure | 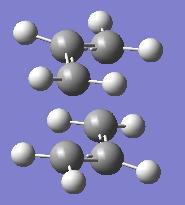 |
|
| Rotatable Structure |
|
|
| Results Summary | 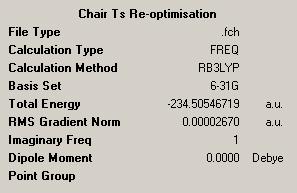 |

|
| Log File | http://neon-tmp.cc.ic.ac.uk/wiki/images/5/58/Log_26581.out | http://neon-tmp.cc.ic.ac.uk/wiki/images/a/a8/Log_26584.out |
Comparing Two Different Methods of Optimisation
Chair Transition State
When the log file was studied for the chair re-optimisation it was found that the imaginary frequency, previously calculated at -818cm-1 using the HF/3-21G method has risen considerably to -566cm-1. The following section of the log file shows this.
 Low frequencies --- -565.5453   -0.0006    0.0006    0.0007   22.0003   27.2967
Low frequencies ---   39.7635  194.5129  267.9400
******    1 imaginary frequencies (negative Signs) ******
Diagonal vibrational polarizability:
       8.5395976       1.9447688       0.4004359
Harmonic frequencies (cm**-1), IR intensities (KM/Mole), Raman scattering
activities (A**4/AMU), depolarization ratios for plane and unpolarized
incident light, reduced masses (AMU), force constants (mDyne/A),
and normal coordinates:
                    1                      2                      3
                    A                      A                      A
Frequencies --  -565.5453               194.5129               267.9068
Red. masses --    10.4771                 2.1448                 7.9642
Frc consts  --     1.9744                 0.0478                 0.3368
IR Inten    --     0.0825                 0.8669                 0.0000
This vibration was animated in Gaussview to check that it still corresponded to the cope rearrangment. The following diagram shows that this is the case.
The distance between the terminal carbons of the allyl chains had decreased from 2.02Å to 1.97Å, only a slight decrease between the two methods. There is also a difference between the energy calculated for the final structures by the two methods. This was found to be -231.619322a.u. for the HF/3-21G method and -234.55698a.u. for the DFT-B3LYP/6-31G(D) method. However, these energies are not comparable because different methods and basis sets were used, with different accuracy levels.
Boat Transition State
As for the chair transition state, the log file for the re-optimisation of the boat transition state also showed a large change in the negative frequency value calculated. The negative frequency was -840cm-1 using the HF/3-21G method and -530cm-1 for the DFT-B3LYP/6-31G(D) method.
Low frequencies --- -529.6787   -8.8483   -0.0010   -0.0007   -0.0003   15.9313
Low frequencies ---   18.2943  135.6500  261.3248
******    1 imaginary frequencies (negative Signs) ******
Diagonal vibrational polarizability:
       4.5601585       1.2088625       0.5199655
Harmonic frequencies (cm**-1), IR intensities (KM/Mole), Raman scattering
activities (A**4/AMU), depolarization ratios for plane and unpolarized
incident light, reduced masses (AMU), force constants (mDyne/A),
and normal coordinates:
                    1                      2                      3
                    A                      A                      A
Frequencies --  -529.6787               135.5946               261.3248
Red. masses --     9.1521                 2.2446                 6.7598
Frc consts  --     1.5129                 0.0243                 0.2720
IR Inten    --     0.3414                 0.0000                 0.2852
This vibration still corresponds to the cope rearrangement, as the following diagram, showing the motion of the vibration shows.
The geometry of the boat transition structure changed more than the chair using the more accurate method. The initial distance between the terminal carbon atoms of the allyl chains using the HF/3-21G method was 2.14Å, which increased to 2.21Å when using the DFT-B3LYP/6-31G(D) method. The energies also changed when the new method was used, the energy is -234.54309a.u. for the DFT-B3LYP/6-31G(D) method when previously it was -231.60280a.u. for the HF/3-21G method.
Calculating Activation Energies
In order to calculate the activation energies, the following sections are needed from the log files. The transition states will be compared to the anti 2 conformer of 1,5-hexadiene.
Anti 2
Sum of electronic and zero-point Energies=           -234.469195
Sum of electronic and thermal Energies=              -234.461847
Sum of electronic and thermal Enthalpies=            -234.460903
Sum of electronic and thermal Free Energies=         -234.500782
Chair Transition State
Sum of electronic and zero-point Energies=           -234.414930
Sum of electronic and thermal Energies=              -234.409009
Sum of electronic and thermal Enthalpies=            -234.408065
Sum of electronic and thermal Free Energies=         -234.443815
Boat Transition State
Sum of electronic and zero-point Energies=           -234.402349
Sum of electronic and thermal Energies=              -234.396013
Sum of electronic and thermal Enthalpies=            -234.395068
Sum of electronic and thermal Free Energies=         -234.431761
| Energy at 0K (a.u.) | ΔE at 0K (a.u.) | Activation Energy at 0K (kcal/mol) | Experimental activation energy at 0K (kcal/mol) | |
|---|---|---|---|---|
| Anti 2 conformer | -234.469195 | \ | \ | \ |
| Chair Transition State | -234.414930 | 0.054265 | 34.05 | 33.5 ± 0.5 |
| Boat Transition State | -234.402349 | 0.066846 | 41.95 | 44.7 ± 2.0 |
| Energy at 298K (a.u.) | ΔE at 298K (a.u.) | Activation Energy at 298K (kcal/mol) | ||
| Anti 2 conformer | -234.461847 | \ | \ | |
| Chair Transition State | -234.409009 | 0.052838 | 33.16 | |
| Boat Transition State | -234.396013 | 0.065834 | 41.31 |
These results show that the activation energy for the reaction proceeding via the chair transition state is much lower than via the boat transition state. The difference between the two computed activation energies is 7.90kcal/mol. This shows that the kinetic route of the reaction is via the chair transition state structure, due to the lower activation energy. The reason for this difference between the activation energies could be due to the geometry of the two different transition state structures. The distance between the carbon atoms at the ends of the allyl chains, involved in the rearrangement, was 1.97Å for the chair structure and 2.21Å for the boat structure. This shows that the carbon atoms reacting together are closer in the chair transition structure, so lowering the activation energy of the Cope Rearrangement through this transition state structure.
The values computed for the reaction at 0K show reasonable agreement with the experimental values. This shows that the optimisations have been successful.
The Diels Alder Cycloaddition
The Diels Alder reaction is a pericyclic reaction, where a diene and a dienophile react together. The reaction may or may not occur based on the interaction of the π-orbitals of the two reactants. If the HOMO of one reactant can overlap with the LUMO of the other reactant, then the reaction is allowed. However, if the HOMO and LUMO have different symmetry properties, the interaction is not allowed and the reaction will not occur.
In this section, two Diels Alder reactions will be studied, the first is a simple reaction where neither of the reactants have substituents, whereas in the second example, both the diene and the dieneophile have substituents.
Diels Alder Reaction of Ethylene and Butadiene
The first reaction in this section is the reaction between ethylene and butadiene which is a [4n+2] cycloaddition. The reaction scheme is shown below.
Optimising the Reactants
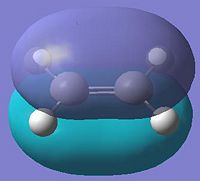
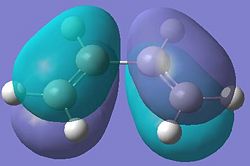
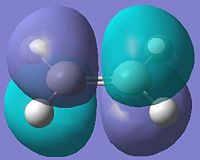
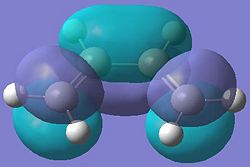
To begin, ethylene and cis-butadiene were drawn in Gaussview, and optimised using an AM1 calculation. This was used in order to plot the HOMO and LUMO molecular orbitals of each of the reactants. The diagrams below show the optimised structures of the reactant molecules, and the HOMO and LUMO of each.
For the Diels Alder reaction between ethylene and butadiene, the HOMO of the ethylene and LUMO of the butadiene interact with each other, they are both symmetric, the LUMO of the ethylene and HOMO of the butadiene are both anti-symmetric, and these interact together.
The AM1 method had been used in order to generate the molecular orbitals, as shown above. The reactant molecules were then optimised again, using a more accurate method and basis set, a DFT-B3LYP method and 6-31G basis set were used.
The log files from these calculations can be found here:
Ethylene: http://neon-tmp.cc.ic.ac.uk/wiki/images/f/fb/RACHAEL_ETHYLENE_B3LYP.LOG
Butadiene: http://neon-tmp.cc.ic.ac.uk/wiki/images/7/77/RACHAEL_BUTADIENE_B3LYP.LOG
Both calculations had converged, this was shown in the log files.
Optimising the Transition State
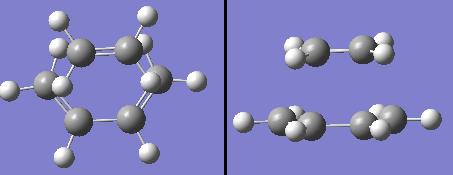
The optimised structures of the reactants were used to construct an initial guess structure for the transition state for the Diels Alder reaction. This structure is shown below.
The ethylene carbons are positioned 2.20Å away from the carbons at the ends of the butadiene chain.
An optimisation and frequency analysis was carried out on this transition state structure using the following input line:
# opt=(calcfc,ts,noeigen) freq rb3lyp/6-31g geom=connectivity
This shows that a TS Berny method was used, with a DFT-B3LYP method and 6-31G basis set.
The log file from the calculation can be found here: http://neon-tmp.cc.ic.ac.uk/wiki/images/4/44/Log_26348.out
The following section from the log file confirms that a transition state has been found. This is because there is only one negative frequency shown. The other negative low frequency will be ignored, as these low frequencies should be as close to zero as possible, this value is within -5cm-1, so this is reasonable.
Low frequencies --- -534.8666   -4.0750    0.0005    0.0005    0.0007   11.8792
Low frequencies ---   19.5068  139.8412  205.3414
******    1 imaginary frequencies (negative Signs) ******
Diagonal vibrational polarizability:
       3.5123013       3.1795818       1.1144804
Harmonic frequencies (cm**-1), IR intensities (KM/Mole), Raman scattering
activities (A**4/AMU), depolarization ratios for plane and unpolarized
incident light, reduced masses (AMU), force constants (mDyne/A),
and normal coordinates:
                    1                      2                      3
                    A                      A                      A
Frequencies --  -534.8665               139.7890               205.3263
Red. masses --     8.1834                 2.1734                 3.9818
Frc consts  --     1.3793                 0.0250                 0.0989
IR Inten    --     6.7380                 0.8101                 1.2708
The checkpoint file from the calculation was then opened with Gaussview, so that the imaginary frequency could be animated.
| Optimised Structure | 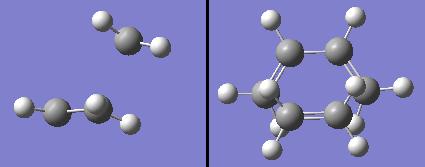
|
| Rotatable Structure |
|
| Results Summary | 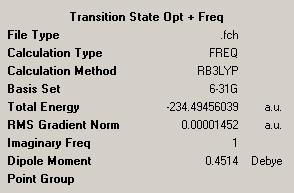
|
| Diagram of motion for Vibration at -535cm-1 | 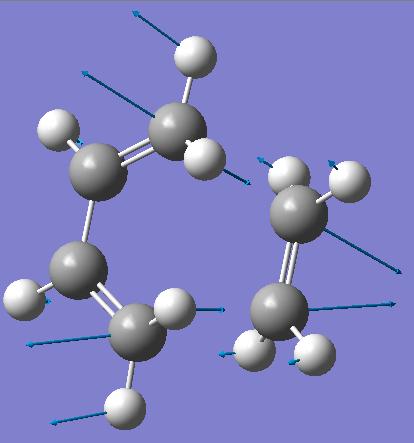
|
| Diagram of motion for Vibration at 140cm-1 | 
|
This imaginary vibration corresponds to the cycloaddition, the two bonds are forming at the same time; the bond formation is synchronous. The imaginary frequency shows the two pairs of carbon atoms forming new σ-bonds moving together and apart at the same time. The lowest positive vibration, at 140cm-1, shows a twisting/rocking motion of the butadiene and ethylene, with both reactants moving in opposite directions.
Geometry of Transition State
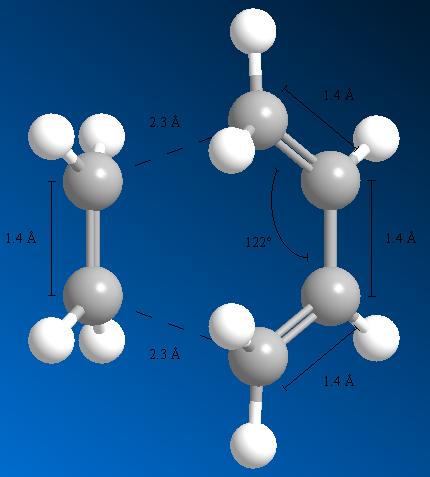
The diagram below shows selected bond lengths and angles for the optimised transition state structure.
Typical bond lengths for sp2 hybridised C=C bond is 1.34Å, whereas an sp3 hybridised C-C bond is more usually 1.54Å. The bond lengths shown for the transition state indicate that the 1.4Å bond length of butadiene is between these two lengths. These terminal bonds are lengthening to become sp3, single C-C bonds, and the central bond is shortening to become a double C=C, sp2 hybridised bond.
The van der Waals radius of a carbon atom is 1.70Å. This radius is the radius of a hypothetical hard sphere, used to model the atom. The two pairs of carbon atoms forming σ-C-C bonds are 2.3Å apart, as shown on the diagram above. If two hard spheres were next to each other, just touching, the distance between the centres would be double the radius. In this case, 3.4Å would be the distance between the two carbon atoms. So, in this transition state, the carbon atoms forming the new σ-bonds are within this distance (3.4Å). This shows that the carbon atoms are interacting, forming the new σ-bonds.
Analysing the Molecular Orbitals of the Transition State
In order to view the molecular orbitals of the transition state for the reaction, a population analysis calculation had to be done using the optimised transition state structure. The following input line was used to do this.
# rb3lyp/6-31g pop=(nbo,full) geom=connectivity
The log file from this calculation can be found here: http://neon-tmp.cc.ic.ac.uk/wiki/images/7/71/Log_26352.out
The checkpoint file from the calculation was opened using Gaussview in order to see the molecular orbitals of the transition state.
| Molecular Orbital | Diagram of MO | Energy (a.u.) | Symmetry |
|---|---|---|---|
| HOMO | 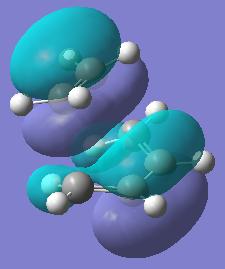 |
-0.219 | Symmetric |
| LUMO | 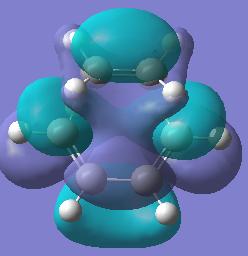 |
-0.007 | Symmetric |
Both the HOMO and the LUMO of the transition state appear to be composed of the symmetric HOMO of ethylene, and the symmetric LUMO of butadiene. These two symmetric molecular orbitals of the reactants combine to give 2 symmetric molecular orbitals in the transition state. The interaction of these reactant orbitals is allowed, because they have the same symmetry, therefore the cycloaddition reaction is allowed.


