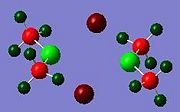
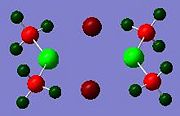
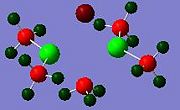
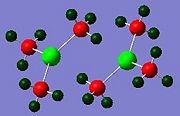
Rep:Mod:0409rcba
Module 2 - Rachael Bartholomew
Throughout this module, all bond angles are reported correct to 0.1o, bond distances correct to 0.01Å, intensities and frequencies are written to the nearest whole integer value.
Modelling BH3
Creating and Optimising BH3
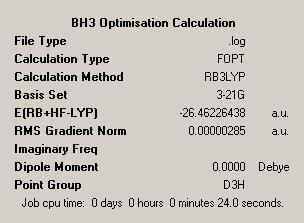
The aim of this section is to create and model a molecule of BH3 in order to optimise the geometry. Gaussview was used to draw the BH3 molecule. The bond lengths were set to 1.50Å, and the bond angles were 120.0o, before the optimisation. Then an optimisation of the molecule was run using the B3LYP method and a 3-21G basis set. This basis set is inaccurate, but was chosen so that the calculation would run quickly. After the optimisation, the output file was opened in Gaussview. The ouput file can be found here: https://www.ch.ic.ac.uk/wiki/images/0/06/RB_BH3_OPT.LOG . The optimised BH3 molecule is shown below with the results summary generated.
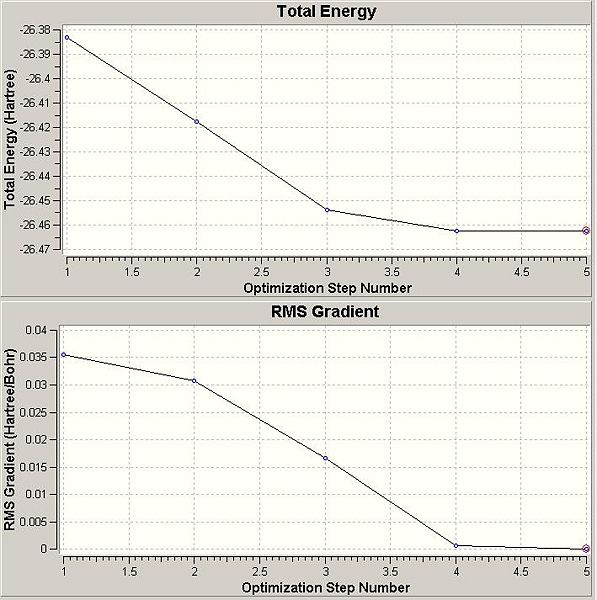
After the optimisation of the molecule, the B-H bond lengths are 1.19Å and the H-B-H bond angles are 120.0o. The following graphs were obtained showing the energy of the molecule at every step during the optimisation (top graph) and the gradient of the energy at every step (bottom graph).
The diagrams below show the BH3 molecule at the different steps in the optimisation. It can be seen that the hydrogen atoms move closer to the boron atom, as the bonds decrease in length from the chosen 1.50Å to the optimum bond length 1.19Å.
In this case using BH3 when the optimisation is run, the bond lengths shorten. This decrease in bond length lowers the total energy of the molecule. This is because the forces acting on the nuclei (nucleus-nucleus repulsion, electron-electron repulsion and nucleus-electron attraction), decrease as the bond length decreases.
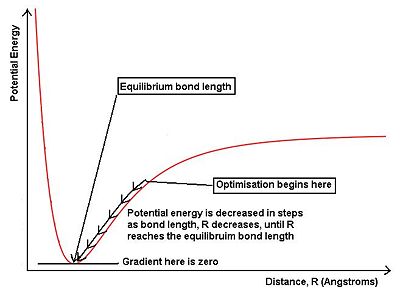
The diagram above shows a potential energy surface for a molecule. The changing potential energy with distance, R is shown by the red curve. To the left of the equilibrium bond length, the nuclei are closer than the equilibrium value, so the nucleus-nucleus repulsion force increases, this increases the potential energy away from the minimum. Oppositely, to the right of the equilibrium bond length, the nuclei are further apart, and the nucleus-electron attraction force decreases, which in turn increases the potential energy of the molecule. In the above optimisation, the B-H bond length was set to 1.50Å, which is higher than the ideal bond length, so the starting point for the optimisation, as shown, is to the right of the equilibrium bond length. During the optimisation, the bond length is decreased in steps, lowering the energy of the molecule. The optimisation is complete when the gradient of the potential energy reaches zero, or very close to zero. This is because the gradient at the minimum of the potential energy curve is zero, where the equilibruim bond length of the molecule lies.
So, looking at the two graphs obtained from the optimisation the top graph shows how the potential energy of the molecule is decreasing, as the bond length decreases, down the potential energy curve. The bottom graph shows how the gradient of the potential energy curve changes, decreasing until it reaches zero, or very close to zero, when the optimisation is finished.
Molecular Orbitals of BH3
The checkpoint file from the optimisation of BH3 , above, was used for a further calculation in order to show the molecular orbitals of the molecule. The same basis set, 3-21G was used with a B3LYP method.
The ouput file from this calculation is here: https://www.ch.ic.ac.uk/wiki/images/2/29/RB_BH3_POP.LOG
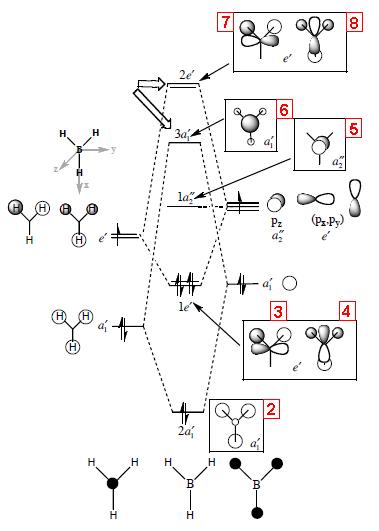
The calculated molecular orbital (MO) diagrams are shown below, with an LCAO (Linear Combination of Atomic Orbitals) molecular orbital diagram. The red numbers on the LCAO MO diagram below show which of the calculated molecular orbitals correspond to this molecular orbital.
| Number shown on LCAO MO diagram | Diagram of Calculated MO | Diagram of LCAO MO | Energy of Calculated MO (a.u.) |
|---|---|---|---|
| 8 | 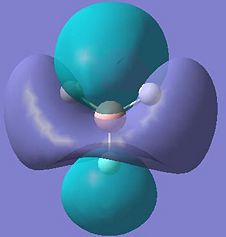 |
 |
+0.188 |
| 7 | 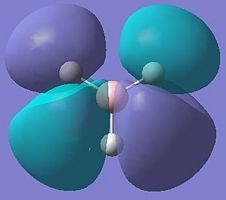 |
 |
+0.188 |
| 6 | 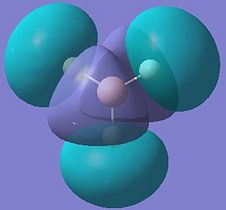 |
 |
+0.191 |
| 5 | 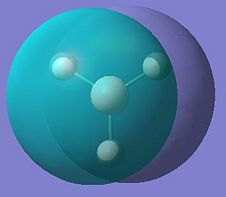 |
 |
-0.074 |
| 4 | 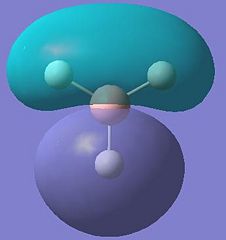 |
 |
-0.356 |
| 3 | 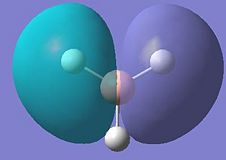 |
 |
-0.356 |
| 2 | 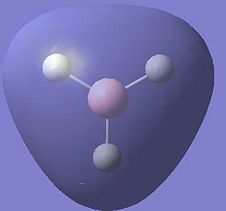 |
 |
-0.517 |
| (1) | 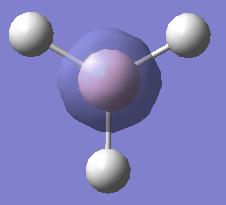 |
-6.730 |
These results show that all the bonding and non-bonding calculated molecular orbitals (1-5) of the molecule show good agreement with the LCAO approach diagram. The last molecular orbital, (1), in the table is not shown in the LCAO MO diagram, this would be the 1a'1 molecular orbital, which would appear quite far below the 2a'1 orbital shown in the diagram. By looking at the energies of the anti-bonding calculated molecular orbitals(6-8), it can be seen that the LCAO method doesn't compare well to the calculated orbitals. The LCAO diagram shows that the 3a'1 molecular orbital should have an energy lower than the two degenerate 2e' MO's. However, the calculated energy for this (3a'1) orbital is actually higher than the 2e' orbital energy.
These results show that when using calculated molecular orbitals, it is only useful to observe the bonding, and non-bonding molecular orbitals, as the anti-bonding orbitals produce unexpected results. These discrepancies could be due to using quite an inaccurate basis set (3-21G basis set), this was chosen for quick calculation. In order to improve the results, more terms should be included in the basis set to improve the accuracy.
Natural Bond Orbital (NBO) Analysis of BH3
The log file from the population analysis calculation (checkpoint file from this used to generate the molecular orbitals above) was used to begin the NBO analysis of the BH3 molecule.
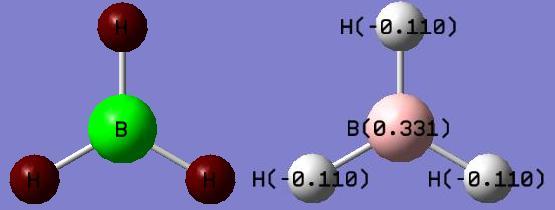
The diagram on the left above shows the charge distribution in the molecule. The boron atom, in the centre, is green due to high positive charge, and the hydrogen atoms are shown as deep red, showing negative charge. This is expected, as boron is an electropositive element, and in this molecule is electron deficient. The diagram on the right, above, shows the charge numbers associated with each of the elements in the molecule. Charges are shown in Coulombs, C. These charge numbers show the same result as the coloured diagram, in that the boron is much more electropositive than the hydrogens, which show negative charge numbers. Also, all the charges add up to zero, so the molecule is neutral, as expected.
NBO analysis in Gaussview is not very detailed, so in order to conduct a more thorough analysis, the log file must be investigated. The NBO analysis section of the log file can be found here: https://www.ch.ic.ac.uk/wiki/images/4/48/NBO_analysis_data_rcb07.txt
This data provides more information about the charge densities within the molecule. The charge numbers shown in Gaussview can be found in the log file:
Summary of Natural Population Analysis:

                                      Natural Population
               Natural  -----------------------------------------------
   Atom  No    Charge         Core      Valence    Rydberg      Total
-----------------------------------------------------------------------
     B    1    0.33126      1.99904     2.66970    0.00000     4.66874
     H    2   -0.11042      0.00000     1.11010    0.00032     1.11042
     H    3   -0.11042      0.00000     1.11010    0.00032     1.11042
     H    4   -0.11042      0.00000     1.11010    0.00032     1.11042
=======================================================================
  * Total *    0.00000      1.99904     6.00000    0.00097     8.00000
This table is from the log file. The values in bold type are the charge numbers for the atoms, which were displayed in Gaussview, shown in the diagrams of the molecule, above.
Orbital Analysis:
    1. (1.99851) BD ( 1) B   1 - H   2
               ( 44.49%)   0.6670* B   1 s( 33.33%)p 2.00( 66.67%)
                                           0.0000  0.5774  0.0000  0.0000  0.0000
                                           0.8165  0.0000  0.0000  0.0000
               ( 55.51%)   0.7451* H   2 s(100.00%)
                                           1.0000  0.0000
    2. (1.99851) BD ( 1) B   1 - H   3
               ( 44.49%)   0.6670* B   1 s( 33.33%)p 2.00( 66.67%)
                                           0.0000  0.5774  0.0000  0.7071  0.0000
                                          -0.4082  0.0000  0.0000  0.0000
               ( 55.51%)   0.7451* H   3 s(100.00%)
                                           1.0000  0.0000
    3. (1.99851) BD ( 1) B   1 - H   4
               ( 44.49%)   0.6670* B   1 s( 33.33%)p 2.00( 66.67%)
                                    0.0000  0.5774  0.0000 -0.7071  0.0000
                                          -0.4082  0.0000  0.0000  0.0000
               ( 55.51%)   0.7451* H   4 s(100.00%)
                                           1.0000  0.0000
    4. (1.99904) CR ( 1) B   1           s(100.00%)
                                           1.0000  0.0000  0.0000  0.0000  0.0000
                                           0.0000  0.0000  0.0000  0.0000
This section of the file shows the different contributions from each of the atomic orbitals of the atoms to the bonding in the molecule. Next to number 1, this part of the table shows that 44.49% of this bond (BD) is from the orbitals on the boron atom. The boron orbitals have 33.33% s-character, and 66.67% p-character. The remaining 55.51% of the bond comes from the hydrogen s orbital, which is 100% s-type orbital. This shows that this bonding orbital is an sp2 hybrid orbital of the boron interacting with the s-orbital on the hydrogen atom. The next 2 bonds also show the same bonding contributions. This is expected because all the B-H bonds should be the same, the molecule has D3h symmetry.
The last section in the table shows that the core (CR) is the 1s orbital of the boron atom.
These 4 sections of this table describe the first four molecular orbitals, constructed from atomic orbitals. In order to study the non-bonding LUMO (Lowest Unoccupied Molecular Orbital) we need to look at the NBO summary in the log file, shown below.
Natural Bond Orbitals (Summary):
                                                           Principal Delocalizations
          NBO                        Occupancy    Energy   (geminal,vicinal,remote)
====================================================================================
Molecular unit  1  (H3B)
    1. BD (   1) B   1 - H   2          1.99851    -0.43697
    2. BD (   1) B   1 - H   3          1.99851    -0.43697
    3. BD (   1) B   1 - H   4          1.99851    -0.43697
    4. CR (   1) B   1                  1.99904    -6.64515  10(v),11(v),12(v)
    5. LP*(   1) B   1                  0.00000     0.67699
    6. RY*(   1) B   1                  0.00000     0.37185
    7. RY*(   2) B   1                  0.00000     0.37185
    8. RY*(   3) B   1                  0.00000    -0.04544
    9. RY*(   4) B   1                  0.00000     0.43447
   10. RY*(   1) H   2                  0.00032     0.90032
   11. RY*(   1) H   3                  0.00032     0.90032
   12. RY*(   1) H   4                  0.00032     0.90032
   13. BD*(   1) B   1 - H   2          0.00149     0.41092
   14. BD*(   1) B   1 - H   3          0.00149     0.41092
   15. BD*(   1) B   1 - H   4          0.00149     0.41092
The non-bonding orbital is shown in bold. This orbital has an occupancy of zero, and yet has a negative energy. The first three entries in this table show the B-H bonding molecular orbitals. The fourth shows the 1s orbital of the boron atom.
The non-bonding orbital shown here is a p-orbital. In order to find out which p-orbital this is (px, py, or pz) the following section of the log file must be viewed.
NATURAL POPULATIONS:  Natural atomic orbital occupancies

  NAO  Atom  No  lang   Type(AO)    Occupancy      Energy
----------------------------------------------------------
    1    B    1  S      Cor( 1S)     1.99904      -6.64514
    2    B    1  S      Val( 2S)     0.96674      -0.09710
    3    B    1  S      Ryd( 3S)     0.00000       0.67699
    4    B    1  px     Val( 2p)     0.85148       0.09559
    5    B    1  px     Ryd( 3p)     0.00000       0.37185
    6    B    1  py     Val( 2p)     0.85148       0.09559
    7    B    1  py     Ryd( 3p)     0.00000       0.37185
    8    B    1  pz     Val( 2p)     0.00000      -0.04544
    9    B    1  pz     Ryd( 3p)     0.00000       0.43447
   10    H    2  S      Val( 1S)     1.11010      -0.05740
   11    H    2  S      Ryd( 2S)     0.00032       0.90031
   12    H    3  S      Val( 1S)     1.11010      -0.05740
   13    H    3  S      Ryd( 2S)     0.00032       0.90031
   14    H    4  S      Val( 1S)     1.11010      -0.05740
   15    H    4  S      Ryd( 2S)     0.00032       0.90031
This table shows the occupancy, and atomic orbital types for the molecule. The line in bold shows that the non-bonding p-orbital is a pz orbital. This can be said because the occupancy here is shown to be zero, and the energy shown for this orbital is the same as in the previous table, -0.045 a.u. The occupancy of the other p orbitals, px and py show that these orbitals are partially occupied, as they are involved in bonding.
Second Order Perturbation Theory Analysis of Fock Matrix in NBO Basis

    Threshold for printing:   0.50 kcal/mol
                                                                             E(2)  E(j)-E(i) F(i,j)
        Donor NBO (i)                     Acceptor NBO (j)                 kcal/mol   a.u.    a.u.
===================================================================================================

within unit  1
  4. CR (   1) B   1                / 10. RY*(   1) H   2                    1.51    7.55    0.095
  4. CR (   1) B   1                / 11. RY*(   1) H   3                    1.51    7.55    0.095
  4. CR (   1) B   1                / 12. RY*(   1) H   4                    1.51    7.55    0.095
This section of the log file is used to show mixing of the molecular orbitals. However, for the BH3 molecule, it is evident that there is not much mixing. This is shown by the figures in the E(2) column. In this case, the energies are much lower than the 20kcal/mol threshold. This section of the log file can be of greater use for molecules where mixing does occur.
Vibrational Analysis of BH3
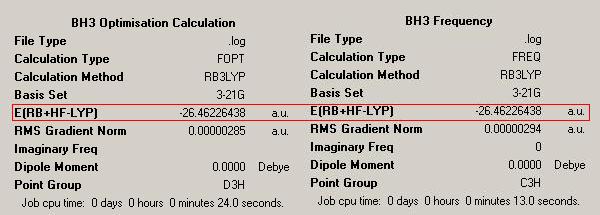
The previously optimised BH3 molecule was used to perform a vibrational analysis. A calculation was run in order to calculate the vibrational frequencies of the molecule. When carrying out these calculations, it is important to note that the geometry of the optimised structure before calculation and the structure of the molecule after calculation are the same. This can be seen by looking at the energies of the two structures. The results summaries for the optimisation and vibrational frequency calculation of BH3 are shown below.
The summaries show that the energies are the same. This indicates that both molecules have the same structure.
The output file for the vibrational frequency calculation can be found here: https://www.ch.ic.ac.uk/wiki/images/f/f3/RB_BH3_FREQ1.LOG
Within this log file, two following information can be found.
Low frequencies ---   -0.6560   -0.0171   -0.0021   20.1987   21.4875   21.4975
Low frequencies --- 1145.7148 1204.6589 1204.6599
Diagonal vibrational polarizability:
       0.6041804       0.6041102       1.9004460
Harmonic frequencies (cm**-1), IR intensities (KM/Mole), Raman scattering
activities (A**4/AMU), depolarization ratios for plane and unpolarized
incident light, reduced masses (AMU), force constants (mDyne/A),
and normal coordinates:
                    1                      2                      3
                   A"                     E'                     E'
Frequencies --  1145.7148              1204.6589              1204.6599
Red. masses --     1.2531                 1.1085                 1.1085
Frc consts  --     0.9691                 0.9478                 0.9478
IR Inten    --    92.6991                12.3789                12.3814
Atom AN      X      Y      Z        X      Y      Z        X      Y      Z
  1   5     0.00   0.00   0.16     0.00   0.10   0.00    -0.10   0.00   0.00
  2   1     0.00   0.00  -0.57     0.00   0.08   0.00     0.81   0.00   0.00
  3   1     0.00   0.00  -0.57    -0.38  -0.59   0.00     0.14   0.38   0.00
  4   1     0.00   0.00  -0.57     0.38  -0.59   0.00     0.14  -0.38   0.00
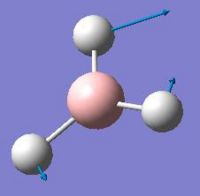
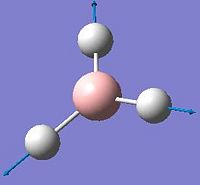
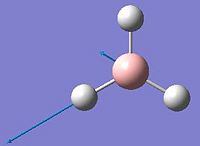
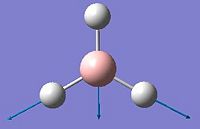
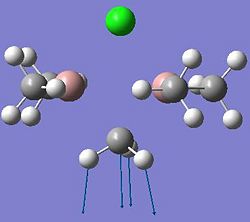
This part of the file is used by Gaussview when animating vibrational frequencies. The line in bold type shows the low frequencies. These values show the centre of mass motion. The first vibrational frequency listed is 1146cm-1 this is much larger than any of the low frequencies, showing that the calculation looks reasonably correct. These low frequencies would ideally be as close to zero as possible. However, for these calculations we are not using methods with very high accuracy, and this is indicated by these low frequency values being slightly high.
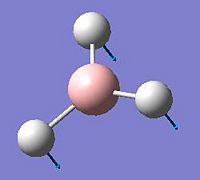
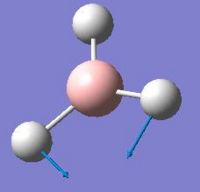
The vibrational frequencies of the molecule were animated in Gaussview. The results are summarised in the following table.
Infra-Red Spectrum of BH3
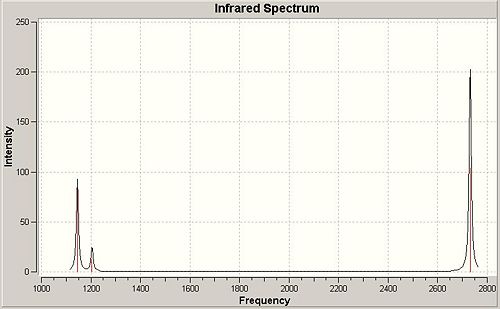
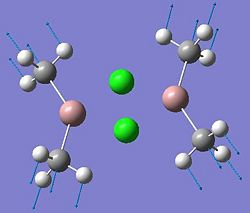
This infra-red spectrum of the molecule only shows 3 peaks, even though there are six vibration modes shown above. This is due to the symmetry of the motion of the different stretches. There are two degenerate (E') stretches, where two different motions have the same symmetry, and the same vibrational frequency, so only one peak appears for each pair of degenerate vibrations. Also, the A' vibrational mode is reported with an intensity of zero, so this peak will not appear in the spectrum. So the three peaks shown are the A", and two E', one peak for each degenerate pair.
Modelling BCl3
Creating and Optimising BCl3
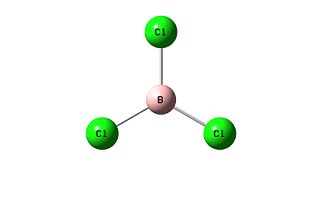
A molecule of BCl3 was drawn in Gaussview. The symmetry of the molecule was set by choosing the point group D3h and setting the tolerance to very tight (0.0001). The point group of the ground state molecule is D3h. This can be obtained from perfoming different symmetry operations on the molecule, and observing the result. This molecule has 2C3 axes, 3C2 axes, 1σh plane, 2S3 axes, and 3σv planes. These are the symmetry elements which define the D3h point group. Gaussview uses the same symmetry as this. In this case, the point group was set to restrict the geometry of the molecule, in order to make the optimisation calculation quicker.
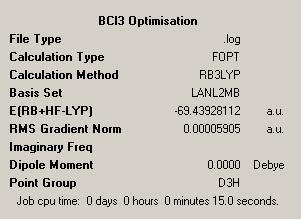
The B3LYP method was used to optimise the molecule, using the LANL2mb basis set. The optimised molecule and results summary obtained from the optimisation are shown below. The log file can be found here: https://www.ch.ic.ac.uk/wiki/images/1/1a/RACHAEL_BCL3_OPT.LOG
The B-Cl bond length after optimisation is 1.87Å, and the Cl-B-Cl bond angles are 120.0o. The literature value for a B-Cl bond distance is 1.75Å[2]. Compared to the literature, the optimised bond length of the B-Cl bond is quite inaccurate, but this is expected, because the basis set we are using for calculations is not that accurate. So the optimised bond length in the results is an approximation. The Cl-B-Cl bond angles are expected to be 120.0o due to the trigonal planar geometry of the molecule[3].
Vibrational Analysis of BCl3
The previously optimised structure of BCl3 will be used to perform vibrational analysis on the molecule. The purpose of this is to ascertain that the optimised structure of the molecule is, in fact, a minimum energy. The optimisation will cease when the first derivative of the slope of the potential energy curve becomes zero, or very close to zero. However, this zero gradient region of the potential energy curve may not be a minimum. In order to calculate whether the optimised energy is a minimum energy structure, the second derivative of the potential energy curve must be considered.
Following a frequency analysis of a molecule, if all the frequencies are positive, this indicates that the second derivative is positive, showing that a minimum was reached in the optimisation. So, the frequency analysis can be used to show whether an optimisation was successful or not. If one of the frequencies is negative, this indicates a maximum, or transition state. If more than one frequency is negative, this shows that the optimisation failed.
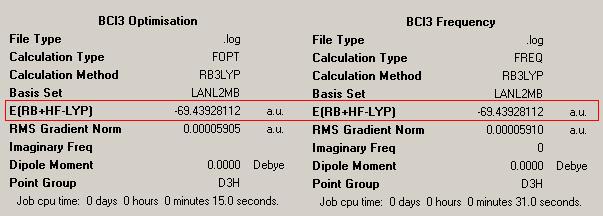
In order to carry out a frequency analysis on the optimised BCl3 molecule, a DFT-B3LYP method was used and a LanL2MB basis set. These are chosen because this method and basis set was used in the optimisation. It is important to use the same method and basis set because these determine the accuracy of the calculation; the energy is dependent on the method and basis set. If a different basis set was used, the resulting energy could not be compared to the optimised energy, because the accuracy would be different, so this would not be a valid comparison. The results summary is shown below on the right. The log file for the vibrational analysis can be found here: https://www.ch.ic.ac.uk/wiki/images/d/d6/RACHAEL_BCL3_FREQ.LOG
The box in red shows that both molecules have the same energy, which shows that they both have the same structure. Also, the summary shows that this calculation took 31.0 seconds to complete. This is a slightly longer calculation time than for the BH3 molecule because this calculation was using a more accurate basis set.
| Frequency (cm-1) | Intensity | Symmetry D3h point group |
|---|---|---|
| 214 | 4 | E' |
| 214 | 4 | E' |
| 377 | 44 | A2" |
| 417 | 0 | A1' |
| 939 | 259 | E' |
| 939 | 259 | E' |
All these frequencies are positive, which shows that the optimised structure of the molecule is a minimum energy structure, and so the optimisation was successful.
Discussion on Bonding
Sometimes when using the Gaussview program, bonds do not appear between atoms. This does not necessarily mean that there is not a bond there. Gaussview has pre-set parameters defining bond length, if the atoms in a molecule are further apart than this, then no bond will appear in between the atoms. This parameter can be changed, and set to larger bond lengths if a molecule being studied is expected to have longer bonds. These parameters are set for studying organic compounds, which mostly have bond distances shorter than inorganic compounds, so bonds are not always drawn in for inorganic compounds.
Chemical bonding can be defined in many ways. Bonding could simply be defined according to VSEPR (Valence Shell Electron Pair Repulsion) theory, which views a bond as two electrons between the nuclei of two atoms. This approximate definition is only valid for certain molecules. For example, borane structures tend to exhibit three-centre-two-electron bonds, which involve bridging hydrogen atoms between two boron atoms. These bonding types cannot be described by this simple theory. A more advanced description is achieved by considering the overlap of atomic orbitals which combine to produce bonding (constructive overlap of wavefunctions), and anti-bonding (destructive overlap of wavefunctions) molecular orbitals. This is the LCAO approach, seen above when analysing the molecular orbitals of BH3. This orbital theory is based on the probability of finding an electron some distance from the nucleus. Density Functional Theory, used in these computational methods, describes bonding in terms of the probability of finding electron density between atoms. This approach is much more versatile, and can be applied to a wide range of bonding situations.
Modelling Isomers of Mo(CO)4L2
A practical experiment has already been completed in the second year synthetic lab course to synthesise the cis and trans isomers of Mo(CO)4(PPh3)2. For this experiment, the Ph groups have been replaced by chlorine atoms. This is to reduce the demand on computing power, as phenyl rings are very large substituents. Chlorine has been chosen because the chlorine atoms have similar bonding characteristics compared to phenyl groups, and are less computationally demanding.
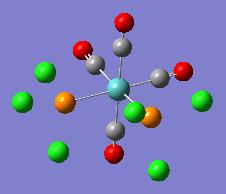
Creating and Optimising Cis- and Trans-Mo(CO)4(PCl3)2
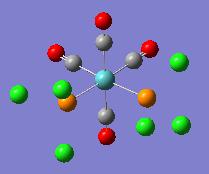
To begin both cis and trans isomers of the complex were drawn in Gaussview. In order to optimise these structures, a DFT-B3LYP method was used with a LanL2MB basis set. This first optimisation was to get an approximate geometry for the two complexes.
| Isomer | Trans | Cis |
| Results Summary | 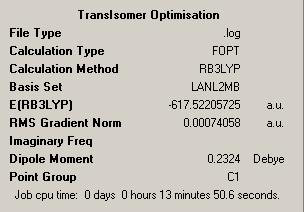 |
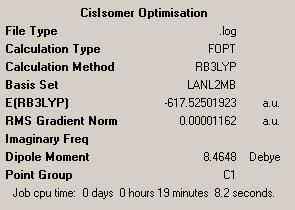
|
| Log File | DOI:10042/to-4395 | DOI:10042/to-4397 |
| Optimised Structure | 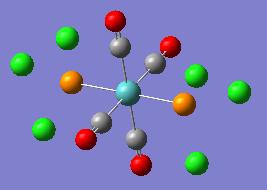 |
|
| Rotatable Structures |
|
|
By looking at the results files, it can be seen that both optimisations have been successful, by looking at this section:
      Item               Value     Threshold  Converged?
Maximum Force            0.001970     0.002500     YES
RMS     Force            0.000385     0.001667     YES
Maximum Displacement     0.005549     0.010000     YES
RMS     Displacement     0.001387     0.006667     YES
Predicted change in Energy=-2.853388D-06
Optimization completed.
   -- Stationary point found.
It can be seen in the rotatable structures and in the diagrams of the optimised molecules above that the P-Cl bonds have not been drawn in by Gaussview. This has been discussed above. Gaussview will not draw bonds in when the bond length between the two atoms exceeds a pre-defined value. This does not mean that there are no bonds between the chlorine and phosphorus atoms.
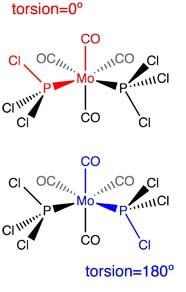
This first optimisation was for the purpose of obtaining the rough geometry of the complexes. In order to optimise the complexes further, the structures were manually altered to fit the following diagrams.
| Cis Isomer | Trans Isomer |
|---|---|
 [4] [4] |
 [4] [4]
|
| One chlorine atom of the PCl3 group points upwards, parallel to the axial P-CO bond. A Cl atom of the other PCl3 group points downwards, also parallel to the axial bond | Both PCl3 groups now eclipse each other, and one chlorine of each PCl3 group is parallel with the axial bond |
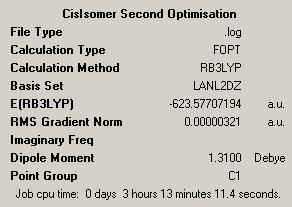
These altered structures were then saved as input files, and optimised again using a DFT-B3LYP method and a LanL2DZ basis set. The LanL2DZ basis set and pseudo-potential is much better than the LanL2MB option.
| Isomer | Trans | Cis |
| Results Summary | 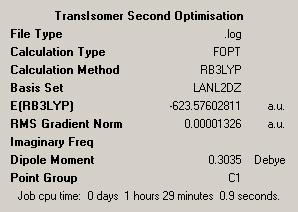 |
|
| Log File | DOI:10042/to-4398 | DOI:10042/to-4399 |
| Optimised Structure | 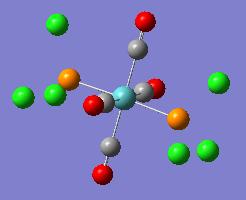 |
|
| Rotatable Structures |
|
|
It can be seen from looking at the log files for both isomers that both the optimisations have converged. In order to check whether the optimisations have found a minimum, a vibrational analysis must be carried out for the optimised molecules.
Vibrational Analysis of Cis- and Trans-Mo(CO)4(PCl3)2
The vibrational analysis of both isomers was carried out using a DFT-B3LYP method and a LanL2DZ basis set. These are chosen because they are the same method and basis set used for the optimisation of the molecules above. After the completion of the frequency calculations, the sections in both log files were found which showed the low frequencies, shown below.
Trans Isomer Log file: DOI:10042/to-4400
Low frequencies ---   -3.7260   -2.3570   -1.0461   -0.0007   -0.0006   -0.0003
Low frequencies ---    4.2584    5.7474   37.3660
Diagonal vibrational polarizability:
     150.5213108     103.3150385     421.6666434
Harmonic frequencies (cm**-1), IR intensities (KM/Mole), Raman scattering
activities (A**4/AMU), depolarization ratios for plane and unpolarized
incident light, reduced masses (AMU), force constants (mDyne/A),
and normal coordinates:
                    1                      2                      3
                    A                      A                      A
Frequencies --     2.4881                 5.6033                37.3660
Red. masses --    21.7894                34.6728                26.9918
Frc consts  --     0.0001                 0.0006                 0.0222
IR Inten    --     0.0951                 0.0001                 0.4148
Cis Isomer Log file: DOI:10042/to-4401
Low frequencies ---   -1.7774   -0.0001    0.0003    0.0006    1.0320    1.4451
Low frequencies ---   10.7646   17.5896   42.0419
Diagonal vibrational polarizability:
     100.4500449      70.2421002      53.2732388
Harmonic frequencies (cm**-1), IR intensities (KM/Mole), Raman scattering
activities (A**4/AMU), depolarization ratios for plane and unpolarized
incident light, reduced masses (AMU), force constants (mDyne/A),
and normal coordinates:
                    1                      2                      3
                    A                      A                      A
Frequencies --    10.7482                17.5896                42.0419
Red. masses --    29.7737                32.3092                19.3521
Frc consts  --     0.0020                 0.0059                 0.0202
IR Inten    --     0.0264                 0.0073                 0.0049
In both of these cases, the low frequencies are all higher than -5cm-1 and they are all close to zero. Also, all the vibrational frequencies for both isomers are found to be positive. This shows that minima have been reached in both cases, and that the optimisations have been successful.
Analysing Infra-red Spectra and Vibrational Fequencies of Cis- and Trans-Mo(CO)4(PCl3)2
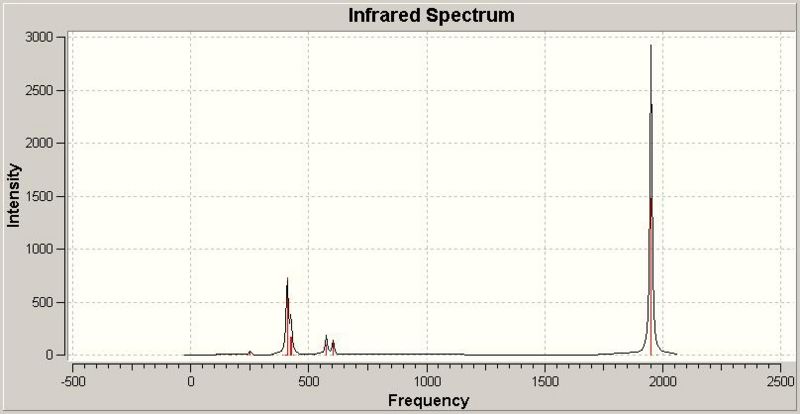
Gaussview can be used to show the predicted IR spectra for both the isomers from the results of the vibrational analysis calculation.
Trans Isomer Infra-red Spectrum
Carbonyl Stretching Frequencies
Note: to assign symmetry, L is viewed as a point ligand, so the symmetry of the PCl3 groups themselves are ignored.
| Frequency (cm-1) | Intensity | Diagram of motion | Symmetry D4h point group |
|---|---|---|---|
| 1950 | 1475 | 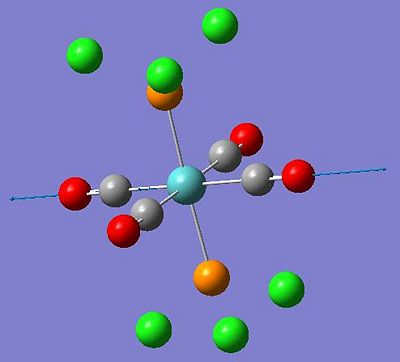 |
Eu |
| 1951 | 1467 | 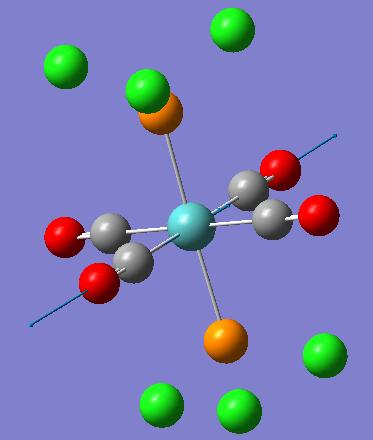 |
Eu |
| 1977 | 0(.6) | 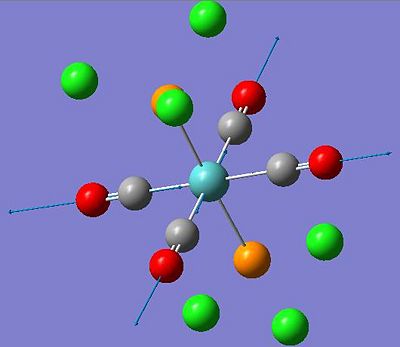 |
not IR active |
| 2031 | 3(.7) | 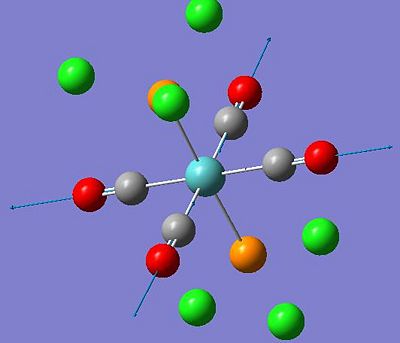 |
not IR active |
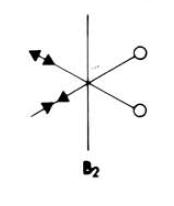
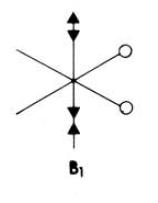
| Frequency (cm-1) | Intensity | Diagram of motion | Symmetry C2v point group |
|---|---|---|---|
| 1945 | 763 | 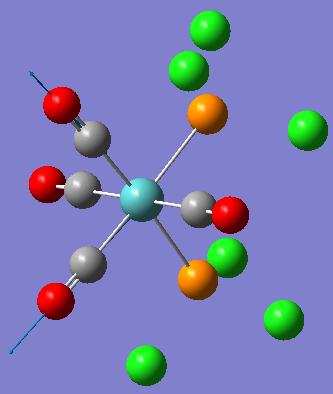 |
 [5] [5]
|
| 1949 | 1498 | 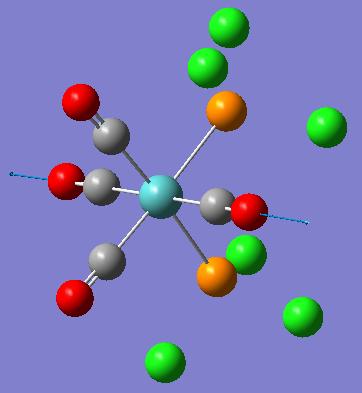 |
 [5] [5]
|
| 1958 | 632 | 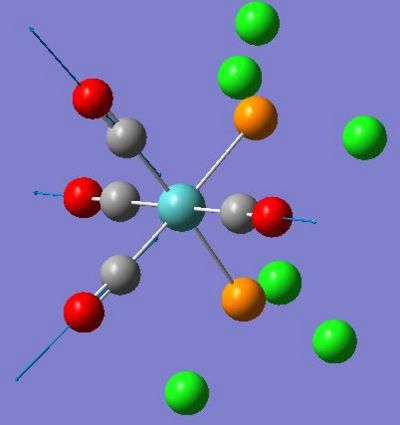 |
 [5] [5]
|
| 2023 | 598 | 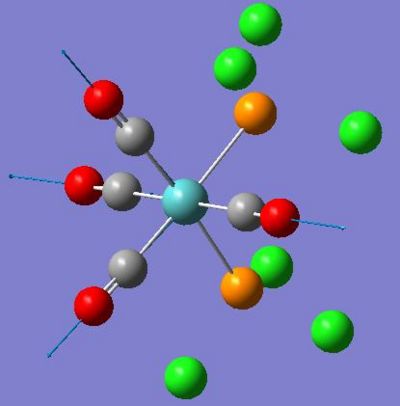 |
 [5] [5]
|
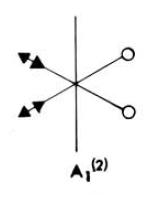
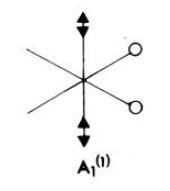
These computed stretching frequencies for the carbonyl groups show that the cis isomer has four, well defined vibrational frequencies for the carbonyl ligands. For the cis isomer, Γirreducible= 2A1 +B1 +B2. All of these modes are IR active, so four bands are expected. The A1 modes are totally symmetric stretches, the B1 and B2 modes have symmetry as shown in the diagrams. The IR spectrum does not show these four peaks very clearly, because they are reasonably close in frequency, but the intensities of the peaks show that they are all IR active, as they have quite high intensities.
On the other hand, the trans isomer has Γirreducible= A1g +B1g +Eu. The only IR active mode is Eu. This is a degenerate mode, so there are two stretches associated with this symmetry. There will only be one peak shown in the spectrum, however, due to the degeneracy, the stretches will have the same frequency. The calculated frequencies show this, they are not quite the same, but they are very similar. This is why there is only one peak appearing in the trans isomer IR spectrum corresponding to the C=O stretching frequencies, compared to the four bands seen for the cis isomer.
| Isomer | Frequencies (cm-1) |
|---|---|
| Trans | 1896 |
| Cis | 2022 (A(a)1), 1917 (B1), 1903 (A(b)1), 1882 (B2) |
These stretching frequencies from the literature compare reasonably well to the stretching frequencies computed for the Cis- and Trans-Mo(CO)4(PCl3)2. The symmetry assignment for the literature stretching frequencies for the cis complex come in a different order to the computed modes. However, the literature assignments were applied based on intensity arguments[6], because in a real molecule it is obviously impossible to see the stretches. In the computed model, the symmetry was assigned by animating the vibrations, and assigning the symmetry. The B1 mode for the literature vibrations was assigned because it was the most intense band observed. In the computed model also, the B1 mode has the highest intensity. The A(a)1 mode from the literature was assigned to the band with the highest frequency, it is also the case that the A(1)1 mode in the computed model has the highest frequency vibration. So, the analysis from the literature compares quite well to the observed computed model.
The differences between the literature and calculated results could be due to the literature values being measured while the complex is in diglyme, instead of the computed values, corresponding to the molecules in the gas phase. Also, the literature values are for a complex where L=PPh3, not PCl3. In addition to these differences, the computed values for the vibrational frequencies could be improved by using a more accurate method and basis set. By including more terms in the basis set we use, the more accurate our approximations will be, and therefore more accurate results are acheived. However, this extra accuracy involves longer calculation times.
Low Frequency Vibrations
It is important to note that the low frequency vibrations discussed here are not the "low frequencies" values shown in the log files above. The "low frequencies" above need to be as close to zero as possible. These are from the '-6' part of the 3N-6 equation. The frequencies discussed here are vibrations of the molecule which exhibit a notably low frequency. None of the vibrations calculated for either the cis or trans isomers were negative.
| Isomer | Frequency of vibration (cm-1) | Diagram of vibration |
|---|---|---|
| Trans | 2(.5) | 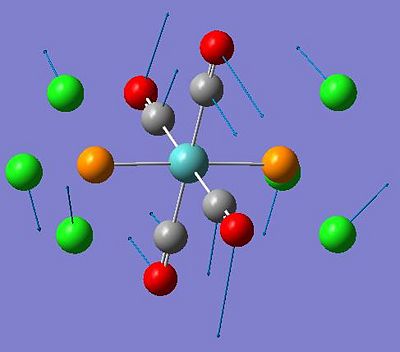
|
| Trans | 5(.6) | 
|
| Cis | 10(.7) | 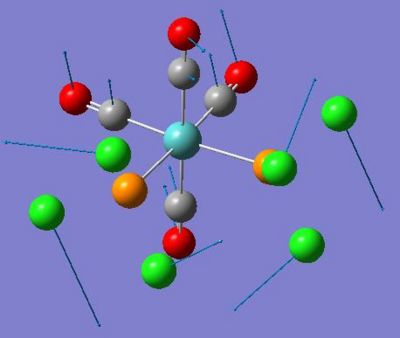
|
These vibrations have a very low frequency, or a very low energy. At room temperature, thermal energy available is around 0.013eV, or 2.08x10⁻²¹J.
So, using E = h x v x c ; where E= energy(J), h =6.626x10⁻³⁴J.s (Plank's constant), v=frequency (cm-1) and c=2.9979x1010 cm.s-1 (speed of light)
| Frequency (cm-1) | Thermal energy required (J) |
|---|---|
| 2.5 | 4.97x10⁻²³ |
| 5.6 | 1.11x10⁻²² |
| 10.7 | 2.13x10⁻²² |
This shows that all these low frequency vibrations would occur very quickly at room temperature, as there is enough thermal energy available to cause the vibrations in the molecules.
Comparing Geometries of Optimised Cis- and Trans-Mo(CO)4(PCl3)2
After optimisation of the molecules, and checking that a minima has been reached by vibrational analysis, their geometries can be compared to each other, and to literature values.
| Cis Isomer | First optimisation | Second optimisation | Literature Values[7] (L=PPh2NHPh) |
|---|---|---|---|
| Mo-P bond length (Å) | 2.53 | 2.51 | 2.54 |
| P-Mo-P angle (o) | 95.6 | 94.2 | 95.4 |
| Mo-C bond length (Å) | 2.06 | 2.01 | 2.04 |
| C-Mo-C angle (o) | 89.4, 87.2, 89.4, 89.4 | 87.1, 89.1, 89.7, 89.1 | 86.4-91.9 |
| Trans Isomer | First optimisation | Second optimisation | Literature Values[8] (L=PPh3) |
| Mo-P bond length (Å) | 2.48 | 2.44 | 2.50 |
| P-Mo-P angle (o) | 179.0 | 177.4 | 180.0 |
| Mo-C bond length (Å) | 2.11 | 2.06 | 2.01 |
| C-Mo-C angle (o) | 90.0, 89.9, 90.0, 90.1 | 90.4, 90.6, 89.6, 89.4 | 92.1 |
These results show that the computed values for the bond lengths and angles compare quite well to the literature values. The literature values cannot be used as a direct comparison for the exact values of bond lengths and angles, as the phosphine ligands of both literature compounds are different to the computed complexes. However, the literature values are useful for showing that the bond lengths and angles shown here are similar, and that the optimised structures of the molecules are therefore reasonable.
Regarding the trans isomer of the molybdenum complex, the literature values are very similar to the computed values. The differences between the two, for example the P-Mo bond length which is longer for the literature complex could be due to the increased steric bulk of the phenyl substituents of the phosphine, compared to the less sterically demanding chlorine atoms of the modelled complex.
Comparing the two computed complexes, the cis isomer shows longer Mo-P bonds than the trans isomer. This could be due to the proximity of the PCl3 groups in the cis isomer, a slightly longer bond length will move the phosphine groups further apart.
Relative Energies of Cis- and Trans-Mo(CO)4(PCl3)2
Note: 1 a.u. (or Hartree) =2625.5kJ/mol. Also, energy in kJ/mol has been shown to so many decimal places to show the difference between the two values.
| Energy | Trans | Cis | Difference in Energy |
|---|---|---|---|
| Unit: a.u. | -623.576 | -623.577 | 0.001 |
| Unit: kJ/mol | -1.637198 x10⁶ | -1.637201 x10⁶ | 2.63 |
| Isomer | Energy (a.u.) | Ecis-Etrans (a.u.) | Ecis-Etrans (kj/mol) |
|---|---|---|---|
| Cis | -1923.05810468 | ||
| Trans | -1923.03030751 | -0.02779717 | -72.98 |
The computed values show that the energies of the cis and trans complexes are very close in energy, and so similar in stability. The cis isomer is slightly more stable than the trans isomer. The energies are negative, so the more stable of the two, the cis isomer, has the more negative energy. Also, the values taken from the literature show that the cis isomer of a similar complex is the more stable of the two isomers. The literature values show that the cis isomer is more stable than the trans isomer by 72.98kJ/mol, compared to only 2.63kJ/mol from the computed values.
Intuitively, one might think that the trans isomer would be more stable due to steric effects, the large phosphine ligands are further apart (therefore minimising steric repulsion between the two bulky substituents) in the trans complex compared to the cis. However, these results show that this is not the case. Clearly, steric effects are not the most important effect here. Electronic stabilising effects are dominant over steric stabilisation.[9]
By considering the bonding situation in the complex, this can be explained. The carbonyl and phosphine ligands both form synergic bonds to the molybdenum; both types of ligand form σ-bonds by donating electrons to the metal, and the metal also donates electron density from the metal d-orbital into the π*-orbitals of the ligands. These back-bonding interactions stabilise the complex as a whole. So it is reasonable to assume that there are stronger back-bonding interactions in the cis complex. This is due to the differing alignment of the phosphine and carbonyl ligands. In the cis complex, the arrangement of the phosphine ligands reduces the symmetry of the complex, compared to the trans complex. This allows increased back-bonding from the metal d-orbitals to the π*P-Cl orbital.[10] In the trans complex, the phosphine ligands are arranged opposite each other, so they are competing for back-bonding with the metal d-orbital, slightly reducing the back-bonding interactions relative to the cis complex.
So in order to stabilise the cis complex further, the phosphine substituents could be altered to have more electron donating groups attached to them, for example, P(OMe)3, or PCy3 could be used to replace the PCl3 groups. By increasing the electron donating ability of the ligands, the extra electron density on the metal will subsequently increase back-bonding to the carbonyl ligands. Backbonding to the phosphine ligand will be reduced however, because the better σ-donating a phosphine ligand is, the worse the π-accepting nature becomes.[10] The increased back-bonding to the carbonyl ligands would be shown by a reduction in the C=O stretching frequencies for the altered complex.
The relative stabilities of the two isomers could be reversed by trying to change whether steric or electronic effects were more important. So, if an extremely bulky ligand was used, then the steric repulsion caused by the ligands being in close proximity to each other in the cis complex would become so great that it would override the electronic effects. This would cause the trans complex to be relatively more stable than the cis complex. Examples of bulky ligands might be PtBu3 or P(o-Tol)3.
Mini-Project: Investigating Ga2Me4Cl2 and Related Dimers
This project will investigate the structure and bonding characteristics of several dimers: Ga2Me4Cl2, Ga2Me5Cl, Ga2Me6, Ga2Me4Br2,In2Me4Cl2, In2Me5Cl, In2Me6, In2Me4Br2. These dimers were chosen to investigate different effects. The Ga2Me4Cl2 dimer (dimer a) can be modified to include more Me groups (dimers b and c), to see what effect this has on the structure. Also, from the same group in the periodic table, dimers e,f, g and h contain Indium instead of Gallium to compare any trends seen in the gallium dimers. By replacing the chlorine with bromine atoms (dimers d and h), it can be seen how the halide affects the dimer.
Creating and Optimising Dimers
All dimers were drawn first in Gaussview, and optimised using a B3LYP method and a LanL2MB basis set. This first optimisation was purely to obtain a rough geometry for the dimers. All the output files for these were checked to see if they contained this section:
       Item               Value     Threshold  Converged?
Maximum Force            0.000015     0.002500     YES
RMS     Force            0.000006     0.001667     YES
Maximum Displacement     0.001003     0.010000     YES
RMS     Displacement     0.000313     0.006667     YES
Predicted change in Energy=-1.657743D-08
Optimization completed.
   -- Stationary point found.
This section shows that the optimisation has converged, and that a stationary point has been reached. In order to produce a better result from the optimisation, all the structures were further optimised using a B3LYP method and a LanL2MDZ basis set. This basis set was chosen because it is more accurate than the LanL2MB basis set. Both the LanL2MB and LanL2DZ basis sets were used to handle the heavy metals involved in these dimers. The results from this second optimisation are shown below. The log files for the first optimisations are included in the table.
| Dimer | Diagram | Rotatable Structure | Log File | Results Summary |
|---|---|---|---|---|
| Ga2Me4Cl2 (dimer a) | 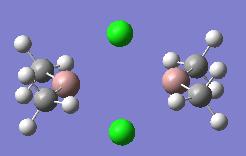 |
|
First Optimisation: DOI:10042/to-4438 Second Optimisation DOI:10042/to-4445 | 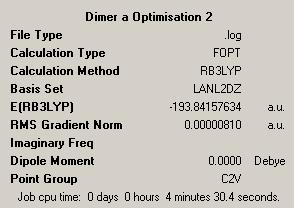
|
| Ga2Me5Cl (dimer b) |  |
|
First Optimisation: DOI:10042/to-4458 Second Optimisation: DOI:10042/to-4462 | 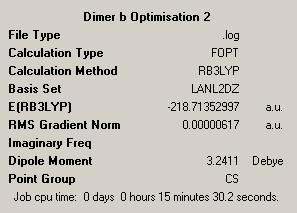
|
| Ga2Me6 (dimer c) | 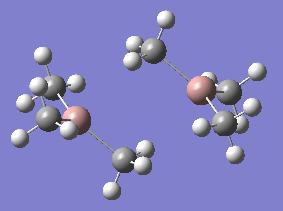 |
|
First Optimisation: DOI:10042/to-4452 Second Optimisation: DOI:10042/to-4460 | 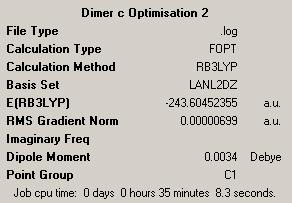
|
| Ga2Me4Br2 (dimer d) | 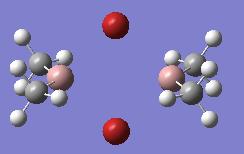 |
|
First Optimisation: DOI:10042/to-4441 Second Optimisation: DOI:10042/to-4447 | 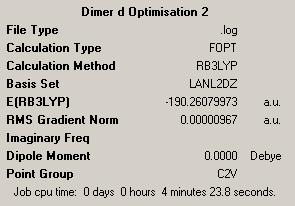
|
| In2Me4Cl2 (dimer e) | 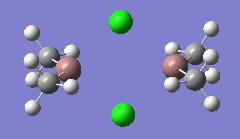 |
|
First Optimisation: DOI:10042/to-4442 Second Optimisation: DOI:10042/to-4446 | 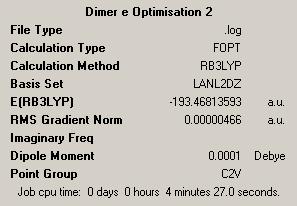
|
| In2Me5Cl (dimer f) | 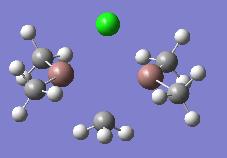 |
|
First Optimisation: DOI:10042/to-4451 Second Optimisation: DOI:/10042/to-4459 | 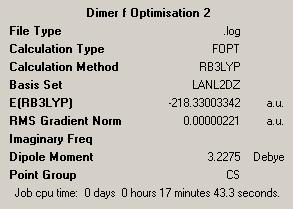
|
| In2Me6 (dimer g) | 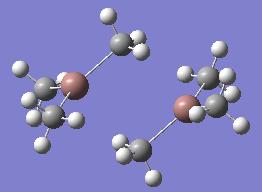 |
|
First Optimisation: DOI:10042/to-4453 Second Optimisation: DOI:10042/to-4461 | 
|
| In2Me4Br2 (dimer h) | 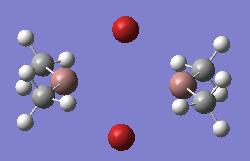 |
|
First Optimisation: DOI:10042/to-4448 Second Optimisation: DOI:10042/to-4449 | 
|
It can be seen in most of the diagrams above, that the bridging bonds are not shown between the atoms. This is because Gaussview will only show bonds according to pre-defined parameters. The bridging bonds are longer than normal bonds, so are not shown in the diagrams. This does not mean there is no bond between the atoms.
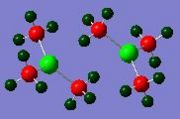
The optimisations for dimers c and g show that the dimer seems to have reverted to a more monomeric state. This could be due to the methyl groups being a poor bridging group compared to the chlorine, or bromine atoms. This will be investigated further later in this project.
Frequency Analysis of Optimised Dimers
It is important to carry out frequency analysis of optimised structures, so that one can be sure that a minimum has been reached. Frequency analysis was done for all the optimised dimer structures, using a B3LYP method and LanL2dz basis set. These were chosen because they were used to optimise the molecules. When viewing a log file from these calculations, we are looking for any negative frequencies. If all the frequencies are positive, then the optimisation was successful and a minimum was reached. If there is one positive frequency, then a transition state has been found, as this indicates a maximum on the potential energy curve. If more than one frequency is negative, the optimisation was not successful. Also, the low frequencies must be investigated. It is important that these 6 frequencies are as close to zero as possible. In addition to this, the energy of the molecule after the frequency analysis should be the same as the energy for the optimised structure, to make sure that the frequency analysis was calculated using the same structure for the molecule. The energies can be compared as long as the same method and basis set are used for the optimisation and the vibrational analysis.
The following section of a vibrational analysis log file has been taken from the log file of dimer a, to show the low frequency values.
Low frequencies ---    0.0003    0.0003    0.0005    1.8858    3.4588    7.7110
Low frequencies ---   26.3114   69.6987   76.2550
Diagonal vibrational polarizability:
      34.8382989     106.2313172      85.5515628
Harmonic frequencies (cm**-1), IR intensities (KM/Mole), Raman scattering
activities (A**4/AMU), depolarization ratios for plane and unpolarized
incident light, reduced masses (AMU), force constants (mDyne/A),
and normal coordinates:
                    1                      2                      3
                   A1                     A2                     B1
Frequencies --    26.3114                69.6987                76.2540
Red. masses --     4.2572                 1.4828                 1.1233
Frc consts  --     0.0017                 0.0042                 0.0038
IR Inten    --     1.4709                 0.0000                 0.0000
These low frequencies are very good, all of them are positive, and reasonably close to zero. The highest, 7.711cm-1 is quite high, but still lower than 10cm-1, so this is still acceptable. All the log files for the dimers, except dimer a, showed some negative low frequencies, this is due to numerical difficulties. For dimers b, c, d, e, f, and h these negative low frequencies were all higher than -5cm-1. The only low frequency lower than -5cm-1 was found for dimer g, which had one low frequency value of -5.6466cm-1. However, this is quite close to -5, and all the other low frequencies were: -2.3103, -1.9073, -0.0004, 0.0000, and 0.0003cm-1. These are all quite close to zero, so the calculation can be viewed as valid. Apart from the low frequency values, all other vibrational frequencies were positive. This shows that all the optimisations of the dimers were sucessful.
The ouput files for the frequency analysis for all the dimers can be found here:
| Dimer | Frequency Analysis Log File | Dimer | Frequency Analysis Log File |
|---|---|---|---|
| Dimer a | DOI:10042/to-4454 | Dimer b | DOI:10042/to-4466 |
| Dimer c | DOI:10042/to-4464 | Dimer d | DOI:10042/to-4455 |
| Dimer e | DOI:/10042/to-4456 | Dimer f | DOI:10042/to-4463 |
| Dimer g | DOI:10042/to-4465 | Dimer h | DOI:10042/to-4457 |
Comparing Geometries of Optimised Dimers
Having completed frequency analysis calculations for all the dimers, it was shown that the optimisations of their structures were successful in finding minima. Therefore these structures can now be used to look into the geometry of the dimers. Key bond lengths and angles were measured in the optimised structures. These are shown in the table below.
| Dimer | M-X distance (Å) | M-X-M angle (o) | M-M distance (Å) | M-Met distance (Å) | Met-M-Met angle (o) |
|---|---|---|---|---|---|
| Dimer a | 2.50 | 94.0 | 3.66 | 1.96 | 135.7 |
| Dimer b | 2.49 (X=CL); 2.23 (X=Me) | 75.2 (X=CL); 85.5 (X=Me) | 3.03 | 1.97 | 130.2 |
| Dimer c | 1.99, 3.38 | 95.8 | 4.09 | 1.98 | 120.3 |
| Dimer d | 2.68 | 91.2 | 3.83 | 1.96 | 135.5 |
| Dimer e | 2.65 | 96.4 | 3.95 | 2.12 | 139.9 |
| Dimer f | 2.64 (X=Cl); 2.42 (X=Me) | 78.4 (X=Cl); 87.4 (X=Me) | 3.34 | 2.13 | 134.3 |
| Dimer g | 2.17, 3.26 | 92.4 | 3.99 | 2.15 | 121.8 |
| Dimer h | 2.84 | 93.3 | 4.12 | 2.12 | 140.0 |
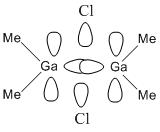
These results for the bond lengths and angles can be used to try and explain the bonding situation in these dimers, and to compare the different dimers to one and other. By looking at the results for dimer a, Ga2Me4Cl2, it can be seen that the bond between gallium and the terminal methyl group is much shorter than the bond to the bridging chlorine. This suggests that the bonding in these two situations are different. The terminal methyl groups bond to the gallium with a 2-centre-2-electron bond. In a monomer, GaMe2Cl, the gallium is electron deficient. A way of relieving this is for the chlorine atoms of two monomers to bridge between the two gallium centres and form a dimer. The bonds involved in this bridge are 3-centre-2-electron bonds. This type of bonding can be described by this simple diagram.
This diagram shows that the chlorine atoms coordinate to the gallium atom in the other monomer with the lone pair. These bridging bonds are longer than the terminal bonds, showing that bridging bonds are weaker than terminal bonds. A value for the bond length of the Ga-Cl bridging bond in a Ga2Cl2H4 dimer is 2.416Å.[11] This bond length is comparable to the computed Ga-Cl bridging bonds in monomers a and b. This shows that the computed bond lengths are reasonable. Also, the Cl-Ga-Cl literature bond angle is given as 92.0o[11], which is also close to the computed values for this bond angle.
The shorter, terminal Ga-C bond length can be compared to literature values for the bond lengths in a GaMe3 monomer which is 1.967+/-0.002Å.[12] It can be seen from the table that all the Ga-Met bond lengths in the dimers are very close to this value. This suggests that the Ga-C bond lengths are not substantially affected by dimerisation. However, what does change significantly is the C-Ga-C angle. In a GaMe3 monomer, the C-Ga-C angle is 118.6o.[12] This is much smaller angle compared to the measured values for the dimers. The same is seen for the indium dimers. When compared to a literature C-In-C bond angle (in InMe3 monomer) of 119.3o[13], the C-In-C angles for the dimers are much larger.
When compared to literature values of a Ga2Cl2H4 dimer, where the H-Ga-H bond angle (hydrogen atoms are terminal atoms, not bridging) was 132.9o[11], this angle is much closer to the values computed for the dimers, apart from dimer c. This shows that the computed angles for the dimers are reasonable.
The Ga-Ga distances measured for the dimers can also be compared to literature values, the Ga-Ga distance is typically 3.455Å[11], this is close to the distances computed for the dimers. Although this distance varies a lot between the dimers, the Ga-Ga distances show that the length is too long for a bonding interaction between the two metals, therefore, they must be held reasonably close together due to the bridging bonds between the two monomers.
It was noted from the diagrams of the optimised dimers that dimer c and g appeared to have a more monomeric structure, with very weak coordination between the two monomers. This can also be seen in the bond lengths and angles for dimer c and g. Dimer c has a C-Ga-C bond angle much closer to the literature value for a monomer, than for a dimer. This suggests that the methyl groups are very weak bridging groups. This can be explained by considering the bonding diagram included above. Chlorine, and bromine both have readily available lone pairs, and it can be seen in dimers a,d,e and h that the halides are good bridging groups, linking the two monomers. However, when looking at dimers c and g, it can be seen that one bridging bond length is more like a single bond length, (1.99Å-dimer c) and the other is much longer (3.38Å-dimer c). This suggests that each gallium atom is bonded to one methyl group, but isn't really bonded to the other. This is because the carbon atom in the methyl group does not have a readily available lone pair, and it is unfavourable to have a 5-coordinate carbon atom., therefore the methyl group is a poor bridging group.
Molecular Orbital Analysis
The HOMO and LUMO molecular orbitals will be shown for all the dimers, and the molecular orbitals of dimer a will be studied in more detail. The molecular orbitals for all the dimers were computed using the checkpoint files from the frequency analysis. The log files for these calculations can be found above.
HOMO and LUMO Molecular Orbitals for All Dimers
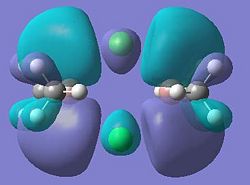
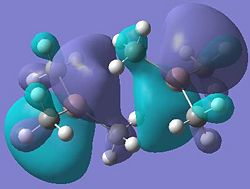
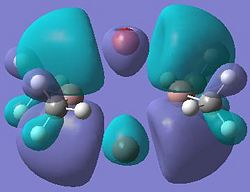
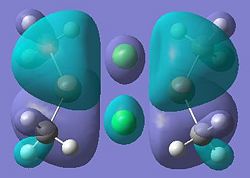
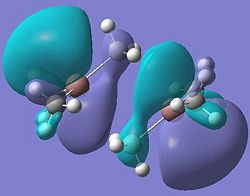
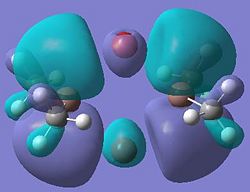
By obtaining diagrams for the HOMO and LUMO of all the dimers, the bonding in each can be compared with the others. The following table shows the computed molecular orbitals for dimers a-h.
| Dimer | Diagram of HOMO | Diagram of LUMO |
|---|---|---|
| Dimer a | 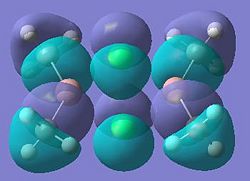 |
|
| Dimer b | 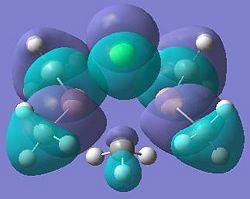 |

|
| Dimer c | 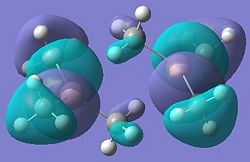 |
|
| Dimer d |  |
|
| Dimer e | 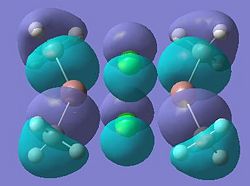 |
|
| Dimer f |  |
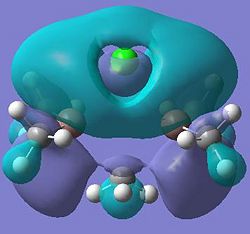
|
| Dimer g | 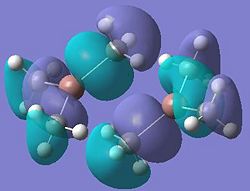 |
|
| Dimer h | 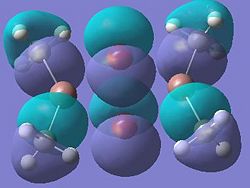 |
|
It can be seen from these molecular orbital results that for dimer a, and b the HOMO looks very similar around the chlorine bridge between the gallium atoms. However, this breaks down for the methyl bridge. The reduced electron density shown around the methyl group compared to the chlorine group confirms that the chlorine donates electron density much more readily than the methyl group, meaning that the chlorine atom is a much better bridging group between the gallium atoms. Dimer c shows this even more, the bonding picture here is even more monomeric. Very little electron density is seen linking the two monomers, instead the main bonding interactions are within the monomers, not bridging between the two. A very similar situation is seen for the dimers e,f and g compared to a,b and c. Dimer g, again shows a very monomeric bonding situation, compared to the dimers e and f where the chlorine bridges seem to have much stronger bonds than the methyl bridge in dimer f.
Comparing the bromine (dimer d and h) to the chlorine (dimers a and e) bridges, the orbitals look very similar, as is expected. The orbitals are slightly more diffuse for the dimers involving bromine, as would be expected for a larger atom. However, the molecular orbitals do show that there is considerable electron density between the bromine atoms and the gallium atoms, forming the bridging bonds, similar to the chlorine bridges. So it can be said that halides are very good bridging atoms because they donate their lone pair of electrons to the bridging bond easily, compared to a methyl bridging group which does not favour a 5-coordinate state, and prefers monomeric bonding instead.
Molecular Orbitals of Dimer a in More Detail
In order to obtain a more complete picture of the bonding situation in the dimers, the molecular orbitals of dimer a were investigated in more detail. The computed molecular orbitals are shown below.
| Molecular Orbital | Diagram | Molecular orbial | Diagram |
|---|---|---|---|
| 11 | 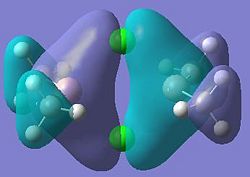 |
12 | 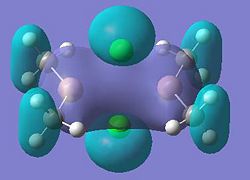
|
| 21 | 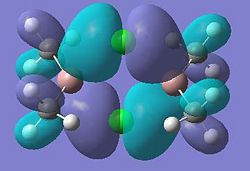 |
22 | 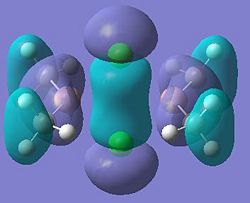
|
| 23 | 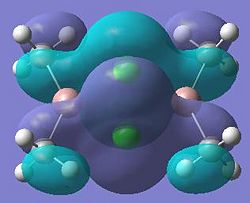 |
24 | 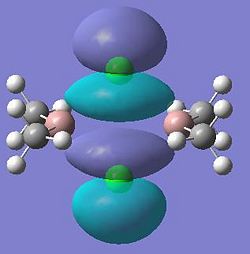
|
| 25 | 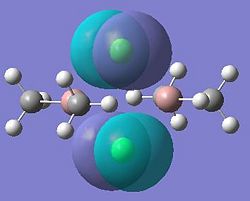 |
26 | 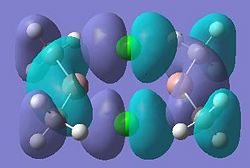
|
| 27 | 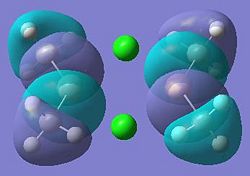 |
28 (HOMO) | 
|
| 29 (LUMO) |  |
30 | 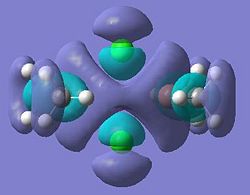
|
| 31 | 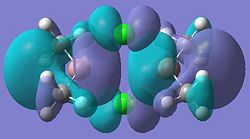 |
32 | 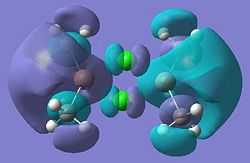
|
Looking at molecular orbitals 11 and 12 above, these show the main bonding interactions between the Ga and Cl bridging atoms. The molecular orbitals show electron density between the both Ga atoms, each bonding with both chlorine atoms. Molecular orbital 12 also shows electron density between the gallium atoms. The following diagram shows how this bonding might be described.
This diagram shows the empty p-orbitals of the gallium atom interacting with the p-orbitals of the bridging chlorine atoms, and a bonding interaction between the two gallium atoms.
Molecular orbitals 21 and 24 show bonding interactions across the bridges in the dimer. Molecular orbital 23 shows bonding in the plane of the molecule. The Cl p-orbitals can be seen in molecular orbital 25, also in 28, the HOMO, where Ga-Me bonding is also seen. Molecular orbitals 27 and 26 also show bonding interactions between the Ga and terminal Me groups. The LUMO, molecular orbital 29 shows anti-bonding interactions across the bridges in the dimer. As shown in previous sections of this module, above the LUMO, in the anti-bonding region, the molecular orbitals become more diffuse, this is seen for molecular orbitals 30, 31 and 32.
NBO (Natural Bond Orbital) Analysis
In addition to the molecular orbitals of the dimers, the NBO analysis can show where electron density is concentrated in the molecule, by looking at the relative charges on the atoms in the dimer. The results for all the dimers are shown below.
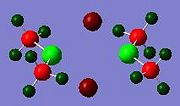
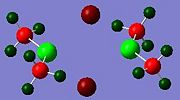
These results show that the gallium or indium metal atoms are always positively charged. This is because they are electron deficient, lewis acids. The gallium is more positive in dimer c, just as indium is more positively charged in dimer g. This could be due to the lack of electron density from bridging, compared to the other dimers. The methyl groups are poor bridging groups, so very little electron density is donated to the other metal centre of the other monomer, leading to more positive metal atoms in these two dimers. Relatively, the bromine atoms appear to donate the most electron density to the metal centre, as both dimer d and e have the lowest positive charge for Ga and In respectively. This could be due the the larger Br atom being able to donate its lone pair of electrons more easily due to increased nuclear shielding.
In the diagrams, the red represents electron rich areas, where green represents electron deficient areas. The metal atoms are all represented in green, and the halide bridging atoms are always red, this shows that the halide bridging atoms are electronrich, electronegative groups, whereas the metal centres are electron-deficient, electropositive atoms.
Vibrational Spectrum Analysis
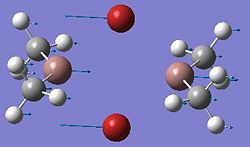
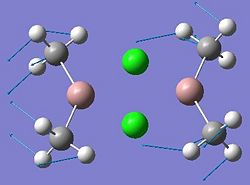
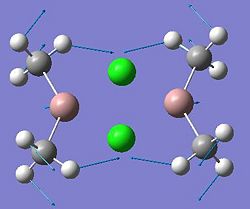
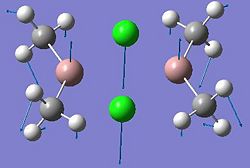
Using the checkpoint files from the frequency analysis (log files included above), the vibrational frequencies of the dimers can be shown. These different vibrations of the molecules can be animated to see which bonds are affected. The vibrational stretching frequencies can be used as a measure of bond strength in molecules. So, the stretching frequencies for the bridging bonds have been shown for all the dimers. Following this, the vibrational frequencies of dimer a will be investigated in more detail.
Vibrational Frequencies of Bridging Bonds for All Dimers
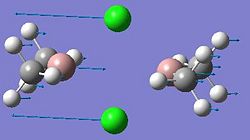
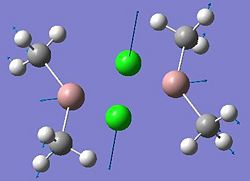
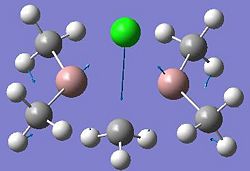
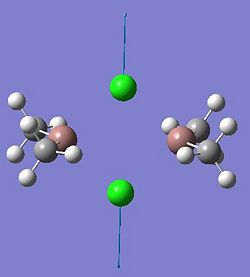
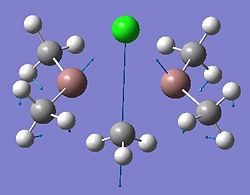
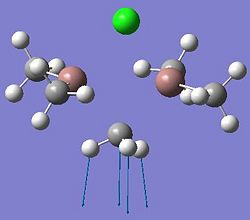
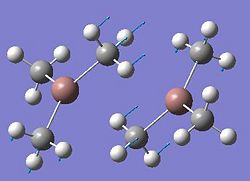
The table below shows the key stretches for the bridging bonds in all the dimers, and a diagram to show the displacement of the atoms during the vibration.
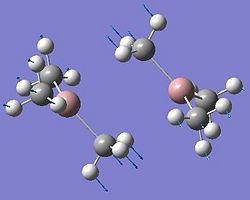
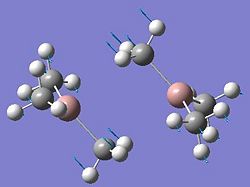
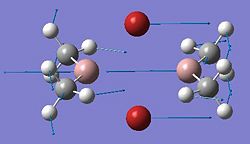
When looking at these results, the vibrational frequencies show how much energy is needed for that vibration to occur, as E=hű/c [where E=Energy (J), h= Planck's Constant (J.s), ũ = Frequency (cm-1), c= speed of light (cm/s)]. The more energy that is needed to cause a vibration of that bond, the stronger the bond. All these stretching frequencies show that an M-Me bond has a higher stretching frequency compared to an M-Cl,Br bond. This shows that the M-Me bonds are generally shorter, more like single bonds, compared to the longer bridging bonds between the metal and halide atom. The longer, weaker bridging bonds require less energy to cause a vibration than the M-Me bonds.
When looking at dimers b and c it can be seen that the stretching frequency for the Ga-Me bond for dimer b is much higher than the frequency for dimer c. This is due to the structures of these dimers. Dimer c has a more monomeric structure, so the Ga-Me bonds, where the Me groups are very weakly bridging between the two monomers, have more of a single bond nature than the Ga-Me bond in dimer b. The bridging Ga-Me bonds in dimer b are much longer than for dimer c. This is reflected in the stretching frequencies for the two dimers. The Ga-Me stretch for dimer c is a much higher frequency than the stretch in dimer b. This is due to the stronger bonds in dimer c due to the reduced bridging nature of the bonds. This same situation is seen for dimers f and g, for the same reasons.
When comparing dimers e and h, it can be seen that the stretching frequency for an In-Br bond is lower than for an In-Cl bond. This is due to the longer In-Br bonds, because bromine is a larger atom than chlorine, the In-Br bonds are longer, and slightly weaker, so the stretching frequency in reduced, as it requires less energy to cause a vibration in that bond. The same thing is seen for dimers a and d, where the Ga-Br bond has a higher stretching frequency compared to the Ga-Cl bond.
Also, when comparing the stretching frequency of the Ga-Cl bond in dimer a to the Ga-Cl bond in dimer b it can be seen that the frequency is higher for dimer b. This suggests that the bridging Ga-Cl bond is stronger in dimer b. This could be because the chlorine bridging bond is compensating for the poor bridging ability of the methyl group. The same effect is seen for dimers e and f.
Vibrational Frequencies of Dimer a in More Detail
In order to compare the stretching frequencies of the bridging groups and terminal methyl groups, more of the vibrational stretching frequencies of dimer a have been shown in the table below.
These results show that the bridging bonds require less energy compared to the terminal Ga-Me bonds to cause a vibration. This can be said because the Ga-Cl bridging bonds have a lower frequency compared to the Ga-Me stretches. This is because the bridging bonds are weaker than the terminal Ga-Me bonds. This confirms that the bridging bonds must be different to the 2-centre-2-electron single bonds between the gallium and terminal methyl groups.
The Infra-red spectrum of dimer a can be produced from the vibrational data.
Predicted Infra-Red Spectrum of Dimer a
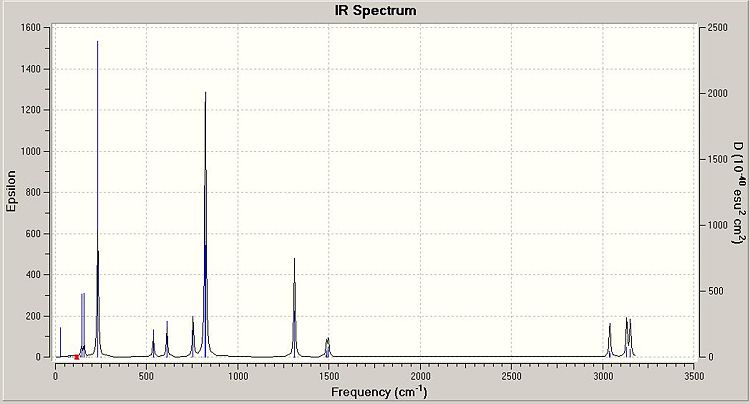
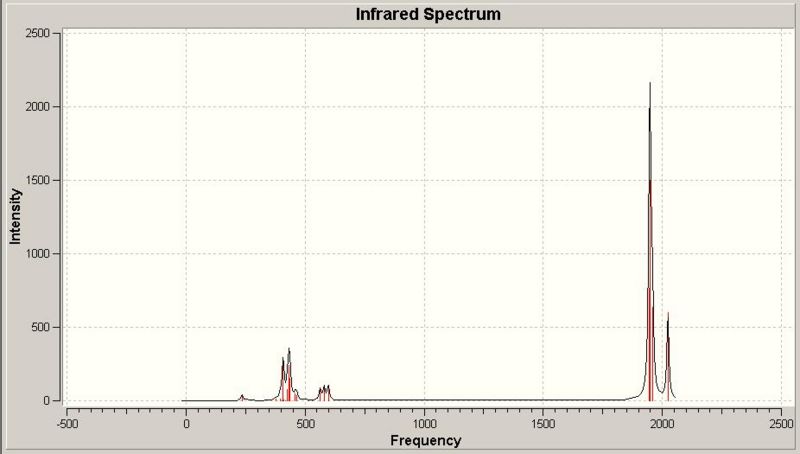
This infra-red spectrum shows the IR active peaks for the dimer. The asymmetric Ga-Cl stretches can be seen at 231cm-1 and 233cm-1 on the spectrum. The large peak at 822cm-1 corresponds to C-H bending vibrations. The very high frequency vibrations seen correspond to C-H stretches. These are high frequency vibrations because the C-H bonds are strong single bonds in the dimer, so they require more energy to cause a vibration of the bond.
Conclusion
Dimers a-h were drawn using Gaussview, and all were optimised. The success of the optimisations was then confirmed using frequency analysis. The optimised structures were analysed in terms of their geometry. It was found that bridging bonds are longer, and weaker than corresponding single bonds between the same elements, therefore a different type of bonding must be involved. The bridging bonds are 3-centre-2-electron bonds whereas terminal bonds are 2-centre-2-electron bonds. These bridging bonds hold the dimer together. It was found that halides are better bridging groups than methyl groups. This is because a halide can readily donate a lone pair to the bridging bond, whereas it is unfavourable for the carbon of the methyl group to be 5-coordinate. Therefore, dimer c and g have a more monomeric structure, due to the poor bridging ability of the methyl groups. This idea was confirmed by analysing the molecular orbitals of the dimers. The molecular orbitals showing bridging bonds were computed for dimer a. Also, by looking at the vibrational frequencies of dimer a it could be seen that the bridging bonds had lower vibrational frequencies than the terminal bonds because bridging bonds are weaker.
References
- ↑ Molecular Orbital Diagram of BH3: http://www.ch.ic.ac.uk/hunt/teaching/teaching_MOs_year2/L3_Tut_MO_diagram_BH3.pdf
- ↑ Greenwood, N.N.; Earnshaw, A., Chemistry of the Elements, Second Edition, Oxford: Butterworth-Heinemann, 1997, ISBN 0-7506-3365-4
- ↑ Geometries of Molecules: http://www.vias.org/genchem/molgeom_12594_02.html (March, 2010)
- ↑ 4.0 4.1 Example diagram for optimising Mo(CO)4(PCl3)2 isomers: http://www.ch.ic.ac.uk/hunt/teaching/teaching_comp_lab_year3/10b_MoC4L2_opt.html
- ↑ 5.0 5.1 5.2 5.3 Infrared Determination of Stereochemistry in Metal Complexes - an application of group theory, Darensbourg M. Y., Darensbourg D. J., J. Chem. Ed., 1970, 47, 33-35
- ↑ 6.0 6.1 Phosphine-substituted carbonyl halide complexes of chromium and molybdenum, Allen, A.D., Barrett, P. F., Can. J. Chem., 1968, 46, 1649-1653
- ↑ Molybdenum tetracarbonyl complexes with functionalised aminophosphine ligands: cis-[Mo(CO)4(PPh2NHR)2] (R=Ph, But) — molecular structures of PMes2NHPh (Mes=2,4,6-Me3C6H2), PPh2NHBut and cis-[Mo(CO)4(PPh2NHBut)2], Kühl, O., Blaurock, S., Sieler J., Hey-Hawkin E., Polyhedron, 2001, 111-117 DOI:10.1016/S0277-5387(00)00599-4
- ↑ Crystal structures of trans-[Mo(CO)4(PPh3)2] and 1,4-bis (diphenylphosphino)-2,5-difluorobenzene, Hogarth, G., Norman, T., Inorganica Chimica Acta, 1997, 167-171 DOI:10.1016/S0020-1693(96)05133-X
- ↑ 9.0 9.1 The crystal and molecular structure of trans-tetracarbonylbis(triphenyl-phosphine)chromium(0) in a new unit cell: Is the trans conformer more stable than the cis?, Bennett D. W., Siddiquee, T. A., Haworth D.T., Kabir, S. E., Camellia, F., J. Chem. Cryst., 2004, 34 (6), 353-359 DOI:10.1016/u5383x017700g761
- ↑ 10.0 10.1 Shriver and Atkins: Inorganic Chemistry, Atkins, P., Overton, T., Rourke, J., Weller, M., Armstrong, F., Fourth Edition, Oxford University Press, 2006, (Phosphine Ligands: pages 533-534), (Carbonyl Ligands: pages 532 and 551-552), ISBN 0-19-926463-5
- ↑ 11.0 11.1 11.2 11.3 Chlorogallanes (GaClH2, GaCl2H, and GaCl3) and their Dimer Isomers, Duke, B. J., Hamilton, T. P., Schaefer, H. F., Inorg. Chem., 1991, 30 (22), 4225-4229 DOI:10.1021/ic00022a025
- ↑ 12.0 12.1 An Electron-Diffraction Study of the Molecular Structure of Trimethylgallium, Beagley, B., Schmidling, D. G., J. Mol. Struct., 1974, 21, 437-444 DOI:10.1016/0022-2860(74)80093-1
- ↑ Electron Deficient Compounds. VIII. The Crystal and Molecular Structure of Trimethylindium, Amma, E.L., Rundle, R.E., J. Am. Chem. Soc., 1958, 80 (16), 4141-4145 DOI:10.1021/ja01549a007
- ↑ Second Year Lecture Notes: "Main Group Chemistry", Lickiss, P., Imperial College London, 2008/9


