Rep:Mod:01508610
The Optimization Of NH3 Molecule
Theoretical Results
Molecule name      = ammonia/ NH3

Calculation Method = RB3LYP

Basis Set          = 6-31G(d,p)

E(RB3LYP)          = -56.55776873 a.u.

RMS Gradient Norm  = 0.00000485 a.u.

Point Group        = C3V


Optimised N-H bond distance = 1.01798Å (uncertainty ≈ 0.001Å)

Optimised H-N-H bond angle  = 105.741 (uncertainty ≈ 0.1°)
Optimization Result Data
         Item               Value     Threshold  Converged?
 Maximum Force            0.000004     0.000450     YES
 RMS     Force            0.000004     0.000300     YES
 Maximum Displacement     0.000072     0.001800     YES
 RMS     Displacement     0.000035     0.001200     YES
 Predicted change in Energy=-5.986281D-10
 Optimization completed.
    -- Stationary point found.
                           ----------------------------
                           !   Optimized Parameters   !
                           ! (Angstroms and Degrees)  !
 --------------------------                            --------------------------
 ! Name  Definition              Value          Derivative Info.                !
 --------------------------------------------------------------------------------
 ! R1    R(1,2)                  1.018          -DE/DX =    0.0                 !
 ! R2    R(1,3)                  1.018          -DE/DX =    0.0                 !
 ! R3    R(1,4)                  1.018          -DE/DX =    0.0                 !
 ! A1    A(2,1,3)              105.7412         -DE/DX =    0.0                 !
 ! A2    A(2,1,4)              105.7412         -DE/DX =    0.0                 !
 ! A3    A(3,1,4)              105.7412         -DE/DX =    0.0                 !
 ! D1    D(2,1,4,3)           -111.8571         -DE/DX =    0.0                 !
 --------------------------------------------------------------------------------
 GradGradGradGradGradGradGradGradGradGradGradGradGradGradGradGradGradGrad
The Image of The Optimized NH3 Molecule
NH3 molecule |
The final file of the optimisation/frequency
File:PHUNT NH3 OPTF POP GGGJS.LOG
The Vibrational Analysis of NH3 Molecule
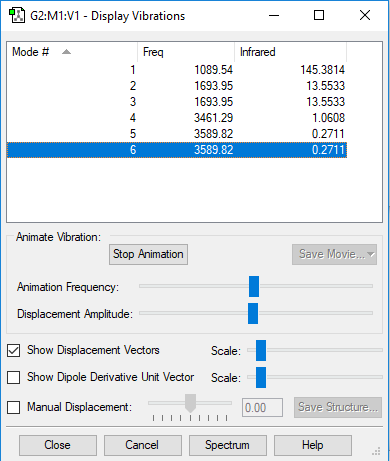
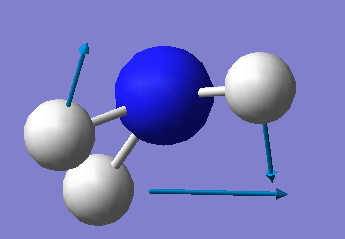
The result suggests that there are 6 vibrational modes which have frequencies(cm-1) and corresponding intensities in IR spectrum as shown below. And there is no negetive value of frequency, which implies that the optimization is successful.
Mode  Frequency(cm^-1)  IR Intensity
1     1090              145
2     1694              14
3     1694              14
4     3461              1
5     3590              0
6     3590              0
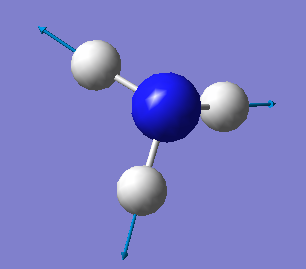
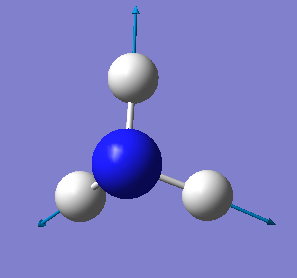
The Screenshot of 'Display Vibrations' page which contains analytical results is attached below:
| Wavenumber
cm-1 |
1090 | 1694 | 3461 | 3590 |
|---|---|---|---|---|
| Symmetry | A1 | E | A1 | E |
| Intensity
arbitrary units |
145 | 14 | 1 | 0 |
| Image | 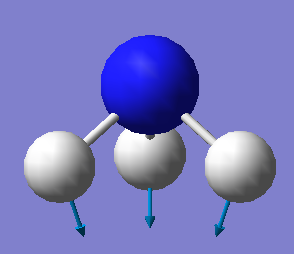
|
|
|
|
The detailed analysis process is listed below in the form of Q&A:
•How many modes do you expect from the 3N-6 rule?
N = 4(atoms); 3 x 4 - 6 = 6(modes)

•Which modes are degenerate (ie have the same energy)?
The mode 2 and 3 are degenerate with the same frequency of 1693.95(cm<sup>-1</sup>);
The mode 5 and 6 are degenerate with the same frequency of 3589.82(cm<sup>-1</sup>).

•Which modes are "bending" vibrations and which are "bond stretch" vibrations?
The mode 1,2 and 3 are bending whereas the mode 4,5 and 6 are stretching.

•Which mode is highly symmetric?
The mode 4 is a symmetrical stretching.

•One mode is known as the "umbrella" mode, which one is this?
The mode 1 is the 'umbrella' symmetric bending mode.

•How many bands would you expect to see in an experimental spectrum of gaseous ammonia?
There will be three bands in total which stand around 1000, 1700 and 3500 cm<sup>-1</sup> respectively.
The Charge Distribution of NH3 Molecule
Based on the concept of electronegativity of which N atom is 3.04 while H atom is 2.1, the N atom is more electronegative with a lone pair of electrons than H atoms. Thus, the N atom is predicted to be negatively charged and H atoms are expected to be positively charged. This prediction has been proved to be true by computational charge analysis with results shown below:
charge on N atom: -1.125
charge on H atoms: 0.375
The Optimization Of N2 Molecule
The Theoretical Results
Molecule name      = nitrogen/ N2

Calculation Method = RB3LYP

Basis Set          = 6-31G(d,p)

E(RB3LYP)          = -109.52412868 a.u.

RMS Gradient Norm  = 0.00000060	 a.u.

Point Group        = D*H


Optimised N-N bond distance = 1.10550 Å (uncertainty ≈ 0.001Å)

Optimized N-N bond angle    = 180° (uncertainty ≈ 0.1°)
The Optimization Result Data
         Item               Value     Threshold  Converged?
 Maximum Force            0.000001     0.000450     YES
 RMS     Force            0.000001     0.000300     YES
 Maximum Displacement     0.000000     0.001800     YES
 RMS     Displacement     0.000000     0.001200     YES
 Predicted change in Energy=-3.401069D-13
 Optimization completed.
    -- Stationary point found.
                           ----------------------------
                           !   Optimized Parameters   !
                           ! (Angstroms and Degrees)  !
 --------------------------                            --------------------------
 ! Name  Definition              Value          Derivative Info.                !
 --------------------------------------------------------------------------------
 ! R1    R(1,2)                  1.1055         -DE/DX =    0.0                 !
 --------------------------------------------------------------------------------
 GradGradGradGradGradGradGradGradGradGradGradGradGradGradGradGradGradGrad
The Image of The Optimized N2 Molecule
N molecule |
The final file of the optimization/frequency
The Vibrational Analysis of N2 Molecule
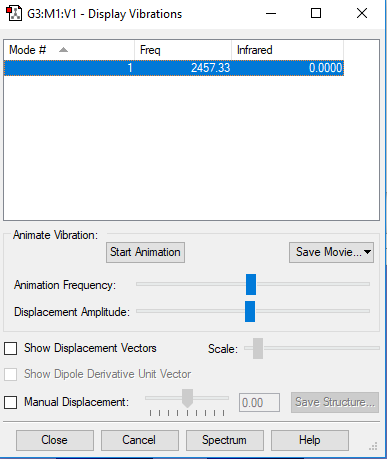
The result suggests that there is only one vibrational mode which has frequency(cm-1) and corresponding intensity in IR spectrum as shown below. And there is no negetive value of frequency, which implies that the optimization is successful.
Mode   Frequency(cm-1)    IR Intensity
1      2457               0
The Screenshot of 'Display Vibrations' page which contains analytical results is attached below:
| Wavenumber
cm-1 |
2457 |
|---|---|
| Symmetry | SGG |
| Intensity
arbitrary units |
0 |
| Image | 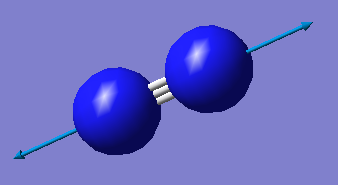
|
The Charge Density
Based on the concept of electronegativity of which N atom is 3.04, there is no difference of electronegativity between two identical N atoms and therefore the charges on N atoms are expected to be zero. This prediction has been proved to be true by computational charge analysis with results shown below:
charge on the first  N atoms: 0.000
charge on the second N atoms: 0.000
A mono-metallic TM complex that coordinates N2
Identifier
ZAVHUB
The link to the structure
N-N Bond Distances
1.13007 Å and 1.1196 Å
These two bond distances in a crystal structure are slightly different from the computational distance (1.10550 Å). There are two reasons for the deviation.
Firstly, the bond distance of N-N bond should be different in gaseous phase (the computational one) and in a complex. According to an article[1], the bonding in nitrogen complex is formed through back donation of non-bonding d-electrons from the metal into the anti-bonding orbitals of the nitrogen molecule which results in weakening the N-N bond. The reduced strength of N-N can be revealed by a decrease of the stretching frequency, v(N=N), from 2331 cm-1 (for nitrogen gas) to 180-320 cm-l (for nitrogen in complexes). Therefore, the reduced bong strength of nitrogen in a complex leads to a longer bond distance.
The second reason is that there must be some systematic errors to a certain level. Since the computer are commanded to run a huge amount of calculations in a short time period, which causes a compromise between speed and accuracy. This means that the bond distance calculated by a computer might not be 100% accurate.
- ↑ J.Chatt,'Nitrogen Complexes of the Platinum MetalsPlatinum', MetalsTev., vol.13, pp.11, 1969
The Optimization of H2 Molecule
The Theoretical Results
Molecule name      = hydrogen/ H2

Calculation Method = RB3LYP

Basis Set          = 6-31G(d,p)

E(RB3LYP)          = -1.17853936 a.u.

RMS Gradient Norm  = 0.00000017 a.u.

Point Group        = D*H


Optimised H-H bond distance = 0.74279 Å (uncertainty ≈ 0.001Å)

Optimised H-H bond angle   = 180° (uncertainty ≈ 0.1°)
The Optimization Resulte Data
         Item               Value     Threshold  Converged?
 Maximum Force            0.000000     0.000450     YES
 RMS     Force            0.000000     0.000300     YES
 Maximum Displacement     0.000000     0.001800     YES
 RMS     Displacement     0.000001     0.001200     YES
 Predicted change in Energy=-1.164080D-13
 Optimization completed.
    -- Stationary point found.
                           ----------------------------
                           !   Optimized Parameters   !
                           ! (Angstroms and Degrees)  !
 --------------------------                            --------------------------
 ! Name  Definition              Value          Derivative Info.                !
 --------------------------------------------------------------------------------
 ! R1    R(1,2)                  0.7428         -DE/DX =    0.0                 !
 --------------------------------------------------------------------------------
 GradGradGradGradGradGradGradGradGradGradGradGradGradGradGradGradGradGrad
The Image of The Optimized H2 Molecule
H2 molecule |
The final file of the optimisation/frequency
The Vibrational Analysis of H2 Molecule
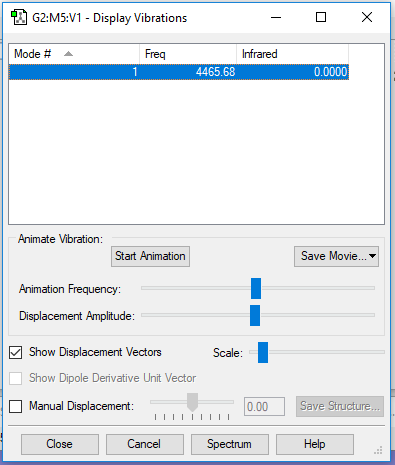
The result suggests that there is only one vibrational mode which has frequency(cm-1) and corresponding intensity in IR spectrum as shown below. And there is no negetive value of frequency, which implies that the optimization is successful.
Mode   Frequency(cm-1)    IR Intensity
1      4466               0
The Screenshot of 'Display Vibrations' page which contains analytical results is attached below:
| Wavenumber
cm-1 |
4466 |
|---|---|
| Symmetry | SGG |
| Intensity
arbitrary units |
0 |
| Image | 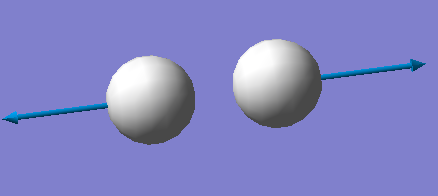
|
The Charge Diatribution Of H2 Molecule
Based on the concept of electronegativity of which H atom is 2.1, there is no difference of electronegativity between two identical H atoms and therefore the charges on H atoms are expected to be zero. This prediction has been proved to be true by computational charge analysis with results shown below:
charge on the first  H atoms: 0.000
charge on the second H atoms: 0.000
The Extra Investigation Towards The H-H Bond
The literature value of H-H bond length[1] is 74 pm or 0.74 Å which is quite close to our computational result (0.74279 Å).
Therefore, the computational optimization is very successful, outputting highly accurate results.
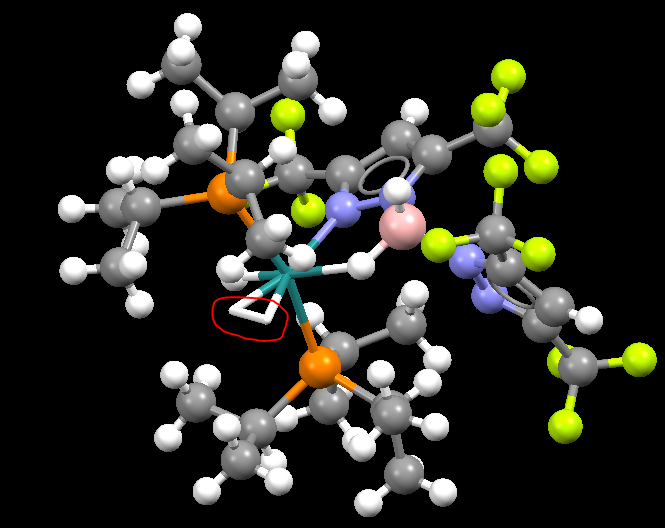
However, the bond length of H-H in a mono-metallic TM complex is larger, with 1.004 Å.
The reason of this difference is the same as that of nitrogen gas which is illustrated above at 3.3.
The identifier of the complex is ABASUR and its image is shown below:
- ↑ T.L. Cottrell, "The Strengths of Chemical Bonds," 2nd ed., Butterworths, London, 1958
The Haber-Bosch process
The energy for converting hydrogen and nitrogen gas into ammonia gas, N2 + 3H2 -> 2NH3, is calculated below:
•E(NH3)  = -56.55776873 a.u. = -148492.433112 kJ/mol
•2*E(NH3)= -113.1155375 a.u. = -296984.866329 kJ/mol
•E(N2)   = -109.52412868 a.u.= -287555.62175417 kJ/mol
•E(H2)   = -1.17853936 a.u.  = -3094.25532539 kJ/mol
•3*E(H2) = -3.53561808 a.u.  = -9282.76597616 kJ/mol
•ΔE=2*E(NH3)-[E(N2)+3*E(H2)]= -146.5 kJ/mol
The ammonia product is more stable than the gasous reactants, because the enthalpy change of the reaction is negative which implies that the reaction is exothermic.
The Optimization of [AlBr4]– Molecule
The Theoretical Results
Molecule name      = [AlBr4]-

Calculation Method = RB3LYP

Basis Set          = 6-31G(d,p)

E(RB3LYP)          = -10529.67123680 a.u.

RMS Gradient Norm  = 0.00000245 a.u.

Point Group        = TD


Optimised Al-Br bond distance = 2.32611 Å (uncertainty ≈ 0.001Å)

Optimised Br-A-Br bond angle  = 109.471° (uncertainty ≈ 0.1°)
The Optimization Result Data
         Item               Value     Threshold  Converged?
 Maximum Force            0.000005     0.000450     YES
 RMS     Force            0.000003     0.000300     YES
 Maximum Displacement     0.000037     0.001800     YES
 RMS     Displacement     0.000020     0.001200     YES
 Predicted change in Energy=-3.554733D-10
 Optimization completed.
    -- Stationary point found.
                           ----------------------------
                           !   Optimized Parameters   !
                           ! (Angstroms and Degrees)  !
 --------------------------                            --------------------------
 ! Name  Definition              Value          Derivative Info.                !
 --------------------------------------------------------------------------------
 ! R1    R(1,2)                  2.3261         -DE/DX =    0.0                 !
 ! R2    R(1,3)                  2.3261         -DE/DX =    0.0                 !
 ! R3    R(1,4)                  2.3261         -DE/DX =    0.0                 !
 ! R4    R(1,5)                  2.3261         -DE/DX =    0.0                 !
 ! A1    A(2,1,3)              109.4712         -DE/DX =    0.0                 !
 ! A2    A(2,1,4)              109.4712         -DE/DX =    0.0                 !
 ! A3    A(2,1,5)              109.4712         -DE/DX =    0.0                 !
 ! A4    A(3,1,4)              109.4712         -DE/DX =    0.0                 !
 ! A5    A(3,1,5)              109.4712         -DE/DX =    0.0                 !
 ! A6    A(4,1,5)              109.4712         -DE/DX =    0.0                 !
 ! D1    D(2,1,4,3)           -120.0            -DE/DX =    0.0                 !
 ! D2    D(2,1,5,3)            120.0            -DE/DX =    0.0                 !
 ! D3    D(2,1,5,4)           -120.0            -DE/DX =    0.0                 !
 ! D4    D(3,1,5,4)            120.0            -DE/DX =    0.0                 !
 --------------------------------------------------------------------------------
 GradGradGradGradGradGradGradGradGradGradGradGradGradGradGradGradGradGrad
The Image Of The Optimized [AlBr4]– Molecule
[AlBr4]- Molecule |
The final file of the optimisation/frequency
The Vibrational Analysis of [AlBr4]– Molecule
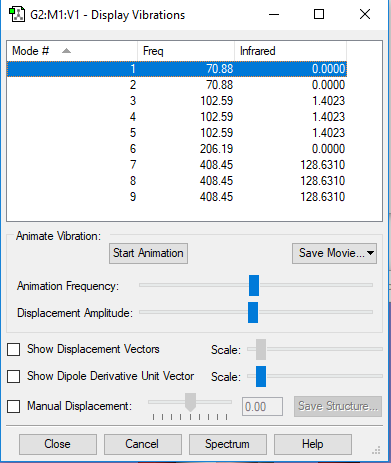
The result suggests that there are 9 vibrational modes which have frequencies(cm-1) and corresponding intensities in IR spectrum as shown below. And there is no negetive value of frequency, which implies that the optimization is successful.
Mode  Frequency(cm^-1)  IR Intensity
1     71                0
2     71                0
3     103               1
4     103               1
5     103               1
6     206               0
7     408               129
8     408               129
9     408               129
The Screenshot of 'Display Vibrations' page which contains analytical results is attached below:
| Wavenumber
cm-1 |
71 | 103 | 206 | 408 |
|---|---|---|---|---|
| Symmetry | E | T2 | A1 | T2 |
| Intensity
arbitrary units |
0 | 1 | 0 | 129 |
| Image | 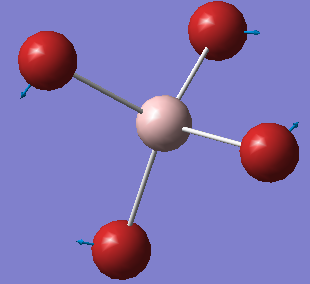
|
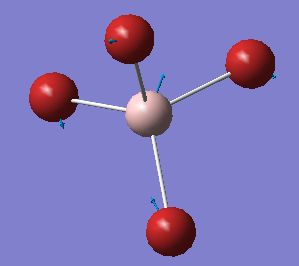
|

|
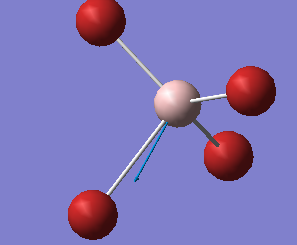
|
The Charge Distribution of [AlBr4]– Molecule
Based on the concept of electronegativity of which Al atom is 1.61 while Br atom is 2.96, Br atoms are more electronegative than the Al atom. Thus, Br atoms are predicted to be negatively charged and the Al atom are expected to be positively charged. This prediction has been proved to be true by computational charge analysis with results shown below:
charge on Al atom: 1.137
charge on Br atoms: -0.534
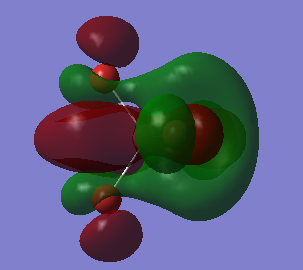
Tne MO Analysis of [AlBr4]– Molecule
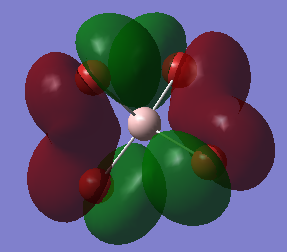
This an anti-bonding MO because there are nodal planes passing through each Al-Br bond.
The MO has an energy of 0.20582 a.u. that is slightly higher than the energy of LUMO.
The positive phases of two Br atoms and the positive phase of the Al atom overlap and then form a large U-shaped positive lobe.
Another large U-shaped negative lobe are also formed through the similar way.
The rest small parts of the MO are just p AOs of Br atoms that have opposite phase to those involved in large lobes.
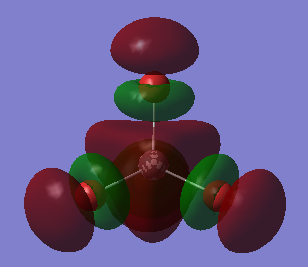
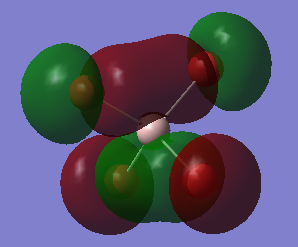
This the LUMO and it has the lowest positive energy of 0.15202 a.u..
This is anti-bonding MO because there are nodal planes passing through each Al-Br bond.
In the middle of the molecule, the trigonal-pyramidal-shaped orbital is the polarized 3S AO of Al atom.
The rest MO are p AOs of Br atoms that is parallel to the bonds (z-direction), representing the lone pair of electrons on each Br atom.
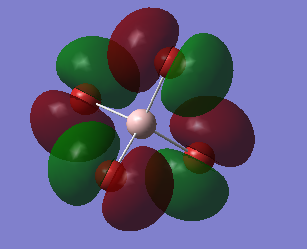
This is HOMO, unoccupied, with energy of -0.14412 a.u..
It is neither bonding MO nor anti-bonding MO, since the Al atom has no contribution to the MO.
Thus, it is a non-bonding MO.
The MO is only consisted of p AOs of Br atoms that are perpendicular to their Al-Br bonds.
And these p AOs represent lone pairs of electrons on Br atoms.
This is mostly a non-bonding MO with some bonding character.
Since there is no contribution from the Al atom, making it non-bonding.
But there are overlaps between the p AOs of adjacent Br atoms, giving some bonding character.
The MO is unoccupied and has energy of -0.15118 a.u. taht is slightly lower than HOMO's energy.
This MO, is below the HOMO, has energy of -0.19803 a.u..
It is a bonding MO since these Al-Br bonds are entirely involved in or surrounded by the two big cylinder-shaped orbitals, without any nodal planes.
The Al atom has contributed to the MO in this case, because there is a nodal plane passing through the Al atom
which means the 3p AO of Al atom is overlaping with those p AOs of Br atoms and then forms sigma bonds.
In adiition, the adjacent sigma bonds with the same phase also overlap together, eventually forming the two big cylinder-shaped MOs.
Marking
Note: All grades and comments are provisional and subject to change until your grades are officially returned via blackboard. Please do not contact anyone about anything to do with the marking of this lab until you have recieved your grade from blackboard.
Wiki structure and presentation 1/1
Is your wiki page clear and easy to follow, with consistent formatting?
YES - good structure, well done.
Do you effectively use tables, figures and subheadings to communicate your work?
YES
NH3 0.5/1
Have you completed the calculation and given a link to the file?
YES
Have you included summary and item tables in your wiki?
YES
Have you included a 3d jmol file or an image of the finished structure?
YES
Have you included the bond lengths and angles asked for?
YES
Have you included the “display vibrations” table?
YES
Have you added a table to your wiki listing the wavenumber and intensity of each vibration?
YES
Did you do the optional extra of adding images of the vibrations?
YES
Have you included answers to the questions about vibrations and charges in the lab script?
YES - you have answered the questions about the charges and most of the question about vibrations correctly.
However due to the low intensity of vibrations 4, 5 and 6 you only see two peaks in the IR spectrum.
N2 and H2 0/0.5
Have you completed the calculations and included all relevant information? (summary, item table, structural information, jmol image, vibrations and charges)
YES
However you have given a bond angle of 180 for N2 and H2, there are no bond angles in diatomic molecules. Bond angles involve exactly 3 atoms.
Crystal structure comparison 0.5/0.5
Have you included a link to a structure from the CCDC that includes a coordinated N2 or H2 molecule?
YES
Have you compared your optimised bond distance to the crystal structure bond distance?
YES - good explanation on the bonding.
Haber-Bosch reaction energy calculation 1/1
Have you correctly calculated the energies asked for? ΔE=2*E(NH3)-[E(N2)+3*E(H2)]
YES
Have you reported your answers to the correct number of decimal places?
YES
Do your energies have the correct +/- sign?
YES
Have you answered the question, Identify which is more stable the gaseous reactants or the ammonia product?
YES
Your choice of small molecule 2.5/5
Have you completed the calculation and included all relevant information?
YES
Have you added information about MOs and charges on atoms?
YES - your charge analysis is good.
Some of your MO analysis is also good, however you have missed the difference between bonding character of an MO (does the MO have nodal planes between atoms or good overlap of same phase AOs) and the MOs contribution to bonding (a bonding character MO only contributes to bonding between the atoms if it is occupied).
You also said that the HOMO is unoccupied - this is incorrect. HOMO stands for Highest Occupied Molecular Orbital.
Independence 1/1
If you have finished everything else and have spare time in the lab you could: Check one of your results against the literature, or
YES good analysis of a crystal structure with H-H.
Do an extra calculation on another small molecule, or Do some deeper analysis on your results so far

