Rep:Mod:01497384
Ammonia molecule (NH3)
Key information from computational optimisation
•Calculation method: RB3LYP
•Basis set: 6-31G(d,p)
•Final energy E(RB3LYP) : -56.55776873 a.u.
•RMS gradient:0.00000485 a.u.
•Point group: C3V
•Optimised N-H bond distance: 1.01798 Å
•Optimised H-N-H bond angles: 105.741°
Item table showing converged forces and distances
Item               Value     Threshold  Converged?
 Maximum Force            0.000004     0.000450     YES
 RMS     Force            0.000004     0.000300     YES
 Maximum Displacement     0.000072     0.001800     YES
 RMS     Displacement     0.000035     0.001200     YES
Jmol dynamic image
Optimised Ammonia molecule |
The optimisation file of NH3 molecule can be found here
Vibrational analysis
| Wavenumber(cm-1) | Symmetry | Intensity(arbitrary units) | Image |
|---|---|---|---|
| 1090 | A1 | 145 | 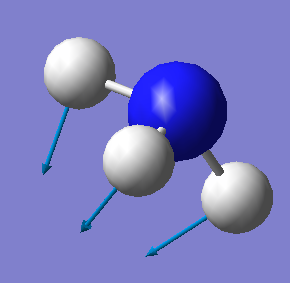 |
| 1694 | E | 14 | 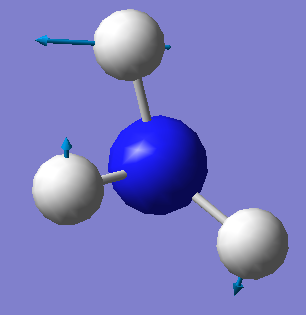 |
| 1694 | E | 14 | 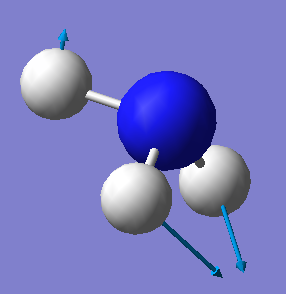 |
| 3461 | A1 | 1 | 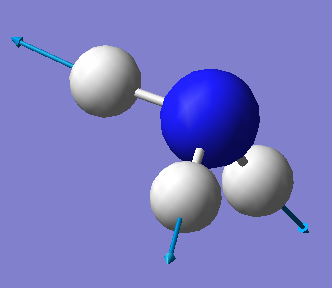 |
| 3590 | E | 0 | 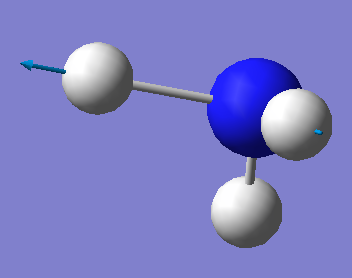 |
| 3590 | E | 0 | 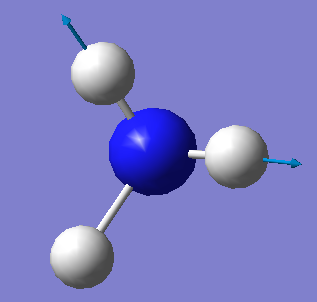 |

•Number of modes expected from the 3N-6 rule: 6
•Degenerate modes: 2 and 3, 5 and 6
•Bending vibrations: 1,2 and 3
•Stretching vibrations: 4, 5 and 6
•Highly symmetric mode: 4
•"Umbrella" mode: 1
•Number of bands expected to see in an experimental spectrum of gaseous NH3: 4
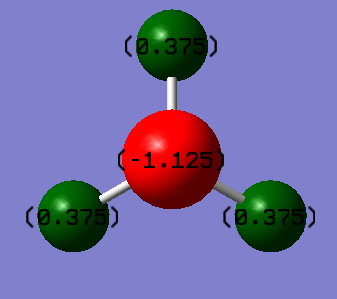
Charge analysis
•Charge on N atom: -1.125
•Charge on H atoms: 0.375
•Expected charge for N: negative
•Expected charges for H: positive
Reason: Nitrogen atom is more electronegative than hydrogen, it pulls the electrons in the bonds more towards itself, causing the electron density to be relatively higher at N compared to H.
Nitrogen molecule (N2)
Key information containing theoretical results from computational optimisation
•Calculation method: RB3LYP
•Basis set: 6-31G(d,p)
•Final energy E(RB3LYP) : -109.52412868 a.u.
•RMS gradient:0.00000060 a.u.
•Point group: D∞h
•Optimised N-N bond distance: 1.10550 Å
•Optimised N-N bond angle: 180°
Item table showing converged forces and distances
Item               Value     Threshold  Converged?
 Maximum Force            0.000001     0.000450     YES
 RMS     Force            0.000001     0.000300     YES
 Maximum Displacement     0.000000     0.001800     YES
 RMS     Displacement     0.000000     0.001200     YES
Jmol dynamic image
Optimised Nitrogen molecule |
The optimisation file of N2 molecule can be found here
Vibrational analysis
| Wavenumber(cm-1) | Symmetry | Intensity(arbitrary units) | Image |
|---|---|---|---|
| 2457 | SGG | 0 | 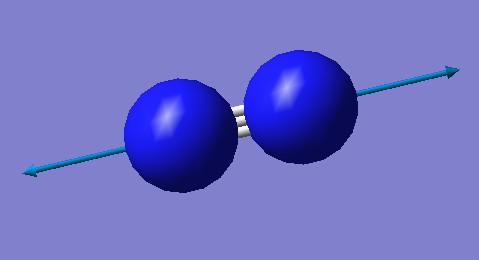 |

•Number of modes expected from the 3N-5 rule: 1
•Number of bands expected to see in an experimental spectrum of gaseous N2: 0
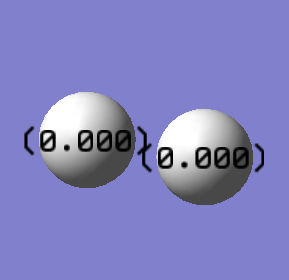
Charge analysis
•Charges on N atoms: 0
Hydrogen molecule (H2)
Key information containing theoretical results from computational optimisation
•Calculation method: RB3LYP
•Basis set: 6-31G(d,p)
•Final energy E(RB3LYP) : -1.17853936 a.u.
•RMS gradient:0.00000017 a.u.
•Point group: D∞h
•Optimised H-H bond distance: 0.74279 Angstrom
•Optimised H-H bond angle:180°
Item table showing converged forces and distances
Item               Value     Threshold  Converged?
 Maximum Force            0.000000     0.000450     YES
 RMS     Force            0.000000     0.000300     YES
 Maximum Displacement     0.000000     0.001800     YES
 RMS     Displacement     0.000001     0.001200     YES
Jmol dynamic image
Optimised Hydrogen molecule |
The optimisation file of H2 molecule can be found here
Vibrational analysis
| Wavenumber(cm-1) | Symmetry | Intensity(arbitrary units) | Image |
|---|---|---|---|
| 4466 | SGG | 0 | 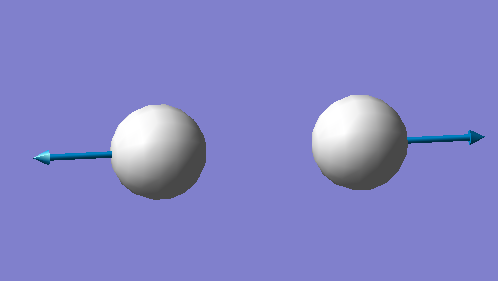 |

•Number of modes expected from the 3N-5 rule: 1
•Number of bands expected to see in an experimental spectrum of gaseous H2: 0
Charge analysis
•Charge on H atoms:0
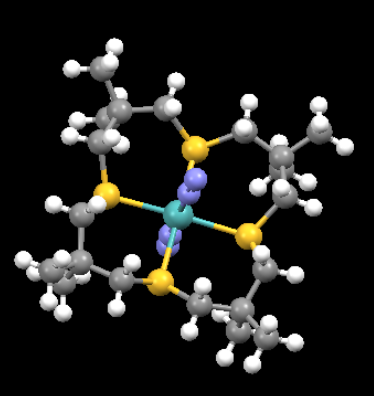
N2-coordinated mono-metallic transition metal complex
Information from optimisation of a N2-coordinated mono-metallic transition metal complex
•Structural name:trans-bis(Diazido)-(3,3,7,7,11,11,15,15-octamethyl-1,5,9,13-tetrathia-cyclohexadecane-S,S',S,S"')-molybdenum(0)
•Chemical formula:C20H40MoN4S4
•Unique identifier: GEPCEJ
•N-N bond distance from computational optimisation:1.10550 Å
•N-N bond distance from crystal:1.1097 and 1.1057 Å
The reason why the computational and TM complex N2 bond distances are different is because the N2 molecules in the crystal complex is bonded to the transition metal. The nitrogen atom from the molecule forms a dative covalent bond with the transition metal with its lone pair. This causes the nitrogen to acquire a partial positive charge. Stabilisation of this partial positive charge is achieved through resonance structures where electrons from the N2 triple are donated to the TM-bonded nitrogen. The resulting resonance structure formed has a structure of a double bonded N2 molecule. These resonance structures contribute equally to the overall structure of the complex, showing that the bond lengths of the nitrogen atoms in the TM complex are between that of a double bond and a triple bond. Hence the bond distances between N2 atoms are longer in the crystal than a simple gaseous N2 molecule.
There is a slight difference in the bond distances between the 2 N2 molecules in the crystals. This could be due to the error in measurements of the bond lengths.
This TM complex was first reported in 1988[1] and its structure can be found here: [GEPCEJ[2]]
Haber-Bosch process
Calculation of energies
•E(NH3)= -56.5577687 a.u.
•2*E(NH3)= -113.1155375 a.u.
•E(N2)= -109.5241287 a.u.
•E(H2)= -1.1785394 a.u.
•3*E(H2)= -3.5356181 a.u.
•ΔE=2*E(NH3)-[E(N2)+3*E(H2)]=-0.0557907 a.u.
•ΔE=[-0.0557907 a.u.]/0.00038= -146.8 kJ/mol
• The ammonia product is more stable as the forward reaction forming the products is exothermic.
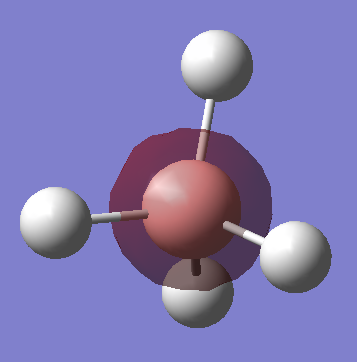
Borohydride molecule ([BH4]-)
Key information containing theoretical results from computational optimisation
•Calculation method: RB3LYP
•Basis set: 6-31G(d,p)
•Final energy E(RB3LYP) : -27.24992701 a.u.
•RMS gradient:0.00000589 a.u.
•Point group: Td
•Optimised B-H bond distance: 1.23940 Å
•Optimised H-B-H bond angle:109.471°
Item table showing converged forces and distances
         Item               Value     Threshold  Converged?
 Maximum Force            0.000011     0.000450     YES
 RMS     Force            0.000006     0.000300     YES
 Maximum Displacement     0.000057     0.001800     YES
 RMS     Displacement     0.000030     0.001200     YES
Jmol dynamic image
Optimised Borohydride molecule |
The optimisation file of [BH4]- molecule can be found here
Vibrational analysis
| Wavenumber(cm-1) | Symmetry | Intensity(arbitrary units) | Image |
|---|---|---|---|
| 1122 | T2 | 44 | 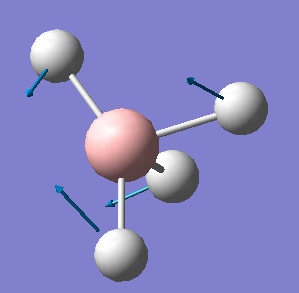 |
| 1122 | T2 | 44 | 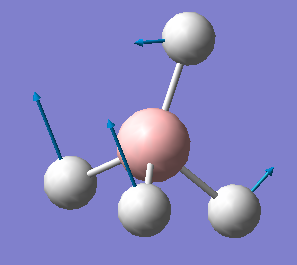 |
| 1122 | T2 | 44 | 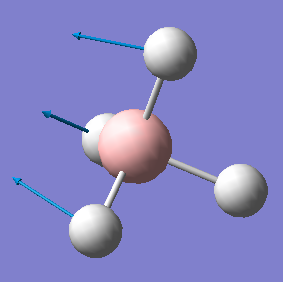 |
| 1239 | E | 0 | 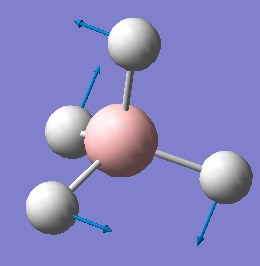 |
| 1239 | E | 0 | 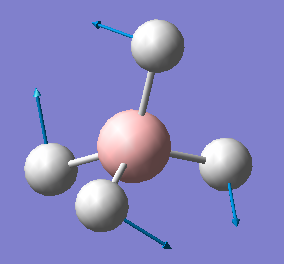 |
| 2284 | T2 | 498 | 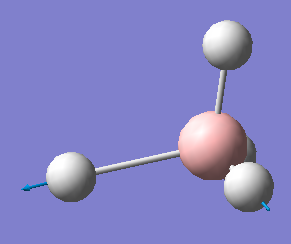 |
| 2284 | T2 | 498 | 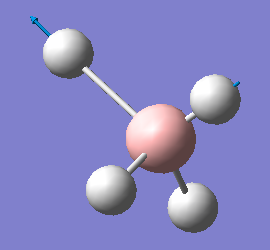 |
| 2284 | T2 | 498 | 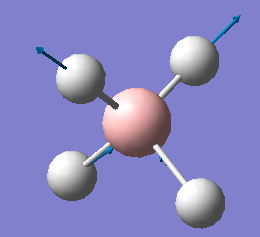 |
| 2291 | A1 | 0 | 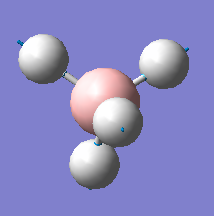 |
![An image of the vibrational analysis of [BH4]- molecule showing the frequencies and intensities of different vibrations.](/images/6/6f/Bh4_opt_vibrations_AGan.png)
•Number of modes expected from the 3N-6 rule: 9
•Degenerate modes: 1,2,3 / 4,5 / 6,7,8
•Bending vibrations: 1,2,3,4 and 5
•Stretching vibrations: 6,7,8 and 9
•Highly symmetric mode: 9
•Number of bands expected to see in an experimental spectrum of gaseous [BH4]-: 3
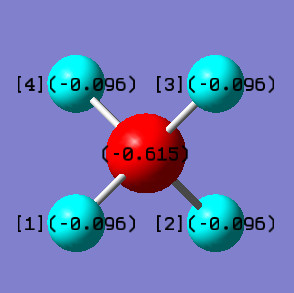
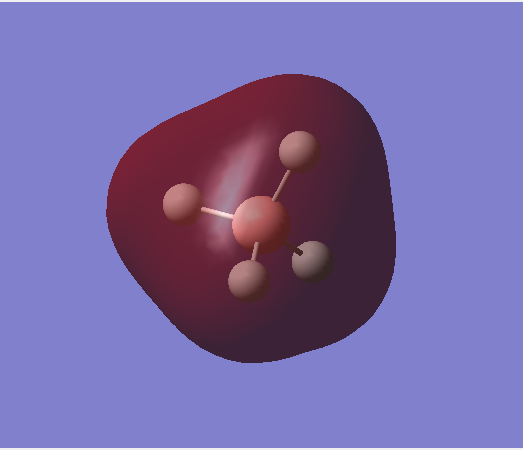
Charge analysis
•Charge on B atom:-0.615
•Charge on H atoms:-0.096
The total charge on the molecule is -1. The [BH4]- molecule has an excess of one electron. This excess negative charge is spread out and shared among the atoms. The boron atom is expected to have a higher partial negative charge as it is more electronegative than the hydrogen atoms, so it pulls more of the electron density towards itself.
Molecular orbital analysis
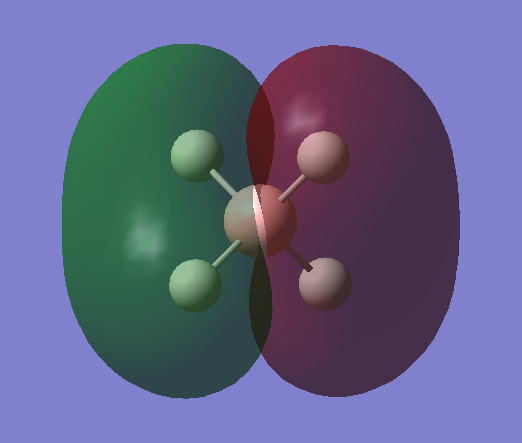
MO1
Non-bonding orbital
•Occupied/Unoccupied: Occupied
•Contributing AOs: 1s orbital of B
•Energy: -6.42131 a.u. (Deep in energy)
•Effect on bonding:This MO is very deep in energy as it resulted from the 1s (core) atomic orbital of the boron, hence it is not involved in bonding.
MO2
Bonding orbital
•Occupied/Unoccupied: Occupied
•Contributing AOs: 2s orbital of B, 1s orbitals of H
•Energy: -0.22587 a.u. (HOMO/LUMO region of energy)
•Effect on bonding: Stabilises the molecule. Too low in energy to be involved in bonding.
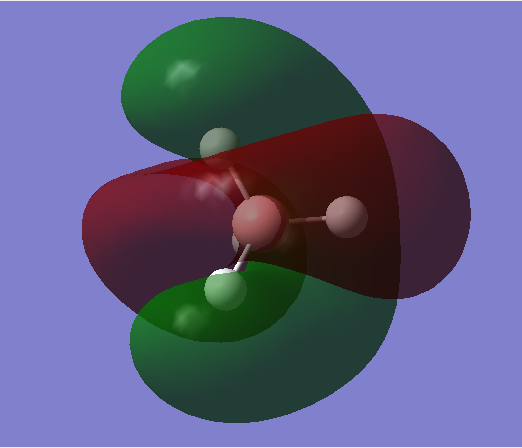
MO3
Bonding orbital
•Occupied/Unoccupied: Occupied
•Contributing AOs: 2p orbitals of B, 1s orbitals of H
•Energy: -0.03183 a.u. (HOMO/LUMO region of energy)
•Effect on bonding: Stabilises the molecule, has a high effect on bonding. Can form sigma/pi bonds.
MO6
Anti-bonding orbital
•Occupied/Unoccupied: Unoccupied
•Contributing AOs:
•Energy: +0.41615 a.u. (HOMO/LUMO region of energy)
•Effect on bonding:Has an effect on bonding. this orbital can accept electrons from a nucleophile, breaking the B-H bond as a result.
MO9
Bonding orbital
•Occupied/Unoccupied: Unoccupied
•Contributing AOs: s orbital of B, p orbitals of H ( The s orbital of B could be a 2s or a 3s, depending on the difference in the energy gap of the two s orbitals and the p orbitals of H, the resulting MO energy would be different. The smaller the energy gap between the s orbital of B and p orbital of H, the deeper the energy of the resulting MO would be)
•Energy: +0.43598 a.u. (HOMO/LUMO region of energy)
•Effect on bonding: Has an effect on bonding. Can form sigma bonds.
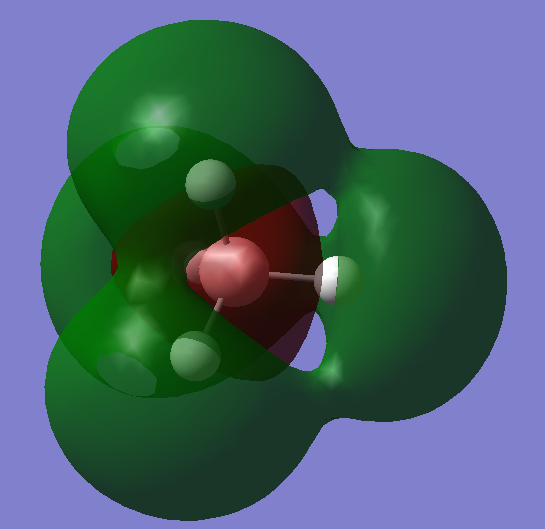
Hydrogen Sulfide molecule (SH2)
Key information containing theoretical results from computational optimisation
•Calculation method: RB3LYP
•Basis set: 6-31G(d,p)
•Final energy E(RB3LYP) : -399.39162414 a.u.
•RMS gradient:0.00012068 a.u.
•Point group: C2V
•Optimised S-H bond distance: 1.34737 Å
•Optimised H-S-H bond angle:92.681°
Item table showing converged forces and distances
         Item               Value     Threshold  Converged?
 Maximum Force            0.000175     0.000450     YES
 RMS     Force            0.000145     0.000300     YES
 Maximum Displacement     0.000472     0.001800     YES
 RMS     Displacement     0.000386     0.001200     YES
Jmol dynamic image
Optimised Hyrdogen Sulfide molecule |
The optimisation file of SH2 molecule can be found here
Vibrational analysis
| Wavenumber(cm-1) | Symmetry | Intensity(arbitrary units) |
|---|---|---|
| 1224 | A1 | 5 |
| 2692 | A1 | 7 |
| 2712 | B2 | 9 |
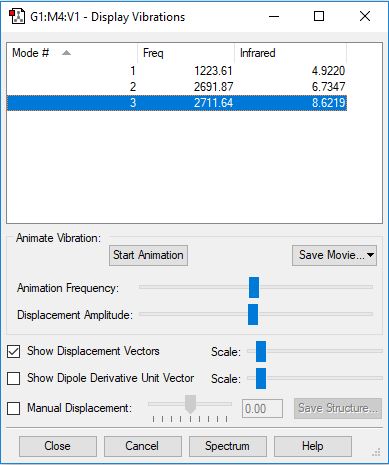
•Number of modes expected from the 3N-6 rule: 3
•Bending vibrations: 1
•Stretching vibrations: 2 and 3
•Highly symmetric mode: 2
•Number of bands expected to see in an experimental spectrum of gaseous SH2: 3
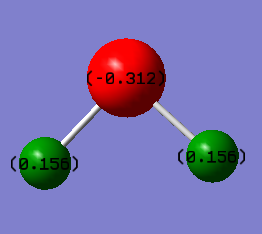
Charge analysis
•Charge on S atom:-0.312
•Charge on H atoms:+0.156
•Expected charge for S: negative
•Expected charges for H: positive
Reason: Sulfur atom is more electronegative than hydrogen, it pulls the electrons in the bonds more towards itself, causing the electron density to be relatively higher at S compared to H.
Molecular orbital analysis
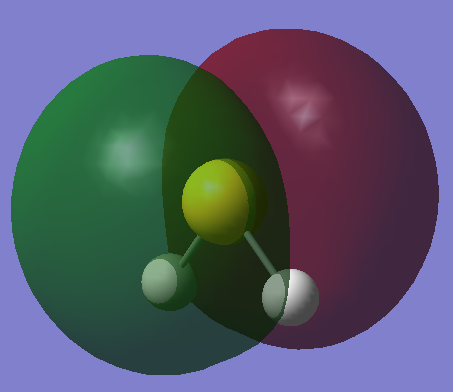
HOMO
Non-bonding orbital
•Occupied/Unoccupied: Occupied
•Contributing AOs: 3p orbital of S
•Energy: -0.26181 a.u.
•Effect on bonding: These are non-bonding lone pairs of the sulphur atom, which give the sulphur atom its nucleophilic character.
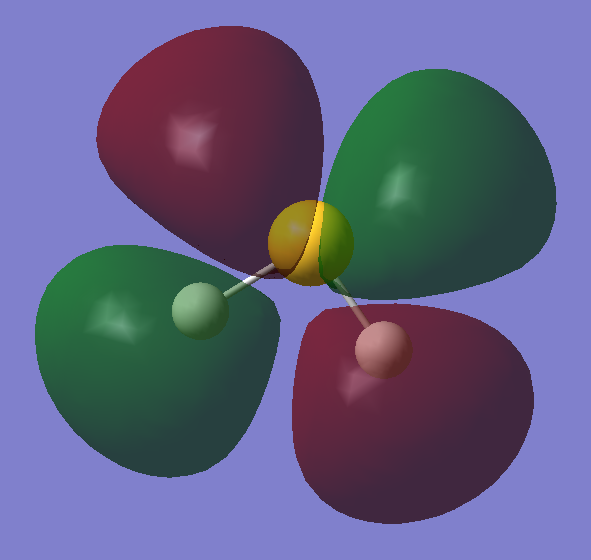
LUMO
Anti-Bonding orbital
•Occupied/Unoccupied: Unoccupied
•Contributing AOs: 2p/3p orbital of S, 1s orbitals of H
•Energy: -0.02126 a.u.
•Effect on bonding: This molecular can accept electrons from a nucleophilic species, breaking the S-H bonds.
References
Marking
Note: All grades and comments are provisional and subject to change until your grades are officially returned via blackboard. Please do not contact anyone about anything to do with the marking of this lab until you have recieved your grade from blackboard.
Wiki structure and presentation 1/1
Is your wiki page clear and easy to follow, with consistent formatting?
YES
Do you effectively use tables, figures and subheadings to communicate your work?
YES - goood structure and titles well done.
NH3 0.5/1
Have you completed the calculation and given a link to the file?
YES
Have you included summary and item tables in your wiki?
YES
Have you included a 3d jmol file or an image of the finished structure?
YES
Have you included the bond lengths and angles asked for?
YES
Have you included the “display vibrations” table?
YES
Have you added a table to your wiki listing the wavenumber and intensity of each vibration?
YES
Did you do the optional extra of adding images of the vibrations?
YES
Have you included answers to the questions about vibrations and charges in the lab script?
YES - good answers to the questions on the charges and most of the vibrational questions.
However due to the low intensity of vibrations 4, 5 and 6 you only see two peaks in the IR spectrum.
N2 and H2 0/0.5
Have you completed the calculations and included all relevant information? (summary, item table, structural information, jmol image, vibrations and charges)
YES
However you have given a bond angle of 180 for N2 and H2, there are no bond angles in diatomic molecules. Bond angles involve exactly 3 atoms.
Crystal structure comparison 0.5/0.5
Have you included a link to a structure from the CCDC that includes a coordinated N2 or H2 molecule?
YES
Have you compared your optimised bond distance to the crystal structure bond distance?
YES
Haber-Bosch reaction energy calculation 1/1
Have you correctly calculated the energies asked for? ΔE=2*E(NH3)-[E(N2)+3*E(H2)]
YES
Have you reported your answers to the correct number of decimal places?
YES
Do your energies have the correct +/- sign?
YES
Have you answered the question, Identify which is more stable the gaseous reactants or the ammonia product?
YES
Your choice of small molecule 2/5
Have you completed the calculation and included all relevant information?
YES - good organisation of relevant information.
Have you added information about MOs and charges on atoms?
YES you have added the information.
However we expect to see two peaks in the IR spectrum of BH4 - 1 peak for vibrations 1-3 and 1 peak for vibrations 6-8. The other peaks have an intensity of 0 so do not appear on the spectrum. Your charge analysis is good. In your MO analysis you seem to be conflating bonding (by which the lab script means the interactions between the B and H atoms) and reactivity, the interactions with outside molecules. So for example MO2 is involved in bonding and contributes to the B-H bonds.
Independence 1/1
If you have finished everything else and have spare time in the lab you could: Check one of your results against the literature, or Do an extra calculation on another small molecule, or
YES - and you did some in depth analysis of the MOs, well done!
Do some deeper analysis on your results so far

