Rep:Mod:01351899
Optimised NH3 molecule
Key data for optimisation
| Molecule | NH3 |
| Calculation Method | RB3LYP |
| Basis set | 6-31G(d,p) |
| Final energy | [E(RB3LYP)]: -56.55776873 au |
| RMS gradient | 0.00000485 au |
| Point group | C3V |
Optimisation results
| N-H Bond length | 1.01798 angstroms |
| H-N-H Bond Angle | 105.741 degrees |
        Item               Value     Threshold  Converged?
 Maximum Force            0.000004     0.000450     YES
 RMS     Force            0.000004     0.000300     YES
 Maximum Displacement     0.000072     0.001800     YES
 RMS     Displacement     0.000035     0.001200     YES
Jmol visualisation
test molecule |
Optimised molecule: Gaussview link
Link to the optimised NH3 molecule
Vibrational modes of optimised NH3 molecule
Key properties of modes
For a non-linear molecule such as NH3, the 3N-6 rule is used(N being the number of atoms) in order to calculate the number of vibrational modes of a molecule. NH3 has 4 atoms so using the rule 6 vibrational modes would be expected ((3x4)-6=6). From the image above this is reflected, as the vibrational analysis contains 6 modes.
From the analysis, it is clear that the 2nd and 3rd mode are degenerate as they are of identical frequency - the same can be said for the 4th and 5th mode.
Modes 1,2 and 3 are bending modes, and 4,5 and 6 are stretching modes. Modes 1 and 4 are highly symmetric, and mode 1 is known as the "umbrella mode".
Due to the degeneracy of modes 2 & 3 and of modes 4 & 5, only 4 bands would be expected to be seen in an experimental spectrum of gaseous ammonia. However when comparing this to an IR spectrum for a sample of NH 3, it is clear that only 2 peaks are present - Mode 1 and another peak responsible for Modes 2 & 3. Modes 4, 5 & 6 do not appear on an IR spectrum as one of the selection rules for IR is that the vibration must incur a change in dipole moment, which does not occur for Modes 4-6. This becomes evident when looking at the table - the intensity of the peaks for Modes 4-6 is between 0 and 2, which compared to the intensity of Modes 1 and 2 (around 145 and 13) is miniscule.
Charge analysis
Charge on N-atom: -1.125 (NBO)
Charge on H-atom: 0.375 (NBO)
A negative value for N is expected as N is more electronegative than H and hence can draw electrons towards itself more effectively, giving it a negative charge. H is expected to have a slight positive charge. The molecule has a neutral charge overall as the 3 hydrogens each have a charge of positive 0.375, so altogether 3 x 0.375 = +1.125, so the negative charge of 1.125 of the N is matched.
Optimised N2 molecule
Key data for optimization
| Molecule | N2 |
| Calculation Method | RB3LYP |
| Basis set | 6-31G(d,p) |
| Final energy | [E(RB3LYP)]: -109.52412868 au |
| RMS gradient | 0.0000006 au |
| Point group | Dinf |
Optimisation Results
| N-N Bond length | 1.10550 angstroms |
| N-N Bond Angle | 180 degrees |
(The bond angle is intuitive as we are dealing with a linear diatomic molecule)
 Item                       Value     Threshold  Converged?
 Maximum Force            0.000001     0.000450     YES
 RMS     Force            0.000001     0.000300     YES
 Maximum Displacement     0.000000     0.001800     YES
 RMS     Displacement     0.000000     0.001200     YES
Jmol visualization
test molecule |
Optimised molecule: Gaussview link
Link to the optimised N2 molecule
Vibrational Modes of the optimised N2
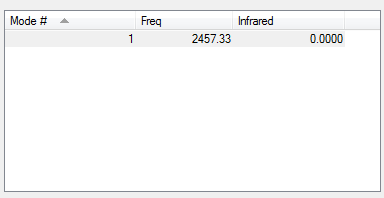
N2 only has one vibrational mode, a symmetrical stretch along the axis of the bond. However in an IR spectrum there is no peak for this stretch (as indicated by the value of 0 for infrared in the table - in order for a vibrational mode to be IR active, the bend or stretch must incur a change in dipole moment, which does not occur for a symmetrical stretch in N2 as the electrons are distributed equally across the bond.
Optimised H2 molecule
Key data for optimization
| Molecule | H2 |
| Calculation Method | RB3LYP |
| Basis set | 6-31G(d,p) |
| Final energy | [E(RB3LYP)]: -1.17853936 au |
| RMS gradient | 0.00000017 au |
| Point group | Dinf |
Optimisation Results
| H-H Bond length | 0.74279 angstroms |
| H-H Bond Angle | 180 degrees |
(The bond angle is intuitive as we are dealing with a linear diatomic molecule)
 Item                       Value     Threshold  Converged?
 Maximum Force            0.000000     0.000450     YES
 RMS     Force            0.000000     0.000300     YES
 Maximum Displacement     0.000000     0.001800     YES
 RMS     Displacement     0.000001     0.001200     YES
Jmol visualization
test molecule |
Vibrational Modes of the optimised H2 molecule
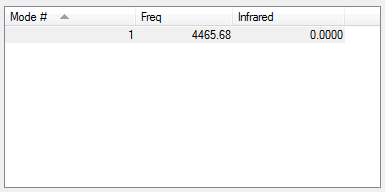
H2 only has one vibrational mode, a symmetrical stretch along the axis of the bond. However in an IR spectrum there is no peak for this stretch (as indicated by the value of 0 for infrared in the table - in order for a vibrational mode to be IR active, the bend or stretch must incur a change in dipole moment, which does not occur for a symmetrical stretch in H2 as the electrons are distributed equally across the bond.
Optimised molecule: Gaussview link
Link to the optimised H2 molecule
The Haber-Bosch Process Reaction Energies
E(NH3): -56.55776873 au
2*E(NH3): -113.11553746 au
E(N2): -109.52412868 au
E(H2): -1.17853936 au
3*E(H2): -3.53561808 au
ΔE=2*E(NH3)-[E(N2)+3*E(H2)]: -0.0557907 au = -146.58 kj/mol (to 2 decimal places)
Since the energy for the reactants is less than the energy of the products, we can conclude that the products are more stable.
Optimised Cl2 molecule
Key data for optimization
| Molecule | Cl2 |
| Calculation Method | RB3LYP |
| Basis set | 6-31G(d,p) |
| Final energy | [E(RB3LYP)]: -920.34987886 au |
| RMS gradient | 0.00002511 au |
| Point group | Dinf |
Optimisation Results
| Cl-Cl | 2.04174 angstroms |
| Cl-Cl Bond Angle | 180 degrees |
(This bond angle is intuitive as we are dealing with a linear diatomic molecule)
Item               Value     Threshold  Converged?
 Maximum Force            0.000043     0.000450     YES
 RMS     Force            0.000043     0.000300     YES
 Maximum Displacement     0.000121     0.001800     YES
 RMS     Displacement     0.000172     0.001200     YES
Vibrational modes of the optimised Cl2 molecule
Cl2 only has one vibrational mode, a symmetrical stretch along the axis of the bond. However in an IR spectrum there is no peak for this stretch (as indicated by the value of 0 for infrared in the table - in order for a vibrational mode to be IR active, the bend or stretch must incur a change in dipole moment, which does not occur for a symmetrical stretch in Cl2 as the electrons are distributed equally across the bond.
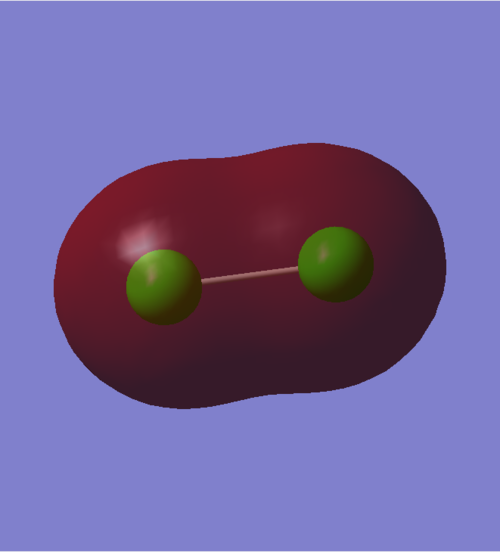
Charge analysis
Since this is a neutral diatomic molecule, the charges on the Cl atoms are identical. They both have the same electronegativity so the charge is not distributed closer to one or the other.
Molecular Orbitals of Cl2

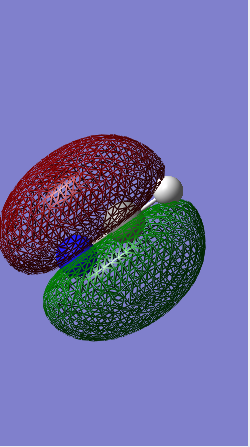
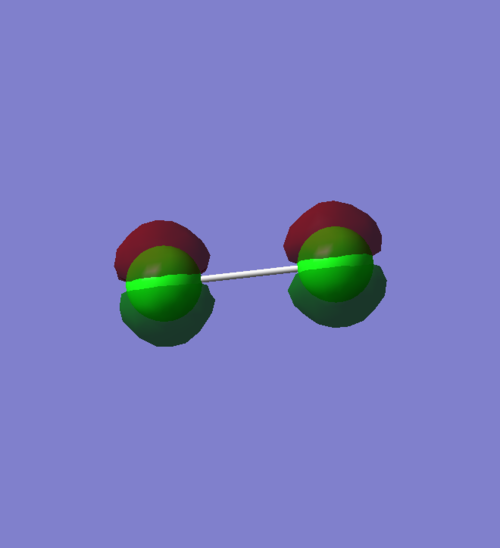
1π orbital
An occupied pi non-bonding orbital that results from two 2px AOs. There is no overlap of orbitals, hence this is non-bonding. The orbitals are orientated in phase, as lobes of the same phase at the centre of the bond are pointed at each other. In terms of energy, its value of -7.28592 compared to the core electrons, e.g. the overlap of 1s MOs, which has an energy of -101.60298, shows that our overlap is not very deep in energy.
1π orbital
An occupied pi non-bonding orbital that results from two 2py AOs. There is no overlap of orbitals, hence this is non-bonding. The orbitals are orientated out of phase, as lobes of similar phase are not on the same side of the plane of the molecule. It has an energy value of -7.27045, which indicates that it is not as deep in energy as the MO for the combination of 2px. AOs.
1π orbital
An occupied pi non-bonding orbital that results from two 2py AOs. There is no overlap of orbitals, hence this is non-bonding. The orbitals are orientated in phase, as the positive and negative lobes of the orbital are situated on the same side of the plane of the molecule. It has an energy value of -7.27043, which indicates that it is less deep in energy than the MO for the combination of 2px AOs and also less deep in energy than the non-bonding orbital π-orbital that results from two 2py AOs.
3σ Molecular orbital
An occupied sigma bonding orbital that results from the in-phase overlap of two 3s^2 AOs. The size of the 3s orbitals is great enough to support an overlap that traverses the long bond distance of the Cl2 molecule (2.04 angstroms). The energy of this MO is -0.93313: if we compare this to that of core electrons, e.g. the overlap of 1s MOs, which has an energy of -101.60298, we can see that our overlap is not very deep in energy. This may be explained by the fact that large orbitals have more diffused electrons and hence the strength of the interaction is not particularly strong.
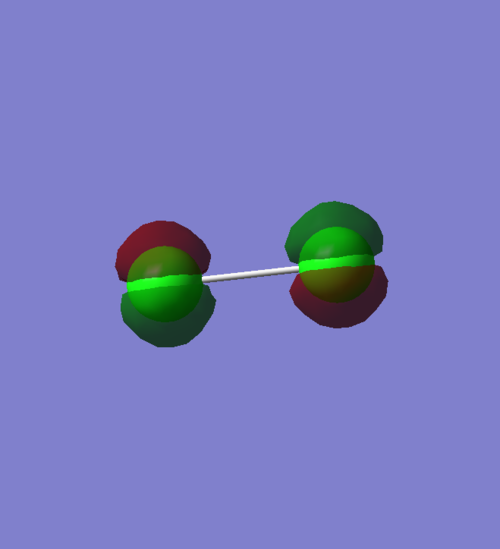
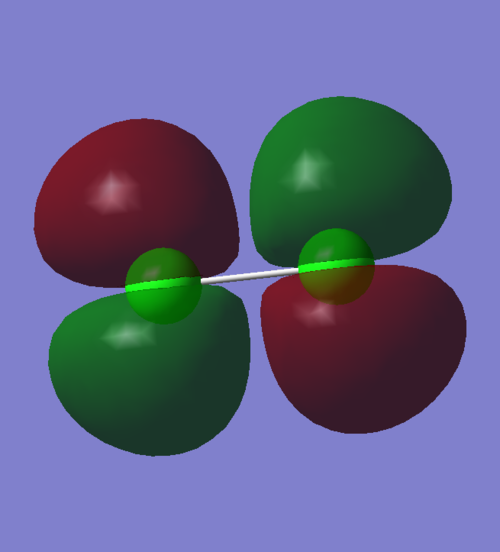
2π Molecular Orbital
An occupied anti-bonding π orbital that results from two 3py AOs combined out of phase. This is less deep in energy than the non-bonding π orbitals that come from the overlap of 2p orbitals.
s-p mixing
Despite all being non-bonding π interactions involving 2p AOs, from our table we can see that there is a slight discrepancy in the energies of the 1π MOs - the combination of 2px AOs leads to the lowest energy MO, followed by the out-of-phase combinations of 2pys and 2pzs, then followed by the in-phase combinations of 2pys and 2pzs. The deeper energy of the MO formed by the 2px AOs is due to s-p mixing; the 2s and 2p orbitals are able to overlap due to the fact that they are both of a similar enough energy to interact, and the added detail that the 2px runs through the centre of the bond means that this overlap is more pronounced, giving it a deeper energy than the other 1π MOs.


