Rep:Mod:01197090
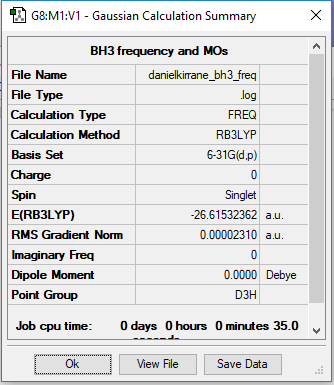
BH3
B3LYP/3-21G level
         Item               Value     Threshold  Converged?
 Maximum Force            0.000046     0.000450     YES
 RMS     Force            0.000023     0.000300     YES
 Maximum Displacement     0.000182     0.001800     YES
 RMS     Displacement     0.000091     0.001200     YES
 Low frequencies ---   -0.4072   -0.1962   -0.0055   25.2514   27.2430   27.2460
 Low frequencies --- 1163.1897 1213.3128 1213.3155
Frequency analysis log file danielkirrane_BH3_freq.log
Jmol for optimised BH3
optimised BH3 molecule |
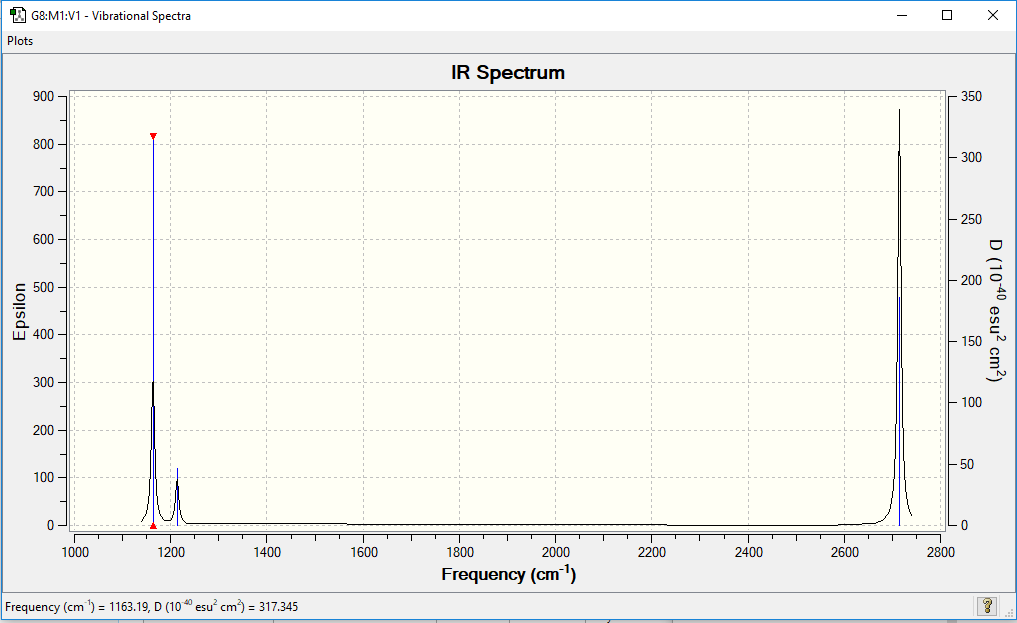
Vibrational spectrum for BH3
| wavenumber (cm-1 | Intensity (arbitrary units) | symmetry | IR active? | type |
| 1213 | 14 | E' | very slight | out-of-plane bend |
| 1163 | 93 | A2" | slight | bend |
| 1213 | 14 | E' | very slight | bend |
| 2715 | 126 | E' | yes | symmetric stretch |
| 2582 | 0 | A" | no | asymmetric stretch |
| 2715 | 126 | E' | yes | asymmetric stretch |
There are fewer vibrational peaks, 3 in this spectrum than there are vibrational modes, 6 because 1 of the vibrations is IR inactive. This is because it is a symmetric stretch meaning there is no change in dipole moment, a requirement for a stretch/ bend to appear in an IR spectrum. Furthermore, there are two modes which share the same vibrational frequency, thus they overlap and show up as a single peak on the spectrum. These two factors cause there to be only 3 vibrational peaks on the above spectrum.
Figure [1]
The Qualitative MO diagram provides a good estimation of the molecular orbitals, the shape and orientations of the orbitals are very similar to each other The difference between the Gaussian calculated orbitals and those from LCAO is that Gaussian uses a delocalisation model whereas the other has hard spheres of electron density. However, despite this difference the LCAO method provides a sufficiently accurate description of the orbitals and allows for the determination of order of the AOs and which are able to combine to form the MOs.
Ng611 (talk) 16:37, 5 June 2019 (BST) Yes but there are more significant differences. Can you spot them?
NH3 + BH3 → NH3BH3
Ng611 (talk) 16:41, 5 June 2019 (BST) Where are the other items?
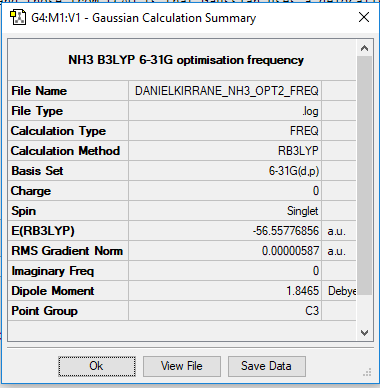
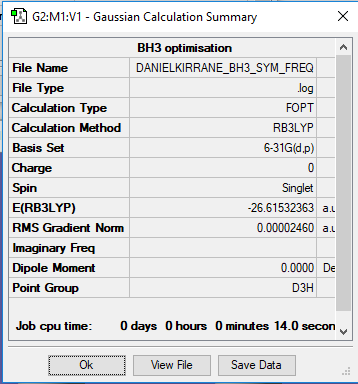
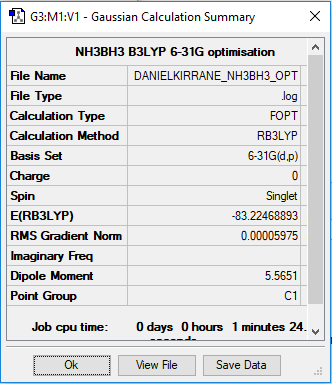
The above images show the summary tables and include the energies reported in a.u of the individual ammonia and borane molecules and then the combined NH3BH3. The accuracy of energy calculation is known to be 0.019 Eh or about 5 kJmol-1
E(NH3)= -56.56 ± 0.019 Eh
E(BH3)= -26.62 ± 0.019 Eh
E(NH3BH3)= -83.22 ± 0.019 Eh
ΔE = E(NH3BH3) - [E(NH3)+E(BH3)] = -83.22 - ((-26.62) + (-56.56)) = -0.04 ± 0.057 Eh = -105.02 ± 15 kJmol-1
ΔE is the bond energy of the N-B bond.
Ng611 (talk) 16:44, 5 June 2019 (BST) You've rounded too early and this had led you to the wrong result. Remember that your values are accurate to 5 d.p. (~ 1kJ/mol) and your results should reflect this.
When comparing the value of bond energy for the N-B bond in H3BNH3 with the E(C-C) = 368 kJmol-1 in an ethane molecule [3] , H3CCH3, it can be seen that the E(N-B) is particularly low. The N-B dative bond is weak when compared to similar types.
Ng611 (talk) 16:45, 5 June 2019 (BST) Try to use a book reference here instead of a web reference.
The calculations performed were all using the 6-31G(d,p) basis set.
Links for the log files for optimised BH3, NH3 and NH3BH3 molecules:
danielkirrane_nh3bh3_opt_freq.log danielkirrane_nh3_opt2_freq.log danielkirrane_BH3_freq.log
NI3 molecule
         Item               Value     Threshold  Converged?
 Maximum Force            0.000094     0.000450     YES
 RMS     Force            0.000049     0.000300     YES
 Maximum Displacement     0.001087     0.001800     YES
 RMS     Displacement     0.000610     0.001200     YES
 Low frequencies ---  -12.7180  -12.7119   -6.4126   -0.0039    0.0189    0.0621
 Low frequencies ---  101.0754  101.0761  147.4556
Jmol for optimised NI3 molecule
optimised NI3 molecule |
N-I bond distance was measured as 2.184 Å
Frequency analysis log file danielkirrane_ni3_opt4_freq.log
Ionic Liquids Project
Charge Distribution investigation:
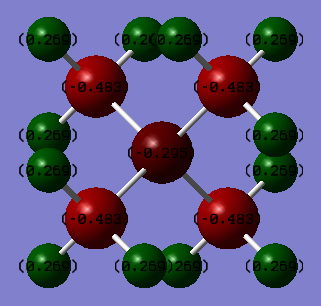
[N(CH3)4]+ atomic charges, are dipole units in Debeye and are only accurate to 0.01 Debeye
N: -0.30 H: 0.27 C: -0.48
If each atomic charge is multiplied by the number of the respective atom, the total charges are as follows:
N total charge: -0.30 x 1 = -0.30 H total charge: 0.27 x 12 = 3.24 C total charge: -0.48 x 4 = -1.92
Molecule total charge = - 0.30 + 3.24 - 1.92 = 1.02
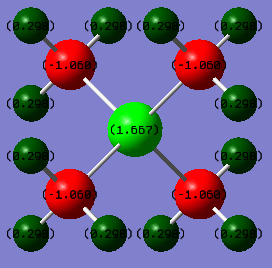
[P(CH3)4]+ atomic charges:
P: 1.67 H: 0.30 C: -1.06
If each atomic charge is multiplied by the number of the respective atom, the total charges are as follows:
P total charge: 1.67 x 1 = 1.67 H total charge: 0.3- x 12 = 3.60 C total charge: -1.06 x 4 = -4.24
Molecule total charge = 1.67 + 3.60 - 4.24 = 1.03
Formal Charge = Group Number - 1/2(Number of electrons in covalent bonds) - Number of electrons in lone pairs [2]
Applying the above equation to the [N(CH3)4]+ case:
Formal Charge on central N atom = 5 - 1/2(8) = + 1
The above result shows that the formal charge on the N atom is positive 1. However, as the above atomic charge tables indicate, using the Gaussian software, the charge distributions which are shown in the above screenshots indicate a much more delocalised system in which all of the positive charge is located on the outer Hydrogen atoms. Furthermore, in contrary to the formal charge calculation, the N was found to have a negative charge. The carbon atoms also gave a negative value for charge and was the more negative than the N. This contradicts the theory of electronegativity which would have predicted that the more electronegative N to have a great portion of the negative charge. However, one can explain the positive charge on the Hydrogen atoms as it is the most electropositive atom in the tetramethylammonium cation. But, it is believed that one is unable to fully explain the charge distribution of this molecule using electronegativity but through MO theory an accurate picture of the molecule can be visualised.
Applying the formal charge equation to [P(CH3)4]+:
Formal Charge on central P atom = 5 - 1/2(8) = + 1
As before, the above calculation suggests that there is a + 1 charge on the central Phosphorous atom. Unlike in the [N(CH3)4]+ case which the formal charge calculation directly disagreed with the Gaussian calculation, the P atom is in fact found to be the most positively charge atom within the molecule. Using the Pauling electronegativity scale we can explain this, Phosphorous is more electroposotive than Carbon, meaning it is more willing to get rid of negative charge or is less able to hold negative charge on itself. The Gaussian calculation shows this to be true as the four Carbons are the only negative atoms in the molecule.
A comparison of the two charge distributions for [P(CH3)4]+ and [N(CH3)4]+ :
In [P(CH3)4]+ the carbon has a more significantly negative charge on it, this agrees with the Pauling electronegativity scale as it is the most electronegative atom and thus should be best placed to accept electron density and negative charge. A notable difference between the two tetramethyl cations is the charges on the Hydrogens. It is by far and away the most electroposotive atom in [N(CH3)4]+ but the difference between the electronegativity of P and H in [P(CH3)4]+ is far greater than that between C and H in [N(CH3)4]+.
Jmol for optimised [N(CH3)4]+
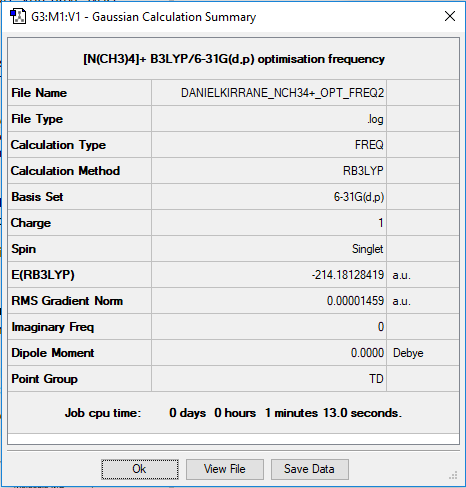
Item Table and Low Frequencies for [N(CH3)4]+
         Item               Value     Threshold  Converged?
Maximum Force            0.000025     0.000450     YES
RMS     Force            0.000015     0.000300     YES
Maximum Displacement     0.000158     0.001800     YES
RMS     Displacement     0.000089     0.001200     YES
Low frequencies ---   -0.0008   -0.0007   -0.0004   21.3549   21.3549   21.3549
Low frequencies ---  188.2284  292.4280  292.4280
Summary Table for [N(CH3)4]+
Frequency analysis log file DANIELKIRRANE_NCH34+_OPT_FREQ2.log
Jmol for optimised [P(CH3)4]+
Item Table and Low Frequencies for [P(CH3)4]+
         Item               Value     Threshold  Converged?
Maximum Force            0.000027     0.000450     YES
RMS     Force            0.000022     0.000300     YES
Maximum Displacement     0.000436     0.001800     YES
RMS     Displacement     0.000388     0.001200     YES
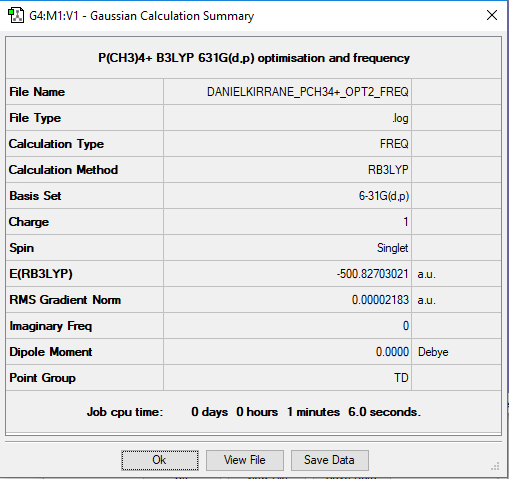
Low frequencies ---    0.0005    0.0012    0.0013   26.3157   26.3157   26.3157
Low frequencies ---  160.9744  195.4740  195.4740
Summary Table for [P(CH3)4]+
Frequency analysis log file DANIELKIRRANE_PCH34+_OPT2_FREQ.log
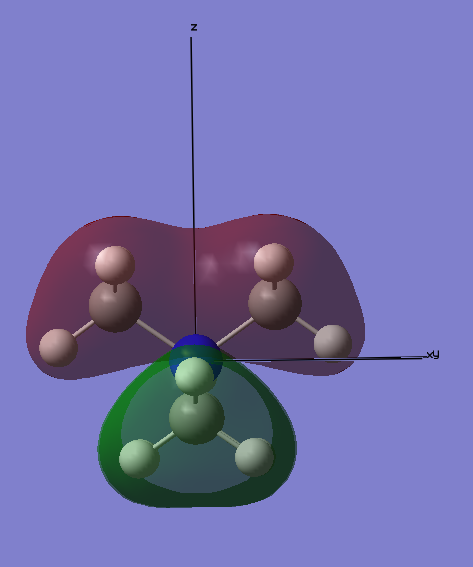
MO Investigation:
The following valence orbitals were investigated:
MO7:
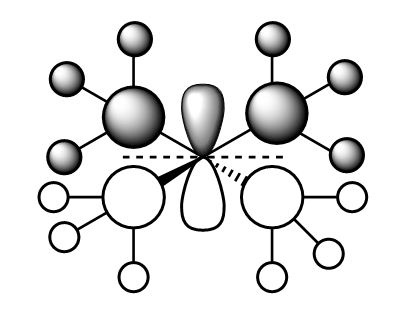
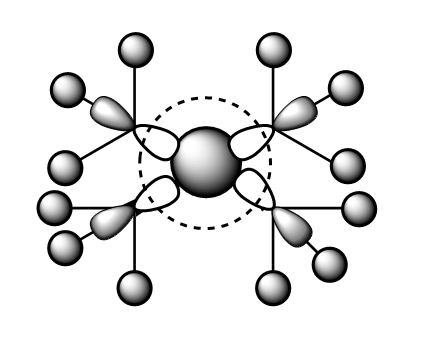
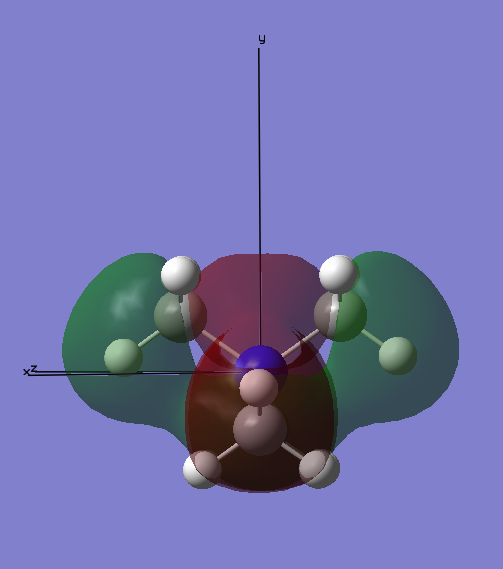
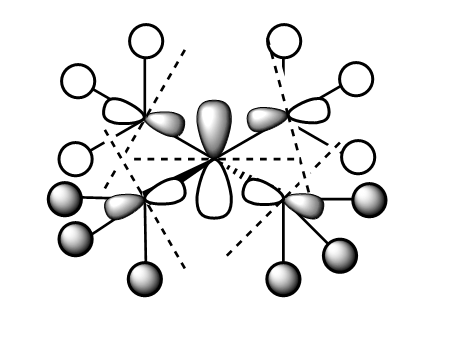
In this Molecular Orbital, there is a node located through the centre of the N atom, and lies along the xy plane, orthogonal to the pz orbital which is involved in the bonding. Overall, this MO is can be classed as bonding as the orbitals on either side of the node are in phase and interact strongly, thus lowering the energy of the molecule.
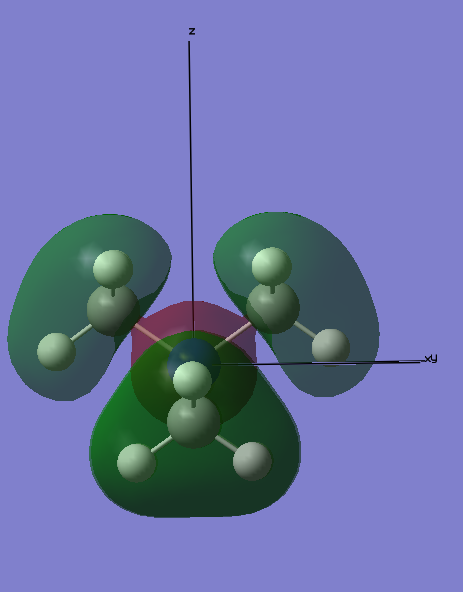
MO10:
This molecular orbital has a spherical node surrounding the 2s on the N atom, it lies between the out-of-phase interaction of the 2s N and 2p C orbitals. All of the Me groups are in phase and have strong bonding interactions with the other Me groups surrounding the central N atom. However, the out-of-phase interaction previously mentioned cancel this out and overall this MO is non-bonding.
Ng611 (talk) 16:51, 5 June 2019 (BST) Your FOs here should be s-type not p-type. Those small nubs of electron density along the bonds are negligible.
MO12:
This MO has 5 5 different nodes and is thus relatively high in energy. However, it is believed to be a bonding orbital. The 2p orbital on the N atom has strong in-phase interactions with the 2p orbitals on each Carbon atom. In addition, each Me group H atoms are in phase with the 2p orbital on the Carbon. A potential unfavourable interaction is between across the central node which bisects the py orbital on N. However, this is not thought to be significant and thus this orbital is a bonding orbital.
Ng611 (talk) 16:51, 5 June 2019 (BST) Some very good LCAO analysis. I'd label the key orbital interactions on the diagram instead of writing them in a paragraph the diagram.
Bibliography
[1] : http://www.huntresearchgroup.org.uk/teaching/teaching_comp_lab_year2a/Tut_MO_diagram_BH3.pdf
[2]: http://www.chem.ucalgary.ca/courses/351/Carey5th/Ch01/ch1-3-2.html
[3]: http://www.chem.ucalgary.ca/courses/350/Carey5th/useful/bonde.html

