Rep:Mod:01196499
Introduction
The Wiki page for Introduction to Molecular Modelling 2. Submitted by Peter Gobbett
NH3 Molecule
Calculation Data
| Key Information | ||
|---|---|---|
| Common Name | Ammonia | |
| Molecular Formula | NH3 | |
| Calculation Method | RB3LYP | |
| Basis Set | 6-31G(D.P) | |
| Final Energy (RB3LYP) | -56.55776873 a.u. | |
| RMS Gradient | 0.00000485 a.u. | |
| Point Group | C3v | |
| Optimised N-H Bond Distance | 1.01798A | |
| Optimised H-N-H Bond Angle | 105.741o | |
Item Table
Item               Value     Threshold  Converged?
 Maximum Force            0.000004     0.000450     YES
 RMS     Force            0.000004     0.000300     YES
 Maximum Displacement     0.000072     0.001800     YES
 RMS     Displacement     0.000035     0.001200     YES
Molecular Model
NH3 |
Click this link for the full .log file
Frequency Analysis
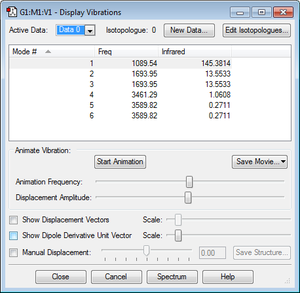
| Frequency Analysis | ||
|---|---|---|
| No. of Modes (3N-6) | 6 | |
| Degenerate Modes | Modes 2&3, Modes 5&6 | |
| "Bending" vibration modes | 1, 2, 3 | |
| "Bond Stretch" vibration modes | 4, 5, 6 | |
| Mode of Highest Symmetry | 4 | |
| "Umbrella" vibration mode | 1 | |
| Bands in experimental spectrum | 4 in therory (due to two degenerate pairs) but it is likely only modes 1 and 2&3 would be distinguishable above noise. 4 and 5&6 each have both high frequency and low intensity. | |
Charge Analysis

The above image shows the charge distribution in the optimised NH3 molecule. The Nitrogen is negatively charged and each Hydrogen atom has a slight partial positive charge. This difference is reinforced by theory, with the concept of electronegativity. Nitrogen is far more electronegative than Hydrogen, thus is better able to attract bonding electrons to itself. This accounts for the differences in charge. Thus, although the bonds are covalent, they have slight ionic character due to the difference in electronegativity. Thus they are polar bonds.
H2 Molecule
Calculation Data
| Key Information | ||
|---|---|---|
| Common Name | Hydrogen | |
| Molecular Formula | H2 | |
| Calculation Method | RB3LYP | |
| Basis Set | 6-31G(D.P) | |
| Final Energy (RB3LYP) | -1.17853930 a.u. | |
| RMS Gradient | 0.00012170 a.u. | |
| Point Group | D∞h | |
| Bond Length Analysis | ||
| Calculated Bond Length H-H | 0.74309A | |
| Literature Bond Length H-H[1] | 0.74A | |
| Comment | The calculated bond length is equal to the literature reference, so the Gaussian model is highly accurate. | |
Item Table
Item               Value     Threshold  Converged?
 Maximum Force            0.000211     0.000450     YES
 RMS     Force            0.000211     0.000300     YES
 Maximum Displacement     0.000278     0.001800     YES
 RMS     Displacement     0.000393     0.001200     YES
Molecular Model
H2 |
Click this link for the full .log file
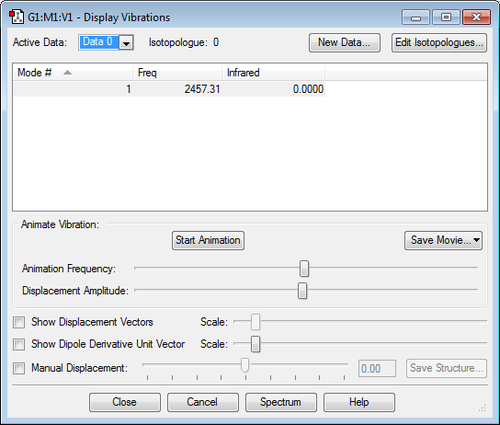
Frequency Analysis
Charge Analysis

The above image shows the charge distribution in the optimised H2 molecule. The molecule is diatomic and of the same element, thus there is no charge difference and the bond is fully covalent.
N2 Molecule
Calculation Data
| Key Information | ||
|---|---|---|
| Common Name | Nitrogen | |
| Molecular Formula | N2 | |
| Calculation Method | RB3LYP | |
| Basis Set | 6-31G(D.P) | |
| Final Energy (RB3LYP) | -109.52412868 a.u. | |
| RMS Gradient | 0.00000365 a.u. | |
| Point Group | D∞h | |
| Bond Length Analysis | ||
| Calculated Bond Length N-N | 1.10550A | |
| Literature Bond Length N-N[2] | 1.0976A | |
| Comment | The calculated bond length is very close to the literature reference, so the Gaussian model is highly accurate. | |
Item Table
Item               Value     Threshold  Converged?
 Maximum Force            0.000006     0.000450     YES
 RMS     Force            0.000006     0.000300     YES
 Maximum Displacement     0.000002     0.001800     YES
 RMS     Displacement     0.000003     0.001200     YES
Molecular Model
N2 |
Click this link for the full .log file
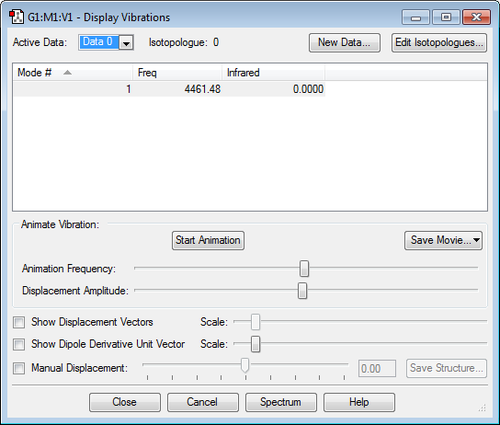
Frequency Analysis
Charge Analysis
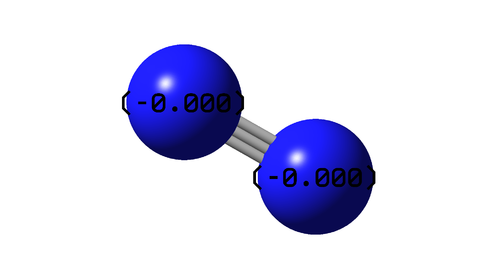
The above image shows the charge distribution in the optimised N2 molecule. The molecule is diatomic and of the same element, thus there is no charge difference and the bond is fully covalent.
Reaction Energies
Haber–Bosch process : 3H2 + N2 → 2NH3
| Energy Data | ||
|---|---|---|
| E (NH3) | -56.55776873 a.u. | |
| 2x E (NH3) | -113.1155375 a.u. | |
| E (N2) | -109.52412868 a.u. | |
| E (H2) | -1.17853930 a.u. | |
| 3x E (H2) | -3.5356179 a.u. | |
| ΔE | -0.05579092 a.u. | |
| ΔE | -146.479071618 kJmol-1 | |
| Comments | The reaction is exothermic. Thus, the product (NH3) must be thermodynamically more stable than the reactants (H2 and N2). | |
F2 Molecule
Calculation Data
| Key Information | ||
|---|---|---|
| Common Name | Fluorine | |
| Molecular Formula | F2 | |
| Calculation Method | RB3LYP | |
| Basis Set | 6-31G(D.P) | |
| Final Energy (RB3LYP) | -199.49825218 a.u. | |
| RMS Gradient | 0.00007365 a.u. | |
| Point Group | D∞h | |
| Bond Length Analysis | ||
| Calculated Bond Length F-F | 1.40281A | |
| Literature Bond Length F-F[3] | 1.45A | |
| Comment | The calculated bond length is very close to the literature reference, so the Gaussian model is highly accurate. | |
Item Table
Item               Value     Threshold  Converged?
 Maximum Force            0.000128     0.000450     YES
 RMS     Force            0.000128     0.000300     YES
 Maximum Displacement     0.000156     0.001800     YES
 RMS     Displacement     0.000221     0.001200     YES
Molecular Model
F2 |
Click this link for the full .log file
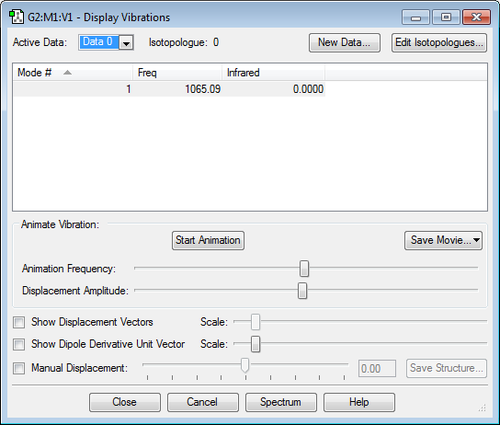
Frequency Analysis
Charge Analysis

The above image shows the charge distribution in the optimised F2 molecule. The molecule is diatomic and of the same element, thus there is no charge difference and the bond is fully covalent.
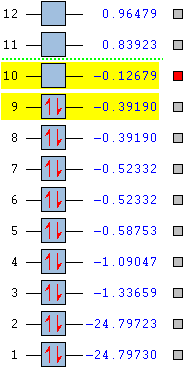
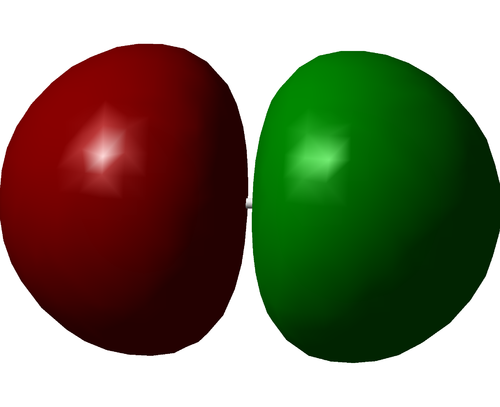
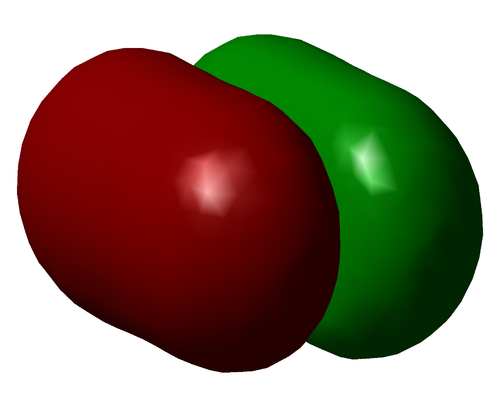
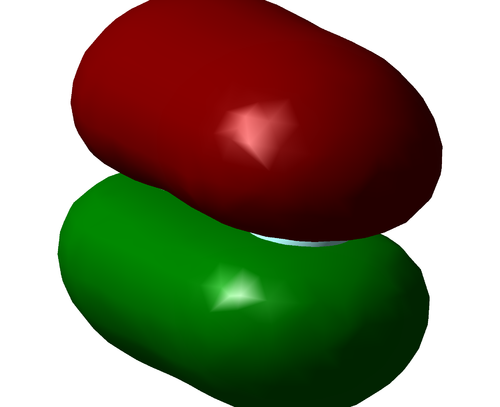
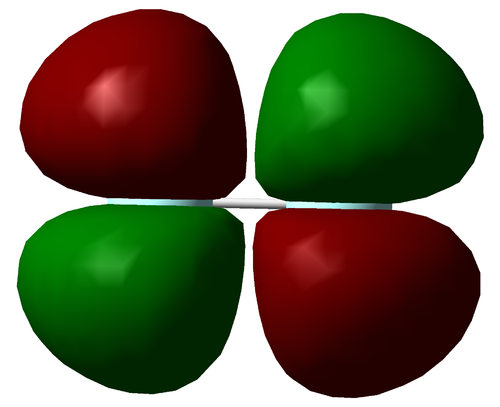
Molecular Orbitals
ClF3 Molecule
Calculation Data
| Key Information | ||
|---|---|---|
| Common Name | Sarin | |
| Molecular Formula | ClF3 | |
| Calculation Method | RB3LYP | |
| Basis Set | 6-31G(D.P) | |
| Final Energy (RB3LYP) | -759.46531688 a.u. | |
| RMS Gradient | 0.00002465 a.u. | |
| Point Group | C2v | |
| Bond Length Analysis | ||
| Calculated Bond Length Cl-F | 1.72863A and 1.65143A | |
| Literature Bond Length Cl-F[4] | 1.698A and 1.598A | |
| Comment | The calculated bond length is fairly close to the literature reference, so the Gaussian model is accurate. | |
Item Table
 Item               Value     Threshold  Converged?
 Maximum Force            0.000050     0.000450     YES
 RMS     Force            0.000028     0.000300     YES
 Maximum Displacement     0.000204     0.001800     YES
 RMS     Displacement     0.000134     0.001200     YES
Molecular Model
Sarin |
Click this link for the full .log file
Frequency Analysis
Charge Analysis
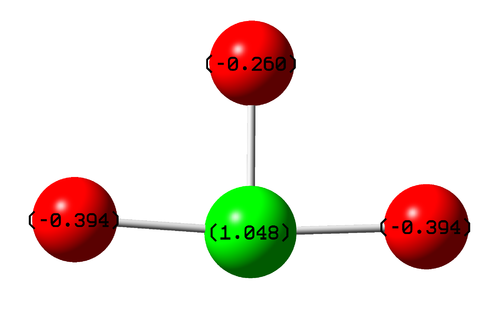
Clearly, the more electronegative fluorine molecules are more negatively charged than the central chlorine atom (comparatively, the more electropostive atom). The model also shows that there is a disparity between the charges of the axial fluorine atoms and the equatorial fluorine. I would hypothesize that this is due to the differing bond lengths, with the axial fluorines being further away from the electropostive chlorine. However, the method of charge analysis Gaussian uses is not based on electronegativity values, so no quantitative analysis can be made.
Sarin Molecule
Calculation Data
| Key Information | ||
|---|---|---|
| Common Name | Sarin | |
| Molecular Formula | (CH3)2CHOP(O)(CH3)F | |
| Calculation Method | RB3LYP | |
| Basis Set | 6-31G(D.P) | |
| Final Energy (RB3LYP) | -750.20043140 a.u. | |
| RMS Gradient | 0.00000766 a.u. | |
| Point Group | None | |
Item Table
 Item               Value     Threshold  Converged?
 Maximum Force            0.000026     0.000450     YES
 RMS     Force            0.000004     0.000300     YES
 Maximum Displacement     0.001100     0.001800     YES
 RMS     Displacement     0.000250     0.001200     YES
Molecular Model
Sarin |
Click this link for the full .log file
Frequency Analysis

Charge Analysis

The charge distribution for Sarin is very interesting.
All three CH3 group carbons have a slight negative charge, on account of each being bonded to three more electropositive hydrogen atoms. The CH3 carbon bonded to the central phosphorus atom is especially negative, on account of the significant (relative) electropositivity of the phosphorus atom.
The carbon of the CH group is slightly positively charged, on account of being bonded to three more electronegative atoms. The main contributor is likely the oxygen atom; oxygen is significantly more electronegative than carbon.
Both oxygen atoms are negatively charged. The fluorine atom is also negatively charged. This makes sense, as oxygen and fluorine are the two most electronegative elements known. The numerical disparity shown in the image is likely due to the functions Gaussian is using, as it does not account for electronegativity. Hence, no quantitative analysis is possible.
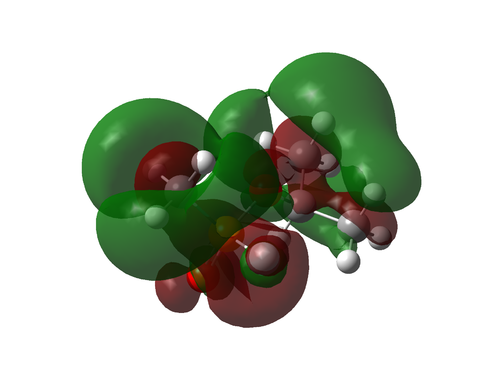
Molecular Orbitals
| Bonding | ||
|---|---|---|
 |
| Complexity increases | ||
|---|---|---|
 | ||
 | ||
 |
| HOMO | ||
|---|---|---|
 |
| LUMO | ||
|---|---|---|
 |
| Number 42 | ||
|---|---|---|
 |
References
- ↑ Chung Chieh (2006). "Bond Lengths and Energies" http://www.science.uwaterloo.ca/~cchieh/cact/c120/bondel.html (Accessed at 12:03 on 10/03/2017
- ↑ Greenwood and Earnshaw (1984). "Chemistry of the Elements, pp. 412–6."
- ↑ Brockway, L. O. (1938). "The Internuclear Distance in the Fluorine Molecule". Journal of the American Chemical Society. 60 (6): 1348–1349. http://pubs.acs.org/doi/abs/10.1021/ja01273a021 (Accessed at 11:53 on 10/03/2017)
- ↑ Smith, D. F. (1953). "The Microwave Spectrum and Structure of Chlorine Trifluoride". The Journal of Chemical Physics. 21 (4): 609–614. http://aip.scitation.org/doi/10.1063/1.1698976 (Accessed at 11:44 on 10/03/2017)

