Rep:Mod:00636773Organic
Introduction
Throughout this exercise, computational analysis was used extensively to optimise and analyse small to medium sized molecules:
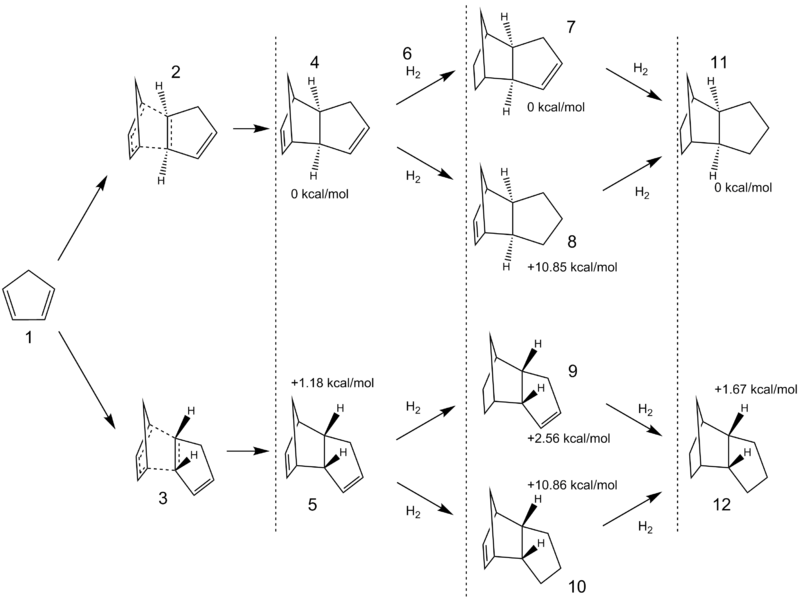
- The dimerisation and subsequent hydrogenation of cyclopentadiene was computed at a thermodynamic and kinetic level to reveal an unexpected pair of transition states.
- A set of intermediates for the ovarian cancer treatment drug Taxol were computed to explain part of the synthesis path.
- The crystal structures of two epoxidation catalysts, Shi's and Jacobsen's, were investigated to justify the formation of asymmetric epoxides.
- The energies of the transition states of various alkenes with the aforementioned catalysts were compared to predict the enantioselectivity of the catalysts, and then compared to literature.
- QTAIM and NCI analysis were performed on some of the alkenes to justify their approach to the Shi catalyst. In addition, NMR was computed and compared to literature.
Part 1
The following calculations were performed using 6-31G(d,p) basis sets.
Cyclopentadiene Dimer
Cyclopentadiene undergoes dimerisation at room temperature. The dimer itself can be irreversibly hydrogenated to form structures 7-12. The transition states of the dimerisation were investigated, followed by the thermodynamic properties of the hydrogenated products.
Dimerisation and Hydrogenation
| Property: | Molecule: | |||||||||||
|---|---|---|---|---|---|---|---|---|---|---|---|---|
| 1 | 2 | 3 | 4 | 5 | 6 | 7 | 8 | 9 | 10 | 11 | 12 | |
| Energy (a.u.): | -194.11069027 | -388.18572928 | -388.24777827 | -388.24602159 | -1.17853934 | -389.49238672 | -389.47624540 | -389.48858582 | -389.47623236 | -390.72080837 | -390.71832281 | |
| Imaginary Frequency: | -458.20 cm-1 | |||||||||||
| Bond Lengths (forming/breaking)/Å: | 2.505/2.059 | 1.578/1.570 | 1.581/1.572 | 1.556/1.548 | 1.573/1.573 | 1.561/1.552 | 1.574/1.574 | 1.551/1.551 | 1.555/1.555 | |||
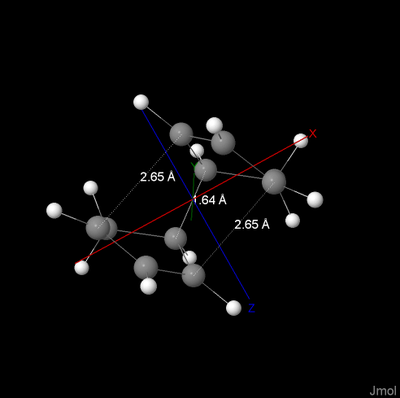
From the data, the dimerisation of 1 to 4 is 1.10 kcal·mol-1 more favourable than 1 to 5 (-16.56 kcal·mol-1 and -15.46 kcal·mol-1 respectively). After 3 days of calculations, structure 3 was not located. Instead, the below bis-pericyclic transition state structure 3a was found[1][2]. This structure has an interesting C2 symmetry through the y-axis perpendicular to the initial C-C bond (shown as 1.84Å), and is known as a bifurcation point. The distances 2.86Å indicate the two paths the dimerisation can take - both of which would lead to the desired endo product 5.
| 3a: | 3b: |
|---|---|

|
|
| Click images to view Jmol files | |
The dissimilarity between 2 and 3 in terms of their reaction profiles is explained by the former's lack of symmetry in its formation's approach path. With an energy of -388.19473422 a.u., 3a is 5.6507 kcal·mol-1 more favourable than 2, and serves as an intermediate-to-an-intermediate to 5, making 5 the favourable product. A complete analysis on the reaction profile would be computationally expensive as well as difficult due to the C2 symmetry, however this is clearly not a Diels-Alder reaction.
Later, a second transition state 3b was found. With an energy of -388.1946001 a.u. this is just 0.084 kcal·mol-1 higher in energy. It would be the result of bringing the molecules closer together such that the original partial bond is nearly a full bond.
Using ChemBio, 4 was optimised to 78.3911 kcal·mol-1 and 5 was optimised to 78.3503 kcal·mol-1 in steric energy, showing that the exo product is less favoured.
9 was shown to have a lower 6-31G(d,p) energy (-7.7519 kcal·mol-1) than 10, and so was the preferred hydrogenation product.
Taxol
Intermediates A and B undergo rearrangement reactions to enols, and subsequently Cope rearrangements to form terminal alkenes.
Relative Stabilities of A and B
| Property: | Molecule: | |
|---|---|---|
| Taxol Intermediate A | Taxol Intermediate B | |
| Energy (a.u.): | -738.70264776 | -738.69606604 |
The intermediate structures are shown below alongside their respective Cope Rearrangement transition states following enolisation. These intramolecular reactions occur without external forces and serve as a pathway for the structures to rearrange to each other. As seen from the table above, A is the preferred thermodynamic product (by 4.1301 kcal·mol-1). Considering intramolecular reactions tend to have high rates of reactions, A is probably the most commonly seen molecule.
The 6 important separations within each molecule are highlighted as distances. The imaginary frequencies are shown as Jmol files to visualise how the rearrangement would take place.
| Intermediate A: | Intermediate B: |
|---|---|

|

|
| Click images to view Jmol files | |
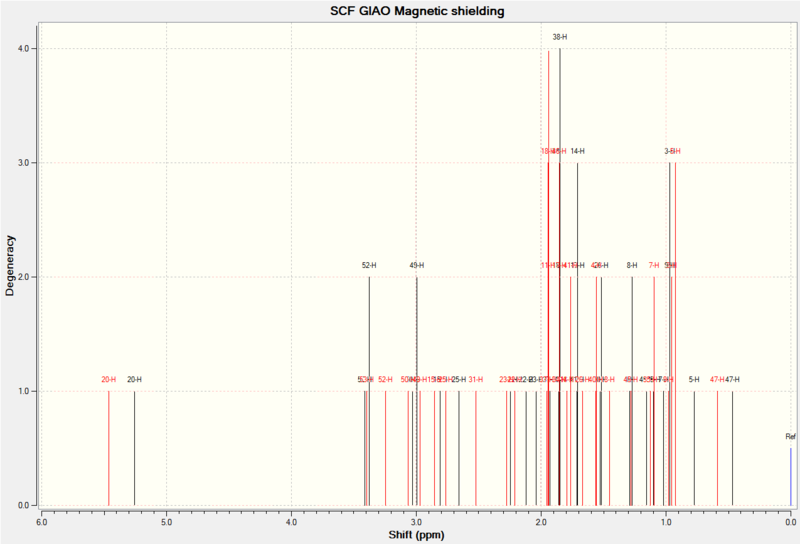
NMR Spectroscopy of 18
The NMR was computed for intermediate structure 18 using 6-31G(d,p) and 6-311++G(2df,p) theories, and 17 was optimised using the same basis sets and solvation to compared their energies.
| Structure 18: | Structure 17: |
|---|---|

|

|
| Click image to view Jmol file | |
Upon heating, 17 converts to its thermodynamic product 18[3]. 17 and 18 were computed and compared using the two basis sets.
| Simulated Proton NMR |
|---|
|
| Simulated Carbon NMR |

|
| Proton NMR Results (δ/ppm): | ||||
|---|---|---|---|---|
| Proton: | 6-31G(d,p): | 6-311++G(2df,p): | Reference[4]: | As can be seen from the results, the stronger basis set lowers the average chemical shift and brings it closer to the reference. Some peaks can be compared such as the alkene proton at 5.21ppm. Otherwise the spectra are not close enough to be valuable. |
| 20 | 5.45 | 5.25 | 5.21 | |
| 53 | 3.39 | 3.41 | 3.00-2.70 | |
| 52 | 3.24 | 3.38 | ||
| 50 | 3.06 | 3.03 | ||
| 49 | 2.97 | 2.99 | ||
| 15 | 2.85 | 2.81 | ||
| 25 | 2.75 | 2.66 | ||
| 31 | 2.52 | 2.25 | 2.70-2.35 | |
| 22 | 2.21 | 2.12 | ||
| 23 | 2.27 | 2.04 | ||
| 37 | 1.95 | 1.93 | ||
| 11 | 1.94 | 1.86 | 2.20-1.70 | |
| 18 | 1.94 | 1.86 | ||
| 34 | 1.85 | 1.85 | ||
| 38 | 1.94 | 1.85 | ||
| 46 | 1.85 | 1.79 | ||
| 41 | 1.76 | 1.71 | ||
| 17 | 1.85 | 1.71 | 1.58 | |
| 14 | 1.79 | 1.71 | 1.50-1.20 | |
| 40 | 1.56 | 1.53 | ||
| 26 | 1.66 | 1.52 | ||
| 4 | 1.55 | 1.29 | 1.10 | |
| 8 | 1.45 | 1.27 | ||
| 45 | 1.28 | 1.15 | ||
| 35 | 1.12 | 1.10 | 1.07 | |
| 7 | 1.09 | 1.02 | ||
| 9 | 0.98 | 0.97 | ||
| 3 | 0.95 | 0.97 | 1.03 | |
| 5 | 0.92 | 0.77 | ||
| 47 | 0.59 | 0.47 | ||
| Carbon NMR Results (δ/ppm): | ||||
|---|---|---|---|---|
| Carbon: | 6-31G(d,p): | 6-311++G(2df,p): | Reference[4]: | The carbon NMR also has a poor correlation to the literature, with only a few comparable carbons. Worse yet, the better basis set overshoots the chemical shift. This might be down to a shift reference error, an incorrect job or that the structure is not the lowest energy conformation. |
| 27 | 212.34 | 228.15 | 211.49 | |
| 12 | 142.73 | 155.91 | 148.72 | |
| 19 | 122.21 | 131.29 | 120.90 | |
| 32 | 92.97 | 96.28 | 74.61 | |
| 30 | 65.09 | 69.11 | 60.53 | |
| 29 | 58.67 | 63.63 | 51.30 | |
| 10 | 54.02 | 56.81 | 50.94 | |
| 1 | 50.69 | 55.57 | 45.53 | |
| 51 | 46.66 | 50.88 | 43.28 | |
| 36 | 43.47 | 45.85 | 40.82 | |
| 48 | 39.60 | 43.06 | 38.73 | |
| 21 | 37.13 | 38.60 | 36.78 | |
| 24 | 36.45 | 37.61 | 35.47 | |
| 33 | 31.62 | 33.20 | 30.84 | |
| 16 | 28.63 | 29.41 | 30.00 | |
| 44 | 25.18 | 26.31 | 25.56 | |
| 2 | 25.00 | 26.38 | 25.35 | |
| 13 | 24.54 | 25.39 | 22.21 | |
| 6 | 23.16 | 22.57 | 21.39 | |
| 39 | 22.70 | 23.30 | 19.83 | |
The results of this were not entirely satisfactory, even when computed with a better basis set. More work would have to be done to identify the exact conformation.
| Property: | Molecule: | |
|---|---|---|
| Taxol Intermediate 18 | Taxol Intermediate 17 | |
| Energy/6-31G(d,p) (a.u.): | -1651.87752615 | -1651.79840385 |
Intermediate was shown to be the lower energy enantiomer as expected by 49.65 kcal·mol-1.
Part 2
Shi Asymmetric Catalyst
Various aspects of Shi's catalyst were investigated, including the choice of sugar and protecting groups, down to the molecular orbitals in order to explain the enantioselectivity of the catalyst.
Shi Crystal Structure
| Shi Catalyst: |
|---|

|
| Click image to view Jmol file |
Looking at the crystal structure of the Shi catalyst, there is a notable anomeric effect that holds the anomeric oxygen in the axial position. When this is then locked in position by the protecting group, there is a severe steric hindrance to that side of the dioxirane. This plays a particularly important role in the enantioselectivity of the catalyst.
| Shi LUMO: | Shi/Dihydronaphthalene TS: |
|---|---|

|

|
It can be seen that the pi system of the alkene matches the symmetry of the LUMO of the Shi Catalyst in a spiro configuration, and such a match would weaken the dioxirane bond. The alkene hydrogens would tend to sp3 hybridisation paving the way for epoxidation.
Importantly, the methyl groups provide steric energy that raises the energy of this conformation. As comparison the highest and the lowest energy conformations are given. This steric hindrence provides an explanation as to why one enantiomer is preferred over the other.
A closer look at the structure with the groups removed shows the difference between the energetically favoured spiro mechanism and non-spiro shows the importance of the protecting groups in the enantioselectivity:
| Shi LUMO: | Shi/Dihydronaphthalene TS: |
|---|---|

|

|
Jacobsen Asymmetric Catalyst
Jacobsen Crystal Structure
| Jacobsen Catalyst: |
|---|

|
| Click image to view Jmol file |
Between each of the closest methyl groups, the shortest distances were drawn as above. Only one NCI comes within the Van der Waals diameter of hydrogen (2.4Å).
The angles around the Manganese show that the metal centre is square pyramidal and has an open active face. From this face there are two notable areas:
- The tert-butyl groups provide significant steric hindrence preventing any large R groups approaching from that angle.
- The axial hydrogen of the cyclohexane group provides asymmetrical hindrence thus controlling the configuration of the product.
Alkene Epoxidation
Shi-Dihydronaphthalene as an Example
To show the logic behind calculating the enantiomeric excess for each alkene, the following table was drawn.
| Property: | Configuration: | |||||||
|---|---|---|---|---|---|---|---|---|
| RS1 | RS2 | RS3 | RS4 | SR1 | SR2 | SR3 | SR4 | |
| Sum of electronic and Thermal Enthalpies (a.u.): | -1381.120782 | -1381.125886 | -1381.134059 | -1381.126722 | -1381.131343 | -1381.116109 | -1381.126039 | -1381.136239 |
| Imaginary Frequency/cm-1: | -454.36 | -472.73 | -472.86 | -481.92 | -490.65 | -462.54 | -486.75 | -478.77 |
| Bond Lengths ([C-O Forming S/L]/[CO Breaking])/Å: | 2.12/2.19/1.43 | 2.18/2.12/1.42 | 2.16/2.15/1.41 | 2.07/2.28/1.43 | 2.15/2.15/1.41 | 2.07/2.31/1.43 | 2.06/2.18/1.44 | 2.07/2.19/1.42 |
RS1, RS2, RS4, SR2, SR3 and SR4 appear to react asynchronously, compared to the synchronous, spiro transition states of RS3 and SR4.
The lowest energies were RS3 with an energy of -1381.134059 a.u. and SR4 with -1381.136239 a.u. as a sum of the electronic energies and free energies. The ratio of the concentrations are given as:
The enantiomeric excess is therefor 81.92%, as the fraction of RS3 is 9.04% and SR3 is 90.96%.
Results
| Property: | Catalyst: | ||||||
|---|---|---|---|---|---|---|---|
| Shi: | Jacobsen: | ||||||
| trans-β-Methyl Styrene RR:SS |
Styrene R:S |
Stilbene RR:SS |
Dihydrohanpthalene RS:SR |
cis-β-Methyl Styrene RS:SR |
trans-β-Methyl Styrene RR:SS |
Styrene R:S | |
| Ratio: | 0.0003:1 | 1.6260:1 | 0.0014:1 | 10.063:1 | 8113.4:1 | 5529.6:1 | 1721.2:1 |
| Enantiomeric Excess: | 99.94% | 23.84% | 99.73% | 81.91% | 99.98% | 99.96% | 99.88% |
| Reference 1[5]: | 90% | 97% | 86% | 86% | |||
| Reference 2[6]: | 91-92% | 98% | |||||
| Reference 3[7]: | 96% | 92% | |||||
| Reference 4[8]: | 86% | 46% | |||||
The enantiomeric excess was predicted with fair accuracy for trans-β-Methyl Styrene, Stilbene and Dihydrohanpthalene when reacted with the Shi catalyst. These three were investigated further for the rest of the report.
Analysis of the Shi - trans-β-Methyl-Styrene Transition State
Shi-MS QTAIM Analysis
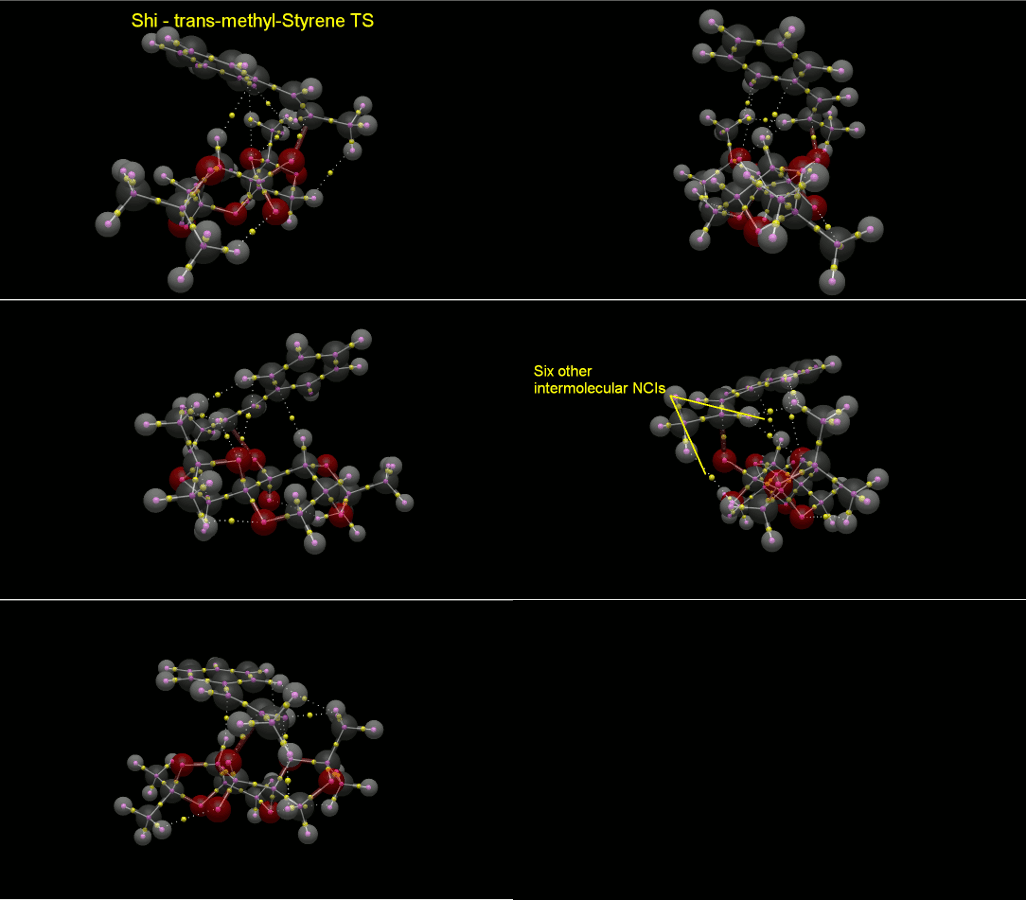
QTAIM Analysis was performed on the TS of the Shi epoxidation of trans-β-Methyl-Styrene. When the structure is layered onto the QTAIM result from Avogadro 2, all the NCIs can be distinguished easily from the other BCPs, identified as yellow spheres.
| QTAIM Analysis of Shi-Methylstyrene TS | Animation |
|---|---|

|
|
In order to lower the energy of the TS, it maximises the number of intermolecular NCIs to a total of 6, as well as the epoxidation site and another intramolecular NCI in the catalyst.
Shi-MS NCI Analysis
NCI Analysis was performed on the transition state between (R,R)-methyl-Styrene and Shi's catalyst. The bond-forming interactions are shown as a doughnut and the involved bonds are highlighted.
| Shi-MS TS: |
|---|

|
| Click image to view Jmol file |
There is a significant amount of favourable interaction between the molecules, in addition to some disfavoured intramolecular interactions within the Shi catalyst protecting groups. The transition state appears to be asynchronous, perhaps due to these interactions. The surfaces shown in blue between the phenyl group and H19 would play an important role in the lower relative energy of the (R,R) enantiomer to the (S,S).
Simulated Spectroscopic Analysis of (S,R)-Dihydronaphthalene epoxide
Simulated Proton NMR of (S,R)-Dihydronaphthalene epoxide
The NMR was simulated using b3lyp/6-311+g(d,p) including J coupling across all atoms DOI:/10042/26638 . This produced a matrix of all the interactions. The four strongest H-H interactions were chosen for each proton and convoluted with each peak. This was plotted on Excel and the result is as follows:
| J values (Hz) for all H-H interactions | |||||||||||
|---|---|---|---|---|---|---|---|---|---|---|---|
| ppm | Proton | H7 | H8 | H9 | H12 | H13 | H16 | H17 | H18 | H19 | H20 |
| 3.5683 | H7 | 0 | |||||||||
| 7.2767 | H8 | -0.12254 | 0 | ||||||||
| 7.5016 | H9 | 0.130733 | 8.54131 | 0 | |||||||
| 7.2142 | H12 | 0.360109 | 0.877317 | 0.344401 | 0 | ||||||
| 7.353 | H13 | -0.208139 | 8.48781 | 0.960504 | 8.56666 | 0 | |||||
| 2.3632 | H16 | -0.129761 | -0.451851 | 0.348208 | -0.243512 | 0.062722 | 0 | ||||
| 1.5482 | H17 | -0.189075 | -0.0922356 | -0.139026 | 0.00431662 | -0.138145 | 6.25626 | 0 | |||
| 2.7124 | H18 | -0.0851746 | -1.51941 | 0.37155 | -1.56207 | 0.505007 | -17.112 | 13.8601 | 0 | ||
| 2.197 | H19 | 0.121159 | -0.167049 | -0.222037 | 0.0351446 | -0.0112825 | 1.58156 | -15.7272 | 7.53139 | 0 | |
| 3.502 | H20 | 4.67698 | -0.0608695 | -0.209265 | -0.132677 | -0.264936 | 0.959921 | 1.08265 | -0.689119 | 3.13847 | 0 |
The following conclusions were made for the above table and spectrum:
- The aromatic protons are isolated from the rest of the molecule and share similar J values (~8.5Hz) and are thus split into the expected doublets and triplets.
- The J values follow the Karplus relationship - a dihedral angle of 90° shows the weakest relative value.
- H16-19 would appear as multiplets on a spectrum.
| Comparison to literature: | |||||||||||
|---|---|---|---|---|---|---|---|---|---|---|---|
| Proton | Computed | Reference 1[9] δH (400 MHz, CDCl3) |
Reference 2[10] δH (400 MHz, CDCl3) | ||||||||
| H7 | 3.57 (d) J = 5Hz | 3.72 (d) | 3.89 (d) J = 4Hz | ||||||||
| H8 | 7.28 (t) J = 8Hz | 7.11 (m) | 7.13 (d) J = 7Hz | ||||||||
| H9 | 7.50 (d) J = 8Hz | 7.27 (d) | 7.44 (d) J = 7Hz | ||||||||
| H12 | 7.21 (d) | 6.97 (d) | 7.33-7.21 (m) | ||||||||
| H13 | 7.35 (t) | 7.11 (m) | 7.33-7.21 (m) | ||||||||
| H16 | 2.36 (d) | 2.43 (m) | 2.59-2.55 (m) | ||||||||
| H17 | 1.54 (t) | 1.64 (m) | 1.80-1.76 (m) | ||||||||
| H18 | 2.71 (m) | 2.67 (m) | 2.83-2.79 (m) | ||||||||
| H19 | 2.20 (m) | 2.29 (m) | 2.49-2.41 (m) | ||||||||
| H20 | 3.50 (m) | 3.61 (t) | 3.77 (d) J = 4Hz | ||||||||
The computed values are remarkably close to the literature, down to the shape of the peaks, proving computing to be a powerful way to predict the spectrum of a rigid molecule.
A comparison of the NMR spectra (shift only) for each enantiomer is given below as a structure check:
| (S,R) |
|---|

|
| (R,S) |

|
The spectra are near identical, suggesting the optimisations were completed. The energies were -462.42275222 a.u. for SR and -462.42275284 a.u. for RS, a difference of ~3 cal·mol-1
A Carbon NMR was simulated for Dihydronaphthalene Oxide:
(S,R)-Dihydronaphthalene epoxide Optical Analysis
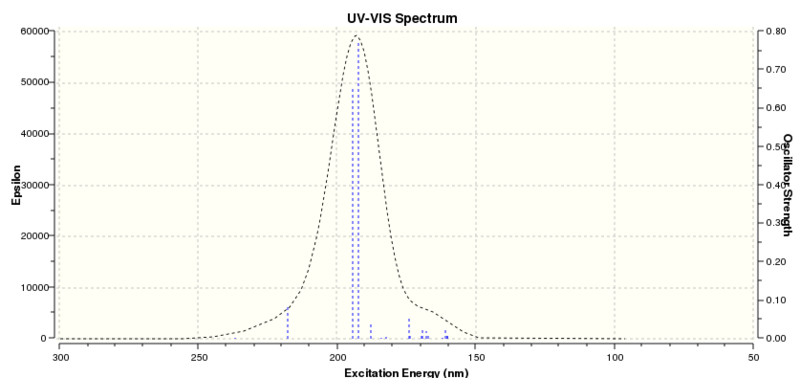
The computed UV spectrum is given below. Literature references were not found to match, but the product is expected to absorb strongly at 193 nm, a little lower in energy compared to dilute benzene at 184 nm[11]. This would be expected as electron density is pulled towards the epoxide, weakening the aromatic system.
| UV-Vis Spectrum |
|---|
|
The optical rotation in CHCl3 was given as:
[Alpha] ( 5890.0 A) = -148.00 deg
This is close to the literature value of -151° (CHCl3, ambient temperature, 589nm)[12]. This suggests, given a decent basis set, optical rotation calculations can be very accurate - more than enough to determine conformation. For previously unmeasured compounds, computed optical rotations could provide a powerful method of calculating the purity or enantiomeric excess of a product.
(S,R)-Dihydronaphthalene/Shi TS NCI Analysis
NCI Analysis was performed on the transition state between (S,R)-Dihydronaphthalene and Shi's catalyst. The bond-forming interactions are shown as a doughnut and the involved bonds are highlighted.
| Shi-DHN TS: |
|---|

|
| Click image to view Jmol file |
This time the reaction appears to go via a spiro transition state. This model clearly shows the benefits of proceeding in this configuration compared to the alternatives - a maximising of favourable interactions compared to swapping across the bond such that C36 is switched with C38, and a reflection through the plane of the epoxide would cause huge steric clash.
Simulated Spectroscopic Analysis of (S,S)-trans-Stilbene Oxide
Simulated Proton NMR of (S,S)-trans-Stilbene Oxide
As before, the NMR was simulated using b3lyp/6-311+g(d,p) including J coupling across all atoms DOI:/10042/26678 .
| J values (Hz) for all H-H interactions | |||||||||||||
|---|---|---|---|---|---|---|---|---|---|---|---|---|---|
| ppm | Proton | H7 | H8 | H9 | H10 | H11 | H13 | H15 | H20 | H22 | H24 | H25 | H26 |
| 7.4207 | H7 | 0 | |||||||||||
| 7.4319 | H8 | 8.47523 | 0 | ||||||||||
| 7.4803 | H9 | 0.831729 | 8.83272 | 0 | |||||||||
| 7.4634 | H10 | 0.889338 | 0.434531 | 1.56619 | 0 | ||||||||
| 7.5193 | H11 | 8.47087 | 0.953694 | 0.426037 | 9.0036 | 0 | |||||||
| 3.5053 | H13 | -0.478024 | 0.00975544 | -0.0982217 | -0.820481 | 0.448288 | 0 | ||||||
| 3.5055 | H15 | -0.0327037 | -0.149408 | -0.00221795 | 0.387689 | -0.0685418 | 1.19184 | 0 | |||||
| 7.4635 | H20 | -0.0714225 | -0.0619115 | 0.0304844 | -0.00319774 | -0.0693836 | 0.383986 | -0.818294 | 0 | ||||
| 7.4803 | H22 | -0.0393495 | -0.0344463 | 0.0247481 | 0.0274583 | -0.0302451 | -0.00618884 | -0.101693 | 1.56215 | 0 | |||
| 7.5193 | H24 | -0.0748163 | -0.0575717 | -0.0295612 | -0.0675698 | -0.0701969 | -0.066202 | 0.45201 | 9.00572 | 0.424275 | 0 | ||
| 7.4319 | H25 | -0.0618177 | -0.0483855 | -0.0356008 | -0.0633289 | -0.0581885 | -0.146889 | 0.00957556 | 0.436713 | 8.83305 | 0.955868 | 0 | |
| 7.4207 | H26 | -0.0583407 | -0.0626233 | -0.0377169 | -0.0701118 | -0.0754987 | -0.0338002 | -0.476643 | 0.889112 | 0.830603 | 8.47128 | 8.4743 | 0 |
The following conclusions were made for the above table and spectrum:
- The aromatic protons would be indistinguishable.
- The epoxide protons would appear as a singlet as expected.
| Comparison to literature: | |||||||||||
|---|---|---|---|---|---|---|---|---|---|---|---|
| Proton | Computed | Reference 1[10] δH (400 MHz, CDCl3) | |||||||||
| H7 | 7.42 | 7.57-7.34 (m) | |||||||||
| H8 | 7.43 | ||||||||||
| H9 | 7.48 | ||||||||||
| H10 | 7.46 | ||||||||||
| H11 | 7.52 | ||||||||||
| H13 | 3.51 (s) | 4.24 (s) | |||||||||
| H15 | 3.51 | ||||||||||
| H20 | 7.46 | 7.57-7.34 (m) | |||||||||
| H22 | 7.48 | ||||||||||
| H24 | 7.52 | ||||||||||
| H25 | 7.43 | ||||||||||
| H26 | 7.42 | ||||||||||
This computed spectrum was less accurate than the previous, as the epoxide protons were off by 0.73ppm. This could be due to the fact that the molecule is less rigid, or the phenyl groups draw more electron density than predicted.
(S,S)-trans-Stilbene Oxide Optical Analysis
The optical rotation in CHCl3 was given as:
[Alpha] ( 5980.0 A) = -217.95 deg
Compared to the literature value of -350°[13], this is quite off, perhaps for the same reason the NMR was slightly off.
(S,S)-trans-Stilbene/Shi TS NCI Analysis
NCI Analysis was performed on the transition state between (S,S)-trans-Stilbene and Shi's catalyst. The bond-forming interactions are shown as a doughnut and the involved bonds are highlighted.
| Trans-Stilbene-Shi NCI: |
|---|

|
| Click image to view Jmol file |
This reaction proceeds via an asynchronous transition state, and a look at the model shows why - a spiro mechanism, rotating the stilbene 90°, would cause steric clash. As to why the (S,S) enantiomer is preferred, this can be visualised by switching the hydrogens with the phenyl groups on the stilbene and rolling the molecule to avoid a clash. The stilbene would then clash with either the methyl group C12 or the protecting group around O6.
Conclusions and Further Investigation of Alkenes
Conclusions
Cyclopentadiene
Gaussian has been used to perform most of the calculations in this section. 6-31G(d,p) was used for its high speed, non-empirical calculations on the college computers. This has provided a more extensive analysis on the mechanism of dimerisation, showing it is not as simple as looking at the sterics of the products for kinetic information. Bifurcation points were found in the formation of the favourable endo product due to the high symmetry involved. It would be interesting to investigate this further by finding its reaction coordinates, or substituting groups to see which bond is favoured when symmetry is lost.
Taxol
Intermediates A and B interchange through a relatively complex oxo-Cope rearrangement. The thermodynamics were investigated to find out which would be the most common, and therefore the products of further reactions. The computed NMRs of 18 were not satisfactory - it was difficult to match them to the literature and they appeared highly inconsistent. This shows a shortcoming of Gaussian, either in its optimisation or NMR calculations.
Crystal Structures of Catalysts
Jmol was used to measure the various bond lengths, angles and structures of the catalysts. Gaussian was then used to provide molecular orbital information on the Shi catalyst. Using a combination of Jmol and Gaussian, an insight of why one conformation is preferred over the other was given.
Alkene Epoxidation
Thermodynamic data was used to predict the ratio of enantiomers produces by the catalysts. Comparison with literature proved slightly inconsistent. QTAIM was calculated with Avagadro 2, and NCI analysis using a Jmol script[14]. This helped to explain qualitatively the difference in energy between transition states and therefore the enantiomeric excess. The optical rotation and NMR were computed for two alkenes. As this is not a time-averaged NMR, its worked best for the rigid molecule, Dihydronaphthalene when compared to literature. Excel was used to produce an NMR plot (Cauchy, 512 points/ppm for overall, 4096 points/ppm for aromatic region) to provide a visual reference for the data. The optical rotation was also more accurate for the rigid molecule.
(R)-(+)-Pulegone
The alkene (R)-(+)-Pulegone was chosen as a candidate for investigation for the following reasons:
- It is a naturally occurring oil found in peppermint.
- It is available on Sigma Aldrich.
- Its epoxides have been extensively studied and have strong optical rotations[15]
References
- ↑ Pierluigi Caramella , Paolo Quadrelli , and Lucio Toma "Bifurcations on Potential Energy Surfaces of Organic Reactions", 2nd Sept 2008 DOI:10.1002/anie.200800918
- ↑ Daniel H. Ess Dr., Steven E. Wheeler Dr., Robert G. Iafe, Lai Xu, Nihan Çelebi-Ölçüm, Kendall N. Houk Prof. , "An Unexpected Bispericyclic Transition Structure Leading to 4+2 and 2+4 Cycloadducts in the Endo Dimerization of Cyclopentadiene", J. Am. Chem. Soc., 2002, 124 (7), pp 1130–1131 DOI:10.1021/ja016622h
- ↑ L. Paquette, N. A. Pegg, D. Toops, G. D. Maynard, R. D. Rogers, J. Am. Chem. Soc., 1990, 112, pp 277-283. DOI:10.1021/ja00157a043
- ↑ 4.0 4.1 M. W. Lodewyk, C. Soldi , P. B. Jones, M. M. Olmstead, J. Rita, J. T. Shaw, and D. J. Tantillo, "The Correct Structure of Aquatolide—Experimental Validation of a Theoretically-Predicted Structural Revision", J. Am. Chem. Soc., 2012, 134, pp18550–18553 DOI:10.1021/ja3089394
- ↑ Teresa Beeson "Catalytic Asymmetric Epoxidation via Chiral Oxaziridines Dioxiranes and Sulfonium Ylides", 6th July 2006 URL
- ↑ Zhi-Xian Wang, Lianhe Shu, Michael Frohn, Yong Tu, and Yian Shi "Asymmetric Epoxidation of trans-β-Methylstyrene and 1-Phenylcyclohexene Using a D-Fructose-Derived Ketone: (R,R)-trans-β-Methylstyrene Oxide and (R,R)-1-Phenylcyclohexene Oxide", Organic Syntheses, Vol. 80, p. 9-17 2003; Coll. Vol. 11, p. 183-188 2009 DOI:10.1002/0471264180.os080.02 URL
- ↑ Vasyl Andrushko, Natalia Andrushko "Stereoselective Synthesis of Drugs and Natural Products", Ch. 35.2 Metal Oxo-Catalyzed Epoxidations, p. 1076 2003 URL
- ↑ Pekka Pietikäinen "Mn-Salen catalyzed asymmetric epoxidation: search for new oxidation systems", 2001 URL
- ↑ Christopher Murray et al., Patent: "PROCESS FOR MAKING AND USING HOF.RCN", United States Patent Application Number: 20110040092, 17th February, 2011
- ↑ 10.0 10.1 Mathew W. C. Robinson, A. Matthew Davies, Richard Buckle, Ian Mabbett, Stuart H. Taylora and Andrew E. Graham "Epoxide ring-opening and Meinwald rearrangement reactions of epoxides catalyzed by mesoporous aluminosilicates", Org. Biomol. Chem., 2009,7, pp2559-2564 DOI:10.1039/B900719A
- ↑ Vladimir O. Saik , Sanford Lipsky "Absorption spectrum of neat liquid benzene and its concentrated solutions in n-hexane from 220 to 170 nm" J. Phys. Chem., 1995, 99 (13), pp 4406–4413 DOI:10.1021/j100013a008
- ↑ Suresh K. Balani, Derek R. Boyd,* E. Sally Cassidy, Gregory I. Devine, John F. Malone, Kenneth M. McCombe, and Narain D. Sharma, W. Brian Jennings "A General Method for the Resolution of Cyclic trans-Bromohydrin Enantiomers. Absolute Configuration by Crystal Structure Analysis of a 2- Methoxy-2-phenyl-2-trif luoromethylacetate (MTPA) Diastereoisomer", J. CHEM. SOC. PERKIN TRANS. I, 1983 DOI:10.1039/P19830002751
- ↑ G. Gottarelli, P. Mariani, G.P. Spada, B. Samorí, A. Forni, G. Solladie, M. Hibert "Induction of cholesteric mesophases in nematic liquid crystals, and correlation of absolute configurations of some chiral oxiranes and thiiranes", Tetrahedron, Volume 39, Issue 8, 1983, pp 1337–1344 DOI:10.1016/S0040-4020(01)91902-7
- ↑ Henry Rzepa "Synthesis and computational lab: 1C" URL
- ↑ T. M. Feeley and M. K. Hargreaves "Circular dichroism studies. The pulegone oxides" J. Chem. Soc. C, 1970, pp1745-1750 DOI:10.1039/J39700001745

