Rep:Mod:00636773
Introduction
In this project, Gaussian was explored to calculate electronic and physical properties of small molecules and the results were compared to literature. The molecules were BH3, BBr3, GaBr3 and TlBr3. Additionally, the B-N bond strength of NH3BH3 and the B-O bond strength of BH3(THF) were calculated. The MO diagram of BH3 and the NBO analysis of NH3 were included.
Borane Optimisation
A molecule of borane, BH3 was drawn and optimised first using a 3-21G and then a 6-31G basis set. These values cannot be compared for reasons stated later on.
Optimisation Results
| Property | 3-21G | 6-31G | Ultrafine 6-31G | Ultrafine Frequency analysis |
|---|---|---|---|---|
| File type: | .log | .log | .log | .log |
| Calculation type: | FOPT | FOPT | FOPT | FREQ |
| Calculation method: | RB3LYP | RB3LYP | RB3LYP | RB3LYP |
| Basis set: | 3-21G | 6-31G(d,p) | 6-31G(d,p) | 6-31G(d,p) |
| Final energy: | -26.46226338 a.u. | -26.61532363 a.u. | -26.46226364 a.u. | -26.61532364 a.u. |
| Gradient: | 0.00020672 a.u. | 0.00000235 a.u. | 0.00000146 a.u. | 0.00000146 a.u. |
| Dipole moment: | 0 Debye | 0 Debye | 0 Debye | 0 Debye |
| Point group: | D3H | D3H | D3H | D3H |
| Calculation time: | 8.0 seconds | 21.8 seconds | 3.0 seconds | 5.0 seconds |
| Log file: | BH3 3-21G | BH3 6-31G | BH3 Ultrafine | BH3 Ultrafine Frequency Analysis |
A lower energy was observed for the 6-31G basis set. This is because it improves the simulation of polarisation of electrons as well as better modelling of the core orbitals, while using more processing time.
For 3-21G Basis Set:
Item               Value     Threshold  Converged?
 Maximum Force            0.000413     0.000450     YES
 RMS     Force            0.000271     0.000300     YES
 Maximum Displacement     0.001610     0.001800     YES
 RMS     Displacement     0.001054     0.001200     YES
 Predicted change in Energy=-1.071764D-06
 Optimization completed.
    -- Stationary point found.
For 6-31G Basis Set:
Item               Value     Threshold  Converged?
 Maximum Force            0.000005     0.000450     YES
 RMS     Force            0.000003     0.000300     YES
 Maximum Displacement     0.000019     0.001800     YES
 RMS     Displacement     0.000012     0.001200     YES
 Predicted change in Energy=-1.305135D-10
 Optimization completed.
    -- Stationary point found.
Gallium Bromide and Thallium Bromide Optimisation
Gallium and thallium bromide were optimised using the same basis set, LANL2DZ.
Optimisation Results
| Property | GaBr3 | TlBr3 |
|---|---|---|
| File type: | .log | .log |
| Calculation type: | FOPT | FOPT |
| Calculation method: | RB3LYP | RB3LYP |
| Basis set: | LANL2DZ | LANL2DZ |
| Final energy: | -41.700827827 a.u. | -91.218128507 a.u. |
| Gradient: | 0.00000016 a.u. | 0.00000090 a.u. |
| Dipole moment: | 0 Debye | 0 Debye |
| Point group: | D3H | D3H |
| Calculation time: | 27.5 seconds | 38.4 seconds |
| Link to D-Space: | DOI:10042/25225 | |
| Log file: | GaBr3 HPC | TlBr3 HPC |
The final energy for thallium bromide was significantly lower than that of gallium bromide due to there being many more electrons in the thallium atom.
For GaBr3:
Item               Value     Threshold  Converged?
 Maximum Force            0.000000     0.000450     YES
 RMS     Force            0.000000     0.000300     YES
 Maximum Displacement     0.000003     0.001800     YES
 RMS     Displacement     0.000002     0.001200     YES
 Predicted change in Energy=-1.282691D-12
 Optimization completed.
    -- Stationary point found.
For TlBr3:
Item               Value     Threshold  Converged?
 Maximum Force            0.000002     0.000450     YES
 RMS     Force            0.000001     0.000300     YES
 Maximum Displacement     0.000022     0.001800     YES
 RMS     Displacement     0.000014     0.001200     YES
 Predicted change in Energy=-6.084147D-11
 Optimization completed.
    -- Stationary point found.
Geometry
| Property | GaBr3 Gaussian | GaBr3 Literature | TlBr3 Gaussian | TlBr3 Literature |
|---|---|---|---|---|
| Bond length: | 2.350Å | 2.239Å [1] | 2.651Å | 2.618Å [2] |
| Bond angle: | 120.0° | |||
Boron Triboride Optimisation
Boron tribromide was optimised using the "GEN" function, allowing custom basis sets to be used on individual atoms. 6-31G was used for boron, and LANL2DZ was used for the larger bromines.
Optimisation Results
| Property | BBr3 |
|---|---|
| File type: | .log |
| Calculation type: | FOPT |
| Calculation method: | RB3LYP |
| Basis set: | Gen |
| Final energy: | -64.4364529566 a.u. |
| Gradient: | 0.00000382 a.u. |
| Dipole moment: | 0 Debye |
| Point group: | D3H |
| Calculation time: | 36.8 seconds |
| Log files: | BBr3.gjf |
Gaussian successfully settled on -64.43 a.u., about -160,177.92 kJ·mol-1.
For BBr3:
Item               Value     Threshold  Converged?
 Maximum Force            0.000008     0.000450     YES
 RMS     Force            0.000005     0.000300     YES
 Maximum Displacement     0.000036     0.001800     YES
 RMS     Displacement     0.000023     0.001200     YES
 Predicted change in Energy=-4.026916D-10
 Optimization completed.
    -- Stationary point found.
Geometry
B-Br Bond Length: 1.934Å compared to literature 1.900Å using gas diffraction [3]
Comparison of BH3, BBr3, GaBr3 and TlBr3
The bond lengths were calculated for the titled molecules and compared to the sum of their covalent radii.
| Molecule | BH3 | BBr3 | GaBr3 | TlBr3 |
|---|---|---|---|---|
| Bond length: | 1.193Å | 1.934Å | 2.350Å | 2.651Å |
| Bond length using covalent radii: | 1.17Å | 2.04Å | 2.42Å | 2.65Å |
| Difference in electronegativity: | -0.16 | -0.92 | -1.15 | -1.34 |
| Bond angle: | 120.0° | |||
| Atom | Boron | Gallium | Thallium | Hydrogen | Bromine |
|---|---|---|---|---|---|
| Atomic Radius: | 0.90Å | 1.35Å | 1.70Å | 0.65Å | 1.20Å |
| Covalent Radius: | 0.84Å | 1.22Å | 1.45Å | 0.31Å | 1.20Å |
As expected, changing the ligand affects bond distances. They follow the expected trend that the larger the atom, the greater the bond length. In each of the above cases, the ligand is δ-, but replacing hydrogen with bromine causes a greater difference in electronegativiy and increasing the Lewis acidity of the trigonal planar molecules.
Thallium (III) bromide is interesting in that the bond length is almost exactly the combination of the covalent radii, despite having expected ionic character. In fact it is unstable, disproportionating into thallium (II), thallium (I) and bromine.
Sometimes the bond length is outside of GaussView's animator's tolerated distance and does not draw a bond. This does not mean there is not a bond however. Again, sometimes extra bonds may be drawn for the opposite reason (an example being the dimerisation of MX3 Lewis acids. A chemical bond is the attractive interaction between oppositely charged particles, typically between ions, or when a structure adopts a lower energy from electrons filling overlapping wavefunctions of the same phase. The most favourable overlap dictates the distance between nuclei, and so the bond length changes depending on the orbitals.
Frequency Analysis
In the following section, the IR spectrum was predicted for BH3 and GaBr3. 6 modes were observed for each molecule in agreement to the 3N-6 rules (N = Number of atoms in molecule), but one mode was not IR active due to a lack of change of dipole moment.
Borane Frequency Analysis
| Property | 6-31G Optimisation | Frequency Optimisation |
|---|---|---|
| File type: | .log | .log |
| Calculation type: | FOPT | FREQ |
| Calculation method: | RB3LYP | RB3LYP |
| Basis set: | 6-31G(d,p) | 6-31G(d,p) |
| Final energy: | -26.61532363 a.u. | -26.61532363 a.u. |
| Gradient: | 0.00000235 a.u. | 0.00000294 a.u. |
| Dipole moment: | 0 Debye | 0 Debye |
| Point group: | D3H | D3H |
| Calculation time: | 21.8 seconds | 6.0 seconds |
| Log file | BH3 6-31G | BH3 Freq |
 Item               Value     Threshold  Converged?
 Maximum Force            0.000006     0.000450     YES
 RMS     Force            0.000003     0.000300     YES
 Maximum Displacement     0.000023     0.001800     YES
 RMS     Displacement     0.000012     0.001200     YES
 Predicted change in Energy=-2.041299D-10
 Optimization completed.
    -- Stationary point found.

Low frequencies ---   -0.9458   -0.8709   -0.0054    5.6809   11.6924   11.7306
 Low frequencies --- 1162.9961 1213.1825 1213.1852
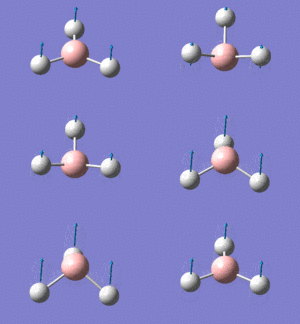
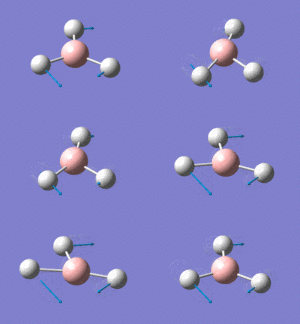
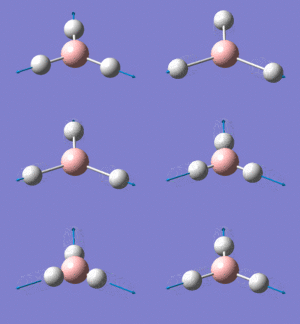
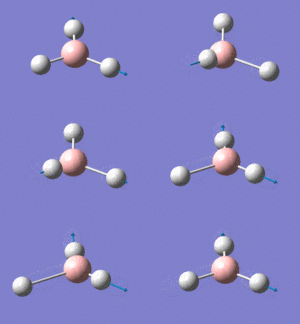
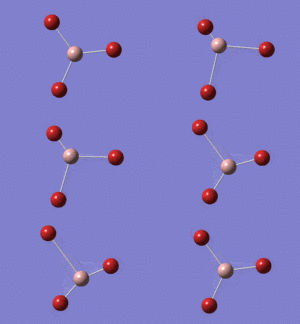
The following table shows the animated vibrational modes of borane, ordered from lowest wavenumber to highest; below that, a simulated spectrum is shown.
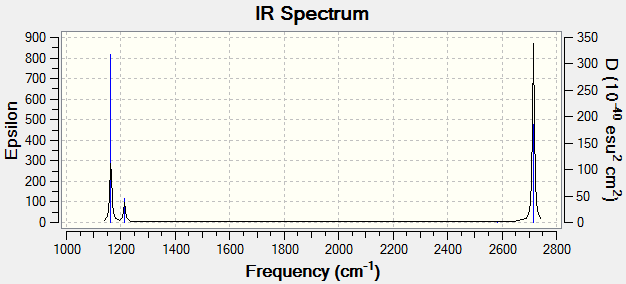
Note Mode 4 is IR inactive
The following "Low Frequencies" were found in the results, 5.6809 being the lowest positive wavenumber:
-0.9458 -0.8709 -0.0054 5.6809 11.6924 11.7306
As the wavenumber goes down, the energy of the absorbed photon also goes down until it reaches 0. Going past that, the molecule begins to emit a photon of higher energy than the absorbed photon. This suggests that the molecule is in an excited or transition state, and absorbing another photon causes it to relax to a state of lower energy than the excited state, and therefore the emitted photon is of higher energy.
GaBr3 Frequency Analysis
| Property | Frequency Optimisation |
|---|---|
| File type: | .log |
| Calculation type: | FREQ |
| Calculation method: | RB3LYP |
| Basis set: | LANL2DZ |
| Final energy: | -41.70082783 a.u. |
| Gradient: | 0.00000011 a.u. |
| Dipole moment: | 0 Debye |
| Point group: | D3H |
| Calculation time: | 16.4 seconds |
| Link to D-Space | DOI:10042/25235 |
The system converged with a very low gradient, and the "0" frequencies were close to 0.
Item               Value     Threshold  Converged?
 Maximum Force            0.000000     0.000450     YES
 RMS     Force            0.000000     0.000300     YES
 Maximum Displacement     0.000002     0.001800     YES
 RMS     Displacement     0.000001     0.001200     YES
 Predicted change in Energy=-6.142862D-13
 Optimization completed.
    -- Stationary point found.


Low frequencies ---   -0.5252   -0.5247   -0.0024   -0.0010    0.0235    1.2010
 Low frequencies ---   76.3744   76.3753   99.6982
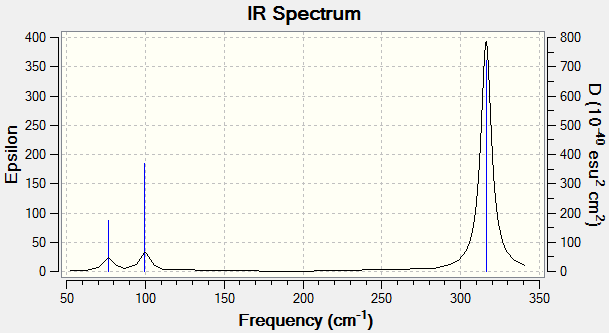
Note mode 4 is IR inactive
A very strong absorption is observed at 316.18 wavenumbers, while the peak at 197.34 is not visible due to a lack of change of dipole moment.
Comparison of BH3 and GaBr3
Frequency analysis was completed for borane and gallium bromide using the same basis set and method. Basis sets use algorithms that take different components of systems into account, and so these components considered must be the mutually present for each system being compared. The Pople basis sets 3-21G and 6-31G were used for most of these calculations, while LANL2DZ (Los Alamos National Laboratoty 2 Double Zeta), a split basis set that makes a compromise between demand and accuracy, was used for larger centres.
A frequency analysis is performed to check the system is actually at a ground state and its potential is at a local minimum. If the system is not, negative frequencies will be observed showing that emitted photons will be of higher energy.
| BH3 Mode | BH3 Frequency | GaBr3 Frequency | Frequency Ratio | BH3 Intensity | GaBr3 Intensity | Intensity Ratio |
|---|---|---|---|---|---|---|
| 1 (GaBr3 Mode 3): | 1163.00 | 99.70 | 11.66 | 93 | 9 | 10 |
| 2: | 1213.18 | 76.38 | 15.88 | 14 | 3 | 4 |
| 3 (GaBr3 Mode 1): | 1213.19 | 76.37 | 15.89 | 14 | 3 | 4 |
| 4: | 2582.28 | 197.34 | 13 | 0 | 0 | NaN |
| 5: | 2715.45 | 316.18 | 8.59 | 126 | 57 | 2 |
| 6: | 2715.45 | 316.19 | 8.59 | 126 | 57 | 2 |
Using ratios, modes can be paired up between the molecules. It becomes clear that the molecules are relatively similar. What is noticeable however is that the borane oscillates about 10 times faster than its gallium bromide counterpart. A large part of this is due to bromine being so much larger than hydrogen.
Borane is also much more active in absorbing infrared, especially at the low wavenumbers.
In the table, the modes 1 and 3 for GaBr3 have been switched over. This could be due to the fact that the bromines are not required to move as much as the hydrogens in the BH3. Therefore their relatively huge mass does not do much to lower the wavenumber.
The modes that involve a stretching (or nearly a stretching) tend to have a higher wavenumber. This is because the distortion involved is greater than that of bending and so the bond is "stiffer" in that direction.
The low frequencies were calculated to show the systems were at ground state.
Borane Molecular Orbital Diagram
The MOs of Borane were calculated using the 6-31G basis set.
Optimisation Results
| Property | BH3 |
|---|---|
| File type: | .log |
| Calculation type: | SP |
| Calculation method: | RB3LYP |
| Basis set: | 6-31G(d,p) |
| Final energy: | -26.61532363 a.u. |
| Gradient: | |
| Dipole moment: | 0 Debye |
| Point group: | D3H |
| Calculation time: | 31.5 seconds |
| Link to D-Space | DOI:10042/25246 |
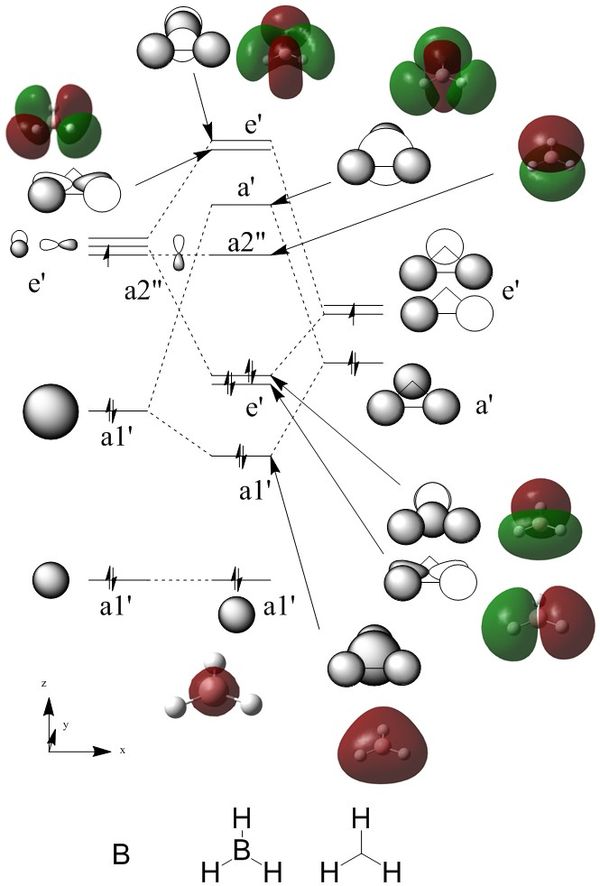
The following diagram shows the drawn LCAOs and computed MOs for borane.
The LCAOs and MOs are in very tight agreement. Importantly, the nodes match quite well. The HOMO is doubly degenerate. This might not seem obvious looking from a LCAO perspective as the pi orbitals from the boron are at 90° to each other, compared to the 60° of the two matched trihydrogen orbitals.
NBO Analysis of Ammonia
A "Natural Bond Orbital" Analysis was computed for ammonia.
| Property: | 6-31G Optimisation: | Frequency Analysis: | Energy Calculation: | NBO Calculation: | Ultrafine Optimisation: | Ultrafine Frequency Analysis: |
|---|---|---|---|---|---|---|
| File type: | .log | .log | .log | .log | .log | .log |
| Calculation type: | FOPT | FREQ | SP | SP | FOPT | FREQ |
| Calculation method: | RB3LYP | RB3LYP | RB3LYP | RB3LYP | RB3LYP | RB3LYP |
| Basis set: | 6-31G(d,p) | 6-31G(d,p) | 6-31G(d,p) | 6-31G(d,p) | 6-31G(d,p) | 6-31G(d,p) |
| Final energy: | -56.55776856 a.u. | -56.55776856 a.u. | -56.55776856 a.u. | -56.55776856 a.u. | -56.55776872 a.u. | -56.55776872 a.u. |
| Gradient: | 0.00000885 a.u. | 0.00000890 a.u. | 0.00000137 a.u. | 0.00000125 a.u. | ||
| Dipole moment: | 1.8464 Debye | 1.8464 Debye | 1.8464 Debye | 1.8464 Debye | 1.8465 Debye | 1.8465 Debye |
| Point group: | C1 | C1 | C1 | C1 | C1 | C1 |
| Calculation time: | 41.5 seconds | 24.5 seconds | 7.5 seconds | 31.8 seconds | 21.0 seconds | 9.0 seconds |
| Link to D-Space: | DOI:10042/25274 | DOI:10042/25276 | DOI:10042/25277 | DOI:10042/25278 | NH3 Ultrafine | NH3 Ultrafine Frequency |
Initial optimisation:
Item               Value     Threshold  Converged?
 Maximum Force            0.000024     0.000450     YES
 RMS     Force            0.000012     0.000300     YES
 Maximum Displacement     0.000079     0.001800     YES
 RMS     Displacement     0.000053     0.001200     YES
 Predicted change in Energy=-1.629718D-09
 Optimization completed.
    -- Stationary point found.
Frequency analysis:
Item               Value     Threshold  Converged?
 Maximum Force            0.000022     0.000450     YES
 RMS     Force            0.000009     0.000300     YES
 Maximum Displacement     0.000078     0.001800     YES
 RMS     Displacement     0.000039     0.001200     YES
 Predicted change in Energy=-1.607264D-09
 Optimization completed.
    -- Stationary point found.

Low frequencies ---  -30.6847   -0.0011   -0.0006    0.0003   20.2705   28.3113
 Low frequencies --- 1089.5554 1694.1245 1694.1864
Ultra fine optimisation:
Item               Value     Threshold  Converged?
 Maximum Force            0.000004     0.000015     YES
 RMS     Force            0.000002     0.000010     YES
 Maximum Displacement     0.000008     0.000060     YES
 RMS     Displacement     0.000004     0.000040     YES
 Predicted change in Energy=-1.781029D-11
 Optimization completed.
    -- Stationary point found.
Ultra fine frequency analysis:
Item               Value     Threshold  Converged?
 Maximum Force            0.000003     0.000450     YES
 RMS     Force            0.000001     0.000300     YES
 Maximum Displacement     0.000007     0.001800     YES
 RMS     Displacement     0.000003     0.001200     YES
 Predicted change in Energy=-1.750514D-11
 Optimization completed.
    -- Stationary point found.

Low frequencies ---   -9.2383   -8.2165   -6.3379   -0.0007    0.0012    0.0013
 Low frequencies --- 1089.3360 1693.9207 1693.9250

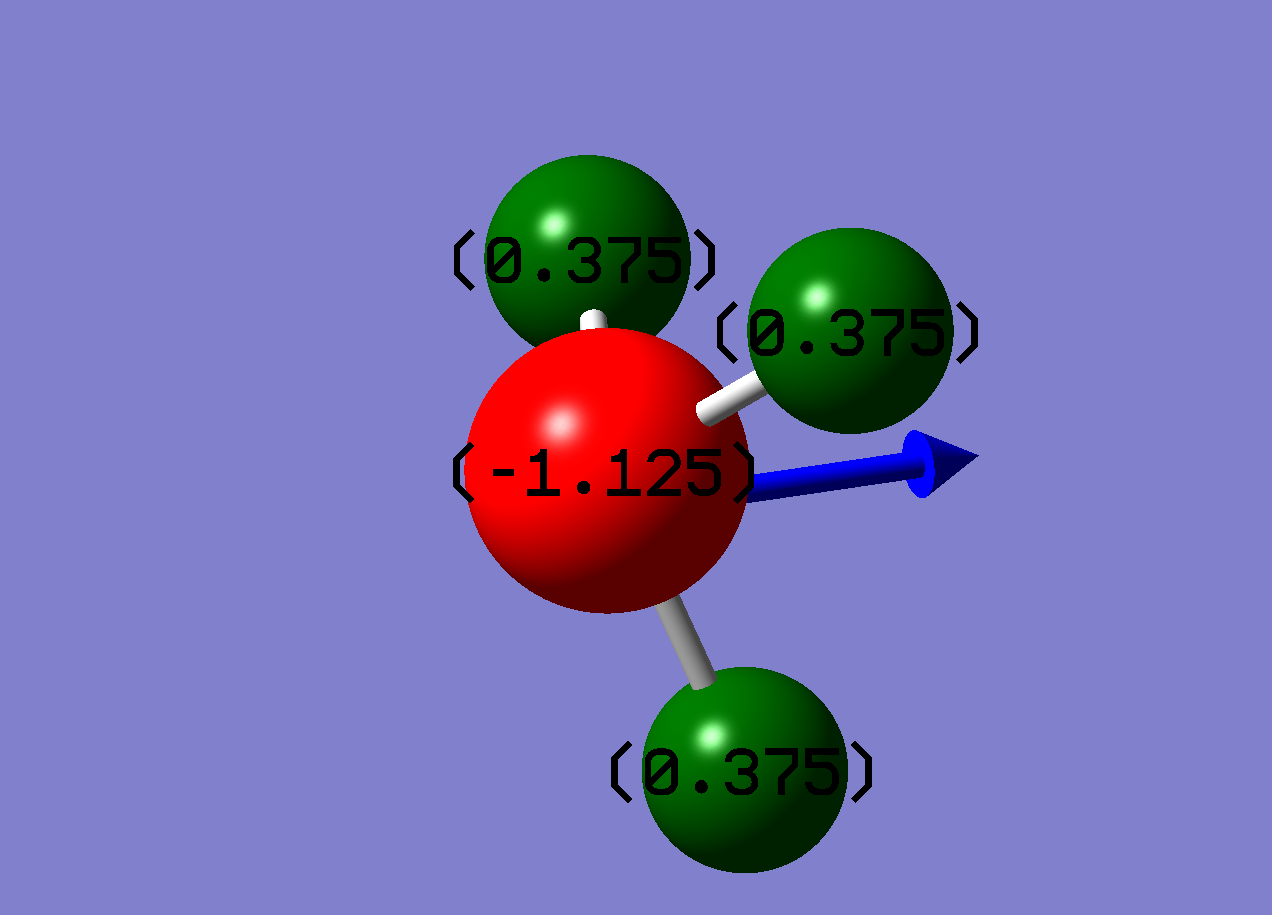
Green indicates strongly positive (+1)
The NBO analysis shows, as expected, that the nitrogen is drawing electron density towards itself making it δ-.
Reacting Ammonia and Borane
The energy of ammonia borane was calculated and compared to the sum of the energies of ammonia and borane to produce an energy difference in kJ·mol-1
The reaction is as follows:
- NH3 + BH3 → NH3BH3
Therefore the energy of the O→B bond is:
- ΔE = E(NH3BH3)) - E(NH3) - E(BH3)
Optimisation Results and Frequency Analysis
| Property | NH3BH3 Optimisation | NH3BH3 Frequency analysis | NH3BH3 Ultrafine Optimisation | NH3BH3 Ultrafine Frequency analysis |
|---|---|---|---|---|
| File type: | .log | .log | .log | .log |
| Calculation type: | FOPT | Freq | FOPT | Freq |
| Calculation method: | RB3LYP | RB3LYP | RB3LYP | RB3LYP |
| Basis set: | 6-31G(d,p) | 6-31G(d,p) | 6-31G(d,p) | 6-31G(d,p) |
| Final energy: | -83.22468907 a.u. | -83.22468907 a.u. | -83.22468909 a.u. | -83.22468909 a.u. |
| Gradient: | 0.00005752 a.u. | 0.00005744 a.u. | 0.00000103 a.u. | 0.00000098 a.u. |
| Dipole moment: | 5.5625 Debye | 5.5625 Debye | 5.5646 Debye | 5.5646 Debye |
| Point group: | C3 | C3 | C3 | C3 |
| Calculation time: | 1 minute, 27.8 seconds | 1 minute, 47.8 seconds | 0 minutes, 21.0 seconds | 0 minutes, 20.0 seconds |
| Link to D-Space: | DOI:10042/25266 | DOI:10042/25272 | NH3BH3 Ultrafine | NH3BH3 Ultrafine |
For the optimisation:
Item               Value     Threshold  Converged?
 Maximum Force            0.000169     0.000450     YES
 RMS     Force            0.000036     0.000300     YES
 Maximum Displacement     0.000934     0.001800     YES
 RMS     Displacement     0.000376     0.001200     YES
 Predicted change in Energy=-1.195425D-07
 Optimization completed.
    -- Stationary point found.
For the frequency analysis:
Item               Value     Threshold  Converged?
 Maximum Force            0.000214     0.000450     YES
 RMS     Force            0.000057     0.000300     YES
 Maximum Displacement     0.001085     0.001800     YES
 RMS     Displacement     0.000467     0.001200     YES
 Predicted change in Energy=-1.671857D-07
 Optimization completed.
    -- Stationary point found.


Low frequencies ---  -16.4152   -0.1037   -0.0051    0.0952   15.9992   16.0799
 Low frequencies ---  263.0558  631.2038  638.3487
For the ultra fine optimisation:
Item               Value     Threshold  Converged?
 Maximum Force            0.000001     0.000015     YES
 RMS     Force            0.000001     0.000010     YES
 Maximum Displacement     0.000036     0.000060     YES
 RMS     Displacement     0.000016     0.000040     YES
 Predicted change in Energy=-5.305546D-11
 Optimization completed.
    -- Stationary point found.
For the ultra fine frequency analysis:
Item               Value     Threshold  Converged?
 Maximum Force            0.000004     0.000450     YES
 RMS     Force            0.000001     0.000300     YES
 Maximum Displacement     0.000037     0.001800     YES
 RMS     Displacement     0.000019     0.001200     YES
 Predicted change in Energy=-6.068981D-11
 Optimization completed.
    -- Stationary point found.


Low frequencies ---   -0.1418   -0.0945   -0.0215    2.3376    2.3723    4.7234
 Low frequencies ---  263.4467  632.9779  638.4653
The "0" frequencies were a little negative, but mode 1 was high enough to be considered accurate.
| Molecule | Energy in a.u. | Energy in kJ·mol-1 |
|---|---|---|
| NH3: | -56.55776872 | -148,492.43 |
| BH3: | -26.61532364 | -69,878.54 |
| NH3BH3: | -83.22468907 | -218,506.44 |
| ΔE: | -0.05159688 | -135.47 |
The energy difference represents a bond enthalpy of 135.47kJ·mol-1, which is comparatively close to the recorded bond enthalpy of 130.12kJ·mol-1[4].
The BH3-THF Adduct
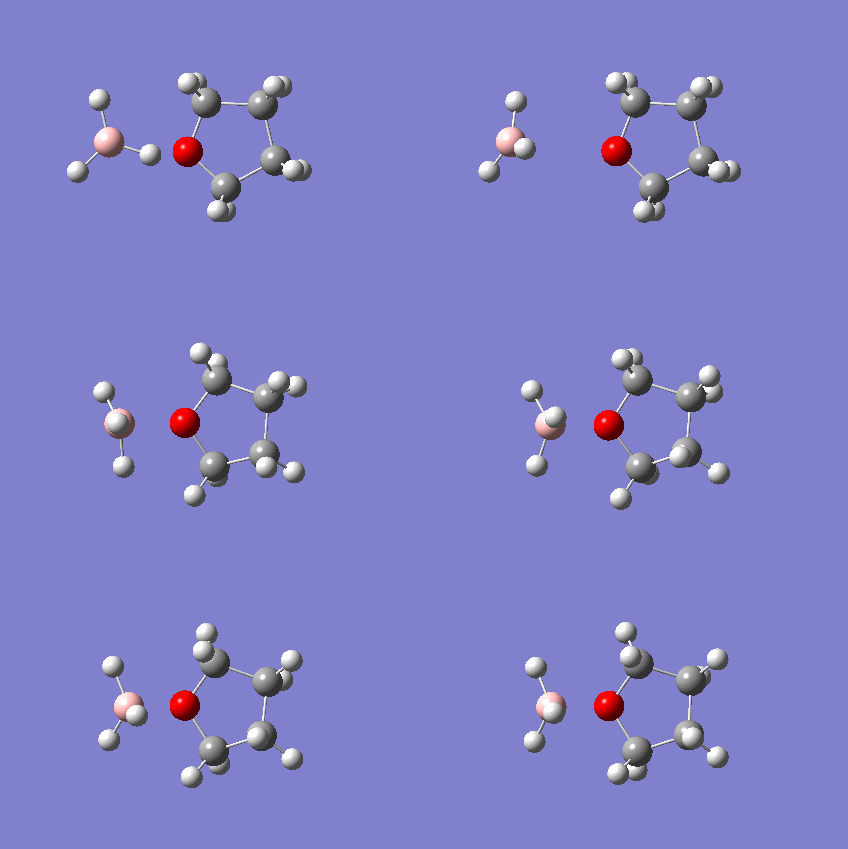
The reaction of ammonia and borane is not straightforward - in the gaseous phase, borane dimerises to diborane, and the reaction with ammonia gives the diammoniate salt. Typically, a borane THF adduct is used. The reaction of the borane monomer with THF was calculated on a 4-core computer and visualised on Gaussview. This was to demonstrate the performance of the new computers.
The reaction is as follows:
- BH3 + THF → BH3(THF)
Therefore the energy of the O→B bond is:
- ΔE = E(BH3(THF)) - E(THF) - E(BH3)
| Property | THF Opt | THF Freq | BH3(THF) Opt | BH3(THF) Freq | BH3(THF) Ultra Fine Opt | BH3(THF) Ultra Fine Freq |
|---|---|---|---|---|---|---|
| File type: | .log | .log | .log | .log | .log | .log |
| Calculation type: | FOPT | Freq | FOPT | Freq | FOPT | Freq |
| Calculation method: | RB3LYP | RB3LYP | RB3LYP | RB3LYP | RB3LYP | RB3LYP |
| Basis set: | 6-31G(d,p) | 6-31G(d,p) | 6-31G(d,p) | 6-31G(d,p) | 6-31G(d,p) | 6-31G(d,p) |
| Final energy: | -232.45493214 a.u. | -232.45293214 a.u. | -259.10941197 a.u. | -259.10941197 a.u. | -259.10941260 a.u. | -259.10941260 a.u. |
| Gradient: | 0.00013314 a.u. | 0.00013316 a.u. | 0.00001641 a.u. | 0.00001635 a.u. | 0.00000495 a.u. | 0.00000496 a.u. |
| Dipole moment: | 1.8164 Debye | 1.8164 Debye | 5.6555 Debye | 5.6555 Debye | 5.6561 Debye | 5.6561 Debye |
| Point group: | C1 | C1 | C1 | C1 | C1 | C1 |
| Calculation time: | 2 minute, 45.0 seconds | 2 minute, 32.0 seconds | 18 minute, 31.0 seconds | 2 minute, 32.0 seconds | 4 minute, 45.0 seconds | 6 minute, 16.0 seconds |
| Log File: | THF.LOG | THF Freq.LOG | BH3(THF) | BH3(THF) Freq | BH3(THF UF) | BH3(THF) UF Freq |
After 32 cycles and 18 minutes of processing on a desktop computer, the system converged:
Item               Value     Threshold  Converged?
 Maximum Force            0.000043     0.000450     YES
 RMS     Force            0.000010     0.000300     YES
 Maximum Displacement     0.000816     0.001800     YES
 RMS     Displacement     0.000221     0.001200     YES
 Predicted change in Energy=-2.993833D-08
 Optimization completed.
    -- Stationary point found.
However, the lowest frequency was too low for the system to be considered accurate.
Low frequencies ---  -19.1565   -0.0009   -0.0008   -0.0001    4.8530   13.8187
 Low frequencies ---   56.1338  171.4582  206.2434


Item               Value     Threshold  Converged?
 Maximum Force            0.000044     0.000450     YES
 RMS     Force            0.000016     0.000300     YES
 Maximum Displacement     0.001248     0.001800     YES
 RMS     Displacement     0.000489     0.001200     YES
 Predicted change in Energy=-4.178289D-08
 Optimization completed.
    -- Stationary point found.
A further 7 cycles were used to bring the system closer to the ground state.
Item               Value     Threshold  Converged?
 Maximum Force            0.000014     0.000450     YES
 RMS     Force            0.000002     0.000300     YES
 Maximum Displacement     0.000235     0.001800     YES
 RMS     Displacement     0.000063     0.001200     YES
 Predicted change in Energy=-1.424183D-09
 Optimization completed.
    -- Stationary point found.
Here the lowest frequency is within the tolerance threshold of -15 wavenumbers.
 Low frequencies ---   -9.3408    0.0007    0.0009    0.0011    4.9592   13.6031
 Low frequencies ---   50.4086  171.7010  203.3594


Item               Value     Threshold  Converged?
 Maximum Force            0.000024     0.000450     YES
 RMS     Force            0.000005     0.000300     YES
 Maximum Displacement     0.000252     0.001800     YES
 RMS     Displacement     0.000095     0.001200     YES
 Predicted change in Energy=-2.588702D-09
 Optimization completed.
    -- Stationary point found.
Comparing the energies of BH3(THF) with BH3 and THF:
| Molecule | Energy in a.u. | Energy in kJ·mol-1 |
|---|---|---|
| THF | -232.45493214 | -610,310.47 |
| BH3: | -26.61532363 | -69,878.54 |
| BH3(THF): | -259.10941260 | -680,291.81 |
| ΔE: | -0.0391562 | -102.81 |
A bond energy of 102.81 kJ·mol-1 was calculated. This is lower than the 135.46 kJ·mol-1 of ammonia borane formation, showing that the reaction is still exothermic, despite splitting the adduct.
References
- ↑ Balázs Réffya, Mária Kolonitsb, Magdolna Hargittai "Gallium tribromide: molecular geometry of monomer and dimer from gas-phase electron diffraction", Journal of Molecular Structure, Volume 445, Issues 1–3, 6 April 1998, 139-148, ISSN 0022-2860DOI:10.1016/S0022-2860(97)00420-1
- ↑ Schwerdtfeger, P. and Ischtwan, J. 1993, "Theoretical investigations on thallium halides: Relativistic and electron correlation effects in T1X and T1X3 compounds (X[DOUBLE BOND]F, C1, Br, and I)" J. Comput. Chem., 14: 913–921 DOI:10.1002/jcc.540140806
- ↑ Santiso-Quiñones, G. and Krossing, I. 2008, Reference Values for the B-X Bond Lengths of BI3 and BBr3. Z. anorg. allg. Chem., 634: 704–707 DOI:10.1002/zaac.200700510 .
- ↑ Yirong Mo, Lingchun Song, Wei Wu, and Qianer Zhang, Charge Transfer in the Electron Donor−Acceptor Complex BH3NH3, J. Am. Chem. Soc., 2004, 126 (12), 3974–3982 DOI:10.1021/ja039778l

