Rep:Mod3timarbab
Module 3 Physical Computational Techniques
Introduction
In this module three different reactions are followed. The first of these is the very familiar Cope rearrangement. This is a [3,3] sigmatropic shift. It is a (4n+2)π electron reaction occuring under heat. Therefore it proceeds suprafacially via a Hückle aromatic transition state. The reaction mechanism is shown below:
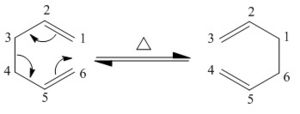
Note that the carbons have been numbered to emphasise the before and after position. This numbering is not for the naming of the shift.
The second reaction to be followed is the Diels Alder cycloaddition reaction occuring between 1,3-butadiene and ethene. The mechanism is shown below:

This reaction is another (4n + 2)π electron reaction. If it proceeds with heat then it will be the same as the previous reaction. That is to say via a Hückle aromatic transition state and suprafacial topology. If it proceeding via light then the reaction will proceed antarafacially and via a Möbius transition state. The transition state is known to take an envelope type shape.
The last reaction under investigation is a Diels Alder cycloaddition between cyclohexa-1,3-diene and maleic anhydride. The mechanism is shown below:

This is another (4n + 2)π electron reaction and the topology and type of transition state can be predicted by knowing if the reaction is proceeding via heat or light. As can be seen, two products are possible. These are the endo and the exo products. The endo product should be lower in energy than the exo product.
Cope Rearrangement
Optimising the reactants and products
Using GaussView a molecule of 1,5-hexadiene with an anti linkage was drawn. This was drawn so that, if one takes a Newman projection down one of the middle bonds, the two -CHCH2 are anti peri planar.
This was then optimised using the HF/3-21G level of theory. So the method was Hartree-Fock and the basis set was 3-21G. Under the link tab two things were changed. First of all "%chk=" was changed so the checkpoint file was placed into the desired directory, by placing the desired directory after the equals sign. Then "%mem" was changed to 250MB. Once the job had finished the checkpoint file was opened. The symmetry assigned to the molecule in the checkpoint file was C2. The moleucle obtained was the same as "anti 1" from the table in the wiki for module 3. The output file can be found here: Anti optimisation output

Then the Gauche form was drawn and optimised using the same method. This should give a molecule with higher energy because of steric hinderance between the two groups. Any increase in the amount of secondary bonding orbital interactions may however be able to compensate for this. Therefore it could be either more or less stable, it is difficult to guess. The symmetry was C1, the molecule was the same as "gauche 3" in the table on the wiki for module 3. The output file can be found here: Gauche optimisation output
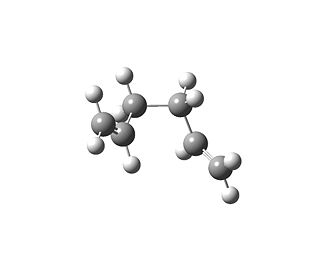
The total energy of the anti form found was -231.6926 a.u and the gauche form was -231.6927 a.u. The numbers show that the gauche form was slightly lower in energy. This also happens in general in the tables in the appendix of the lab script. This is because of natural bonding orbitals, which is a type of secondary bonding interaction. There is donation from the C=C π orbital into the C-H σ* orbital.[1] This can be interpreted as two MOs coming together. Therefore two MOs are formed. One is antibonding and the other is bonding. The electrons will go into the antibonding orbital with occordance with the Aufbau principle and Hund's rule. Therefore overall the energy will be lowered by this, this can be quantitatively treated via the Klopman-Salem equation. Two of these interactions are possible in the gauche conformation. This is favourable due to Deslongchamps' theorem that two stereochemical interactions are better than one. This makes the gauche conformation slightly lower in energy as the stabilisation from these interactions outweighs the destabilisation by steric hindrance.
The conformation corresponding to the Ci "anti 2" configuration was drawn and optimised using the HF/3-21G level of theory. The output molecule was then reoptimised using the B3LYP/6-31G* level of theory. The table below shows the results of both of the optimisations. The output files can be found by clicking on the label for the method in the table below.
| Method | Structure | Energy/a.u. |
| HF/3-21G | 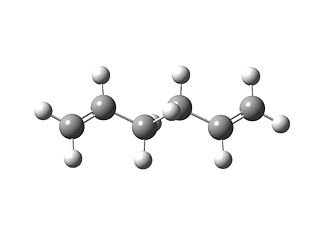 |
--231.69254 |
| DFT/B3LYP/6-31G(d) | 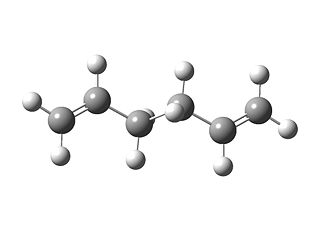 |
-234.55970 |
- Fig. 6: The results from the two optimisations
The second method, i.e. the DFT method, produced a more realistic structure. This can be seen by comparison with literature.[2] The bond lengths for the literature and the two different simulations have been tabulated below:
| Bond | Literature[3] | HF\3-12G | DFT\6-31G | |
| C=C | 1.340 | 1.316 | 1.338 | |
| C(H2)-C(H) | 1.508 | 1.509 | 1.507 | |
| C(H2)-C(H2) | 1.538 | 1.553 | 1.555 |
- Fig. 7: Comparison of the calculated bond lengths with those found experimentally.
The bond angles can also be found using GaussView, and have been tabulated with the literature values below:
| Angle | Literature[4] | HF\3-12G | DFT\6-31G | |
| C(H2)-C(H2)-C(H) | 111.5 | 111.3 | 112.6 | |
| C(H2)-C(H)=C(H2) | 124.6 | 124.8 | 125.2 | |
| C(H)=C(H2)-H | 128.9 | 119.7 | 122.0 | |
| C(H2)-C(H)-H | 116.8 | 115.5 | 115.6 | |
| H-C(H2)-H | 112.0 | 107.7 | 106.7 |
- Fig. 8: Comparison of the calculated angles with those found experimentally.
Figures 8 and 9 show that the two methods produce similar, but slightly different, structures. The bond lengths are certainly more accurate, in general, when using the DFT method. This is because they are closer to the experimentally found values.[5] This shows that the DFT method is more accurate than the HF method. The DFT method also returned a lower energy than the HF method. This indicates that it is more accurate.
The output from the second optimisation (the DFT optimisation) was used to then run a frequency analysis, using the same level of theory. The output file can be found here: Frequency optimisation output
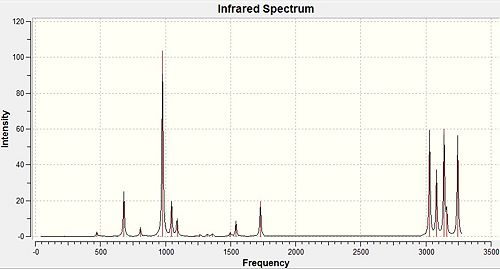
The output file clearly shows some important facts. The first row of values under "Low frequencies" should be 0. However, they are very small (orders of magnitude smaller) when compared to the second row of "Low frequencies". The fact that the energy obtained by the optimisation previously performed is a minimum can be confirmed. The frequencies are all positive therefore the energy is a minimum. The IR spectrum can also be produced. This is shown in figure 9 above.
| Type | Energy/a.u. | |
| Sum of Electronic and Zero-point Energies | -234.416245 | |
| Sum of Electronic and Thermal Energies | -234.408010 | |
| Sum of Electronic and Thermal Enthalpies | -234.408010 | |
| Sum of Electronic and Thermal Free Energies | -234.447848 |
- Fig. 10: The various different parameters noted down from the frequency output file.
The energies relate to various different thermodynamic properties. The way that each of the energies relates is:
Sum of Electronic and Zero-point Energies: E = Eelec + ZPE. The potential energy at 0K + the zero point energy.
Sum of Electronic and Thermal Energies: E = E + Evib + Erot + Etrans. The energy at room temperature and pressure (298.15K and 1atm) including contributions from the different degrees of freedom translational, rotational and vibrational.
Sum of Electronic and Thermal Enthalpies: H = E = RT. Contains the correction for "RT" this is important for dissociation reactions.
Sum of Electronic and Thermal Free Energies: G = H - TS. G is the Gibbs free energy. Includes the entropic contribution ("-TS") to the free energy.
Optimising the Chair and Boat Transition States
Here the chair and boat transition states were calculated and optimised. These are different from each other and have different symmetry. The chair has C2h and the boat has C2v.
Chair
An allyl fragment (CH2CHCH2) was drawn in Gaussview and optimised in Gaussian using the HF/3-21G level of theory. The output from this can be found here: Allyl fragment output
Then two molecules of this output were pasted into the same window in Gaussview. They were arranged in space so that they were roughly the shape of the chair transition state. An optimisation and frequency calculation was run. The optimisation was set to "Optimisation to a TS (Berny)", the force constants were selected to be calculated and "Opt=NoEigen" was placed in the "Additional keyword" box. The output file for this is here: Optimisation and frequency of chair transition state
The transition state was then optimised using the frozen coordinate method. The two allyl groups were again placed so they were roughly in the same geometry of the chair transition state. Then the "Redundant Coord Editor" was selected and the two carbons that were going to form a bond. These were selected to "Bond" and "Freeze Coordinate". This was repeated for the other two carbons that were going to bond. Then the calculation was set to be an optimisation using the HF/3-21G level of theory and "Opt=ModRedundant" was put in the "Additional keywords" box. This was then sent to be optimised via Gaussian. The output file for this optimisation can be found here: Frozen Coordinate Optimisation optimisation
The checkpoint file for the previous optimisation was opened. The bond distances were then optimised. The "Redundant Coord Editor" was opened and a new coordinate was added. The two carbons that would form a bond during the reaction were then selected and they were set to "Bond" and "Derivative". This was repeated for both of the ends that would end up bonding together. Then it was set to do an optimisation and to "Optimise to a TS (Berny)" with the force constants calculation set to "Never". This job was then submitted to Gaussian. The output file: Bond distance optimisation
- Fig. 11: The outputs of the two different optimisations (through a transition state (Berny) and the Frozen Coordinate Method).
As the table shows, both of the optimisations produce the same vibration. This is the vibration showing the reaction occuring. This was the same for both optimisations, with the numbers only differing slightly after the decimal point. This shows that the mechanism is a concerted mechanism. This is in line with the theoretical understanding of pericyclic reactions. The distance between the carbons that end up bonding to eachother is 2.02Å in both cases.
Boat
The boat transition state was then optimised. This was done using the QST2 method. The checkpoint file for the optimised Ci molecule, labelled as anti2, was opened and the moleucle was copied and pasted selecting Add to Molecule Group. The two molecules were then placed side by side, in different groups, so that the geometries and labels of the atoms of the two molecules were the same as they are below:

If the job is set up now then it will fail. The molecules shapes need to be adjusted. The dihedral angle of the middle carbons (C2-C3-C4-C5 on the reactant and C2-C1-C6-C5 on the product) was set to 0°. Then the three atoms C2-C3-C4 were selected and the angle was changed to 100°. This was repeated for C3-C4-C5 and for the corresponding atoms on the product. The molecules were then twisted to appear as below:
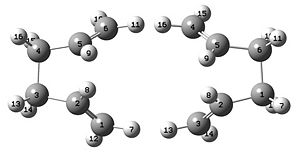
Now the calculation can be set up. The job type was an optimisation and frequency analysis ("Opt+Freq") and it was optimised to a transition state selecting "TS(QST2)". The calculation was then run. The output file can be found here: Boat TS QST2 Optimisation
| Optimised Using QST2 | ||||
| Optimised TS Structure | 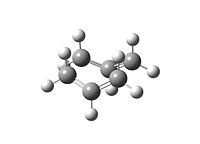 | |||
| Terminal C-C bond length/Å | 2.14 | |||
| Energy/a.u. | -231.60280 | |||
| Imaginary Frequency/cm-1 | -840 | |||
| Animation |
|
- Fig. 14: The product of the QST2 optimisation on the boat transition state.
The table shows the imaginary frequency. This is at -840cm-1 and shows the transition state. This again shows the reaction mechanism. As before, it shows a concerted pericyclic mechanism. The vibration is similar to the one for the chair structure calculated above. The distance between the carbons reacting was 2.14Å. This was longer than the previously found distance. This is because of the difference in structures and shapes. The energy of the chair structure was lower, as expected. This shows that the chair is the favoured transition state. In other words, the reaction is more likely to occur via the chair transition state.
Calculating Activation Enthalpies
Intrinsic Reaction Coordinate Method
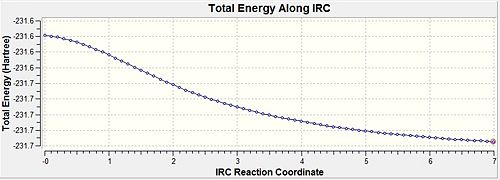
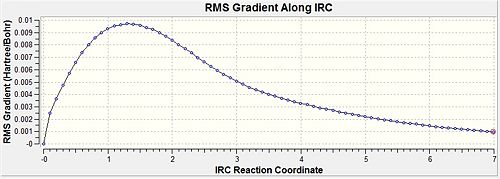
The minimum energy path from the transition state to its local minimum on a potential energy surface was found. This is the Intrinsic Reaction Coordinate (IRC) method. This was run on the structures. The checkpoint file for the optimised chair transition structure was opened. Then the job type was changed to IRC, the direction was set to only the forward and the number of points along the IRC was set to 50. The job was then run. The output file can be found here: [CHAIRREDUNDANTST2IRC link ]
The reaction was also run with 70 points calculated instead of 50. Output file: [link if it can be uploadedMethod 2]
The results from the two calculations are summarised in the table below:
| Number of Points Along IRC | 50 | 70 | ||||
| Final Structure | ||||||
| Energy/a.u. | -231.68049 | -231.68728 | ||||
| IRC Pathway |  |
| ||||
| IRC Gradient |  |
|
- Fig. 15: The output of the IRC method comparing 50 and 70 data points.
The 70 point yielded a lower energy. This shows that 50 points was not enough to actually get a minimum in energy. Had 50 points been enough then the energy would be the same for both of them. Both have produced the gauche conformation. They produced a form which was not in the table in the wiki for this module.
The output of the IRC was also optimised in the standard way using the HF/3-12G level of theory. The output file: Method 1

As the summary shows, this is an incredibly quick and easy way to optimise the output of the IRC. This has produced the structure that was referred to as gauche2 in the wiki for the course.
Calculating Activation Energies
The chair and boat transition structures, obtained via HF/3-21G level of theory, were optimised using the B3LYP/6-31G* level of theory and a frequency calculation was run to obtain thermodynamic information. A summary of the thermodynamic information obtained via these calculations are shown below:
INSERT TABLE
Fig. 17: A summary of the thermodynamic information.
Diels Alder Cycloaddition Between 1,3-butadiene and ethene
Optimising the Reactants
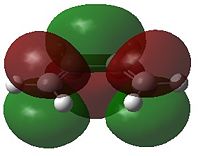
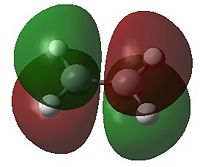
The two reactants, 1,3-butadiene and ethene, were drawn in GaussView and then optimised using the AM1 method. Then the molecular orbitals, particularly the HOMO and LUMO, were visualised.
| HOMO | LUMO | HOMO | LUMO | |
| Molecular Orbital | 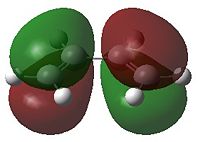 |
 |
 |
|
| Energy/a.u. | -0.228 | -0.031 | -0.270 | 0.018 |
| Symmetry | Antisymmetric | Symmetric | Symmetric | Antisymmetric |
- Fig. 17: The HOMO and LUMO of the two reactants, as visualised by GaussView after calculation by Gaussian.
Only MOs of the same symmetry are able to interact to form a non bonding and a bonding interaction. The HOMO of 1,3-butadiene can therefore interact with the LUMO of ethene. The HOMO of ethene can interact with the LUMO of 1,3-butadiene
Optimising the Transition State
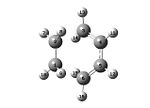
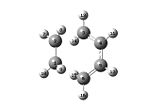
The transition state has an envelope structure. This maximises the overlap between the π orbitals on the ethene and the π system of butadiene. The transition structure was drawn by placing the output of the reactants optimisations above. The two were then moved so they resembled the envelope shape of the transition state. Two different levels of theory were used. These were the semi empirical AM1 and the DFT/B3LYP/6-31G (d) level of theory. Two different methods of optimisation were used. The method of optimising to a transition state (selecting optimisation and then "Optimise to a TS(Berny)") and the frozen coordinate method. A frequency analysis was then carried out on the results of all 4 calculations.
| Method | Semi-empirical/AM1 - Frozen Coordinate Method | Semi-empirical/AM1 - TS (Berny) | DFT/B3LYP/6-31G(d) - Frozen Coordinate Method | DFT/B3LYP/6-31G(d) - TS (Berny) | ||||||||||||
|---|---|---|---|---|---|---|---|---|---|---|---|---|---|---|---|---|
| Optimised Structure | 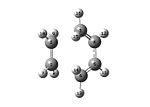
|
|
|

| ||||||||||||
| Energy/a.u. | 0.11166 | 0.11165 | -234.54390 | -234.54390 | ||||||||||||
| Imaginary Frequency/cm-1 | -956 | -955 | -690 | -525 | ||||||||||||
| Animation |
|
|
|
|
- Fig. 18: The results from the optimisations of the transition state.
The vibration shown in the vibration corresponding to the reaction occurring. This may not work. If it doesn't then one needs to right click, choose "31/44" and select the vibration corresponding to the number in that column of the table. The vibrational mode shows the reaction occurring. It shows that the reaction is a concerted cycloaddition and the carbons that it reacts with. The two DFT models are both the same vibration. However the number produced for the vibration is slightly different for the two methods. All of the bond lengths of bonds between two carbon atoms were found and tabulated in the table.
| Carbons bond is between | Bond Length/Å | |||
|---|---|---|---|---|
| Numbers from figure 18 | AM1 RCM | AM1 TS(Berny) | DFT RCM | DFT TS(Berny) |
| 1-2 | 1.38 | 1.38 | 1.39 | 1.39 |
| 3-4 | 1.38 | 1.38 | 1.38 | 1.38 |
| 4-5 | 1.40 | 1.40 | 1.41 | 1.41 |
| 5-6 | 1.38 | 1.38 | 1.38 | 1.38 |
| 2-3 | 2.12 | 2.12 | 2.27 | 2.27 |
| 1-6 | 2.12 | 2.12 | 2.27 | 2.27 |
- Fig. 19: The bond lengths obtained by the various different calculations
The typical C-C bond length is 1.54Å, and the typical C=C bond length is 1.34Å.[6] The table (figure 19) shows that the C=C double bonds are roughly this length. They are slightly longer. This is to be expected because they are in the process of breaking and forming single bonds. Therefore it is only logical that they should be slightly longer than the normal length of a C=C bond. The "C-C" bonds are much larger than the literature value for a typical C-C bond. This makes sense as these bonds are not formed yet. The two molecules are close and are reacting but the bonds have not yet been completely made. So it is only logical that, at this stage, the "C-C" length should be quite large relative to a normal C-C bond. Importantly this length is lower than the combined Van der Waals radii of the two carbons. This means that the orbitals can overlap and so the bonds can form. The Van der Waals radii for carbon is 1.70Å.[7] 1.70 multiplied by two is 3.40Å. This is less than the value obtained here, therefore overlap can occur. Later in the reaction coordinate the bond length would be shorter. The 4-5 length is slightly longer. This is because this bond was a single bond that is in the process of becoming a double bond. The table shows that all the optimisations produced extremely similar results.
Visualising the Molecular Orbitals of the Transition State
The molecular orbitals of the transition state were visualised using GaussView. These can be used to deduce which of the reactants orbitals are interacting.
| Semi-empirical AM1 - TS (Berny) | DFT - TS (Berny) | |||
| HOMO | LUMO | HOMO | LUMO | |
| Molecular Orbital | File:AM1HOMO | File:AM1LUMO | 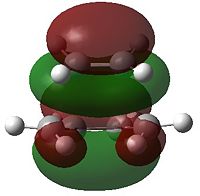 |

|
| Energy/a.u. | homo | lumo | -0.219 | -0.009 |
| Symmetry | Antisymmetric | Symmetric | Symmetric | Symmetric |
- Fig. 20: The HOMO and LUMO of the transition state for the AM1 and DFT TS(Berny) Optimisations
The DFT method MOs show that the HOMO is made up of the HOMO from ethene and the LUMO of butadiene. Using quantum mechanics these two forming the HOMO makes sense. If a chain is conjugated then the longer the length of the chain the larger the band gap between the HOMO and the LUMO. The HOMO and LUMO get closer together. The LUMO lowers in energy while the HOMO increases in energy. This means that here the HOMO of butadiene will be higher in energy than the HOMO of ethene. Therefore the HOMO of the product is likely to be formed by the HOMO of ethene. The LUMO is made from the LUMO of ethene and the HOMO of the butadiene. Both of these makes sense as they were of the same symmetry and so were able to interact.
Diels Alder Cycloaddition Between Cyclohexa-1,3-diene and Maleic Anhydride
Optimising the Reactants
The reactants, cyclohexa-1,3-diene and maleic anhydride, were drawn out in GaussView. They were then optimised, separately, using the AM1 method. The molecular orbitals were then visualised
| HOMO | LUMO | HOMO | LUMO | |
| Molecular Orbital |  |
 |
 |

|
| Energy/a.u. | -0.200 | -0.017 | -0.300 | -0.134 |
| Symmetry | Antisymmetric | Symmetric | Symmetric | Antisymmetric |
- Fig 21: The HOMO and LUMO of the reactants, as produced by GaussView.
Again only orbitals of the same symmetry are able to overlap and form a bonding and antibonding interaction. The HOMO of one and LUMO of the other are the correct symmetry to overlap. The HOMO and LUMO will be able to strongly interact as they are close in energy (relatively) and therefore can strongly overlap and form a bonding orbital of considerably less energy than the HOMO in the interaction. This means the reaction is thermodynamically favourable.
Optimising the Transition State
The optimised structures for the reactants, produced above, were then copied into the same window in GaussView. They were then arranged in space so that the relative geometries resembled the transition state under investigation. This was done for both the endo and the exo forms. The frozen coordinate method was used to set the bonds between the carbon atoms that should be bonding to 2.2Å. An optimisation and frequency calculation was the carried out using the AM1 method and with the additional keywords "Opt=NoEigen". It was set to optimise to a transition state (again Optimise to a TS(Berny)).
| - | Exo | Endo | ||||||||||||||
|---|---|---|---|---|---|---|---|---|---|---|---|---|---|---|---|---|
| Semi-empirical/AM1 - Freeze | Semi-empirical/AM1 - TS(Berny) | Semi-empirical/AM1 - Freeze | Semi-empirical/AM1 - TS(Berny) | |||||||||||||
| Final Structure | File:EXORCM | File:EXOTS
|
File:ENDORCM | File:ENDOTS
| ||||||||||||
| Energy/a.u. | -0.05098781 | -0.05041860 | -0.05238816 | -0.05150443 | ||||||||||||
| C-C Bond Forming Length/Å | - | - | - | - | ||||||||||||
| Imaginary Frequency/cm-1 | - | - | - | - | ||||||||||||
| Animation |
|
|
|
| ||||||||||||
Fig. 22: The results of optimising the endo and exo transition states.
Secondary Bonding Interactions
Secondary orbital overlap can be extremely important. It has already been shown above how these interactions actually changed the preffered conformation of 1,5-hexadiene.
INSERT PICTURE Fig. 23: Diagram showing the transition states orbitals and their interaction.
The molecular orbitals of the two transition states were visualised in GaussView. The diagram above shows that the endo form is more stable than the exo form.
fasdf
INSERT THE PICTURE
Fig. 24: Molecular orbitals of the endo and exo transition states.
Conclusion
q
References
- ↑ B. G. Rocque, J. M. Gonzales and H. F. Schaefer, Mol. Phys., 2002, 100, pp. 441-446.
- ↑ G. Schultz and I. Hargitta, J. Mol. Struc., 1995, 346, pp. 63-69.
- ↑ [2]
- ↑ [2]
- ↑ [2]
- ↑ G. Schultz and I. Hargitta, J. Mol. Struc., 1995, 346, pp. 63-69.
- ↑ M. Mantina, A. C. Chamberlin, R. Valero, C. J. Cramer and D. G. Truhlar, J. Phys. Chem. A, 2009, 113 (19), pp. 5806–5812.

